Business statistics 1 assignment 2 individual case study state what experts say about child mortality under the age 5
Bạn đang xem bản rút gọn của tài liệu. Xem và tải ngay bản đầy đủ của tài liệu tại đây (539.53 KB, 13 trang )
Course Code
Business Statistics- ECON1193
Campus
RMIT University Vietnam, Saigon
Student name & ID
Nguyen Le Thien Quynh- s3777295
Lecturer
Ms. Greeni Maheshwari
Class time
Thursday 8AM-11AM
Word count
3137 words
Date of submission
15th December 2019
Business Statistics 1
Assignment 2
Individual Case Study
Contents
1
1. Introduction………………………………………………………….3
2. Descriptive Statistics and Probability……………………………...4
3. Confidence Intervals………………………………………………...7
4. Hypothesis Testing…………………………………………………..7
5. Regression Analysis………………………………………………….9
6. Conclusion……………………………………………………………11
7. Reference…………………………………………………………….12
Part 1: Introduction
2
State what experts say about child mortality under the age 5
Global description:
Child mortality is known as the death of child who under the age of five (Max R, Hannah R
and Bernadeta D 2013). According to World Health Organization (2019), the total number of
under-five child mortality has dropped by 7.3 million in 2018. On average, only 15,000 of
child under-5 die per day when compared with 34,000 in 1990. The mortality rate has
deducted approximately by 59% leading to the reduction of 39 deaths per 1,000 live births in
2018. Although the world mortality rate of child has declined significantly, there are others
country and regions still account for high rate in this figure. In particularly, Sub-Saharan
Africa has the highest under-5 mortality rate in the global, with 1 in 13 infants who suffers
with the death before having his or her fifth birthday celebrations (WHO 2019).
Why is it important to decrease the child mortality rate
The most frequently causes of mortality in child under-5 were pneumonia (18%), preterm
birth complications (14%),diarrhoea (11%) and malaria (7%) (UNICEF 2012). The death of
child is an enormous tragedy, therefore it is critical to decrease the mortality rate. Hence, the
goals of United Nation SDG 3 are to diminish the newborn mortality rate to at least 12 per
1,000 births in each nation and lower the under-5 mortality rate to the minimum 25 per 1,000
births (WHO 2019). Therefore, urgent action is needed to reduce the mortality rate in order to
reach the SDG targets by the end of 2030. There are 121 out of 195 countries have achieved
the goals on under-five mortality (WHO 2019). The protection of child right to live will lead
to the requirement of solving inequities, disparities in maternal and infant health, thus
ensuring a great knowledge about what causes child mortality to help planning and guiding
policymaking. As part of SDG targets, decreasing mortality rate will also contribute in
building a more sustainable future, therefore addressing the problems that facing globally
(United Nations n.d)
Relationship between GNI and child mortality rate
There is a relationship between the Gross National Income (GNI) and the child mortality. It
is believed that wealthier people will be healthier as described by the life expectancy and
child deaths within the nations, additionally the higher income levels connect closely with
better health outcomes for the countries (Preston 1975 & Pritchett, Summers 1996). In
contrast, other study claims that in 1990, approximately 0.5 million child deaths could lead to
a poor economic performance (Pritchett & Summers n.d). Although improving the health
system is a significant factor to reduce the mortality rate, number of studies show that
socioeconomic factors, which are affected by the increase of GNI, have been an important
element of mortality diminishing over the last few decades. For instance, experts stated that
there is no “magic bullet” in deducting the under-5 child mortality rate, but elements such as
women’s education and literacy will promote the real average per capita, particularly
household income, environmental conditions (Rutstein, Cornia & Mwabu n.d).Other finding
reflects that the decline in mortality rate depends on the development of effective maternal
and primary health care services, which are still lacking in several developing regions (Sarah
Neal & Jane Falkingham, 2014). Therefore, we cannot deny that there is a connection
between GNI and mortality rate of child who under-5, meaning higher GNI figures of the
nation will lead to the reduction in death rates.
3
Part 2: Descriptive Statistics and Probability
A.Categories:
Year
Country name
2015
2015
2015
2015
Malawi
Mali
Rwanda
Senegal
Year
2015
2015
2015
2015
2015
2015
2015
2015
2015
2015
2015
2015
2015
2015
2015
2015
Year
2015
2015
2015
2015
2015
2015
2015
2015
Low income countries (LI), GNI < $1000
GNI per capita, Atlas
method (current US$)
340
790
710
980
Middle income countries (LI), GNI $1000-$12,500
Country name
GNI per capita, Atlas
method (current US$)
Argentina
11.6
Colombia
15.8
Cote d'lvoire
95.1
El Salvador
15.5
Indonesia
27.3
Iran
15.7
Lao PDR
66.1
Mongolia
18.8
Morocco
28
Myanmar
52.7
Russian
8
Samoa
17.7
Serbia
6.2
Timor-Leste
51.6
Turkey
13.6
Vietnam
22
High income countries (LI), GNI > $12,500
Country name
GNI per capita, Atlas
method (current US$)
Austria
47630
Bahamas
27920
Belgium
44230
Croatia
12950
Estonia
18380
France
40730
Germany
45790
United Kingdom
43720
Probability
Contingency Table
Low-income
4
Middle-income
High-income
Total
High child
mortality rate
under 5 (H)
Low child
mortality rate
under 5 (L)
Total
P(LI/H) = 4/19
P(LI)= 4/28
countries (LI)
4
countries (MI)
14
countries (HI)
1
19
0
2
7
9
4
16
8
28
P(MI/H) =14/19
P(MI)=16/28
P(HI/H) =1/19
P(HI)=8/28
As can be seen from the table, the probability of the under-5 child mortality rate in lowincome (LI) countries is 4/19, while the probability of LI countries in total presented at 4/28.
Therefore, these figures are considered as dependent events. Similarly, with the figures in MI
and HI countries, the probabilities of mortality rate and total are different, which leading to
the dependent events. Additionally, the total probability of LI and MI countries is 15/19 that
is higher than when compared with the figure of HI countries, thus the high child mortality
under 5 often occurred at developing countries such as LI and MI.
B. Compare and Analysis
i.
Measurement of Central Tendency
LI
MI
HI
Mean
65.825
29.1
4.8375
Mode
No mode
No mode
3.9
Median
54.3
18.25
3.95
Figure 2.4: Measurement of Central Tendency of under-5 child mortality rate in
low, middle- and high-income countries
In fact, there is no best measure in central tendency. Besides, it depends on the data
types, such as nominal or continuous. According to the table above, there is “no mode” in low
and middle-income countries, therefore mean and median are the best alternative choices.
However, since the mean is easily affected by the outliers, I decided to choose median which
will be more suitable and supportive for the comparation and analysis. Regarding the table
2.4, we can see that the median of low-income countries (54.3) is almost triple the figure of
middle-income countries (18.25) and much higher than when compared with high-income
nations (3.95). Therefore, it shows that the developed countries are healthier because of the
investment in health care system, which leading to the lower child mortality rate.
ii.
Measurement of Variation
LI
MI
HI
Range
73.7
88.9
7.9
IQR
25.625
18.875
0.675
Standard Deviation
33.13
6.17
0.89
Coefficient of Variation
33.13
24.68
2.54
Figure 2.5: Measurement of Variation of under-5 child mortality rate in low,
middle- and high-income countries
The coefficient of variations illustrates the extension of variables of data in a mean of
population (Adam Hayes, 2019). The higher the CV, the more risks will occur. In this
scenario, the coefficient value of LI and MI are 33.13 and 24.69 respectively, which are much
5
higher than HI. This means in these countries; the child mortality rate is greater than highincome nations. This happens because the developing countries might be lack of health-care
systems. Additionally, the reason why I choose coefficient for the analysis is because
coefficient variation provides the accessibility to estimate the risk and prediction. Hence, it is
believed to be the most reasonable measurement.
iii.
Min
Q1
Median
Max
Q3
Box-and-whisker plots:
LI
MI
HI
40.5
6.2
3.1
47.25
15.025
3.825
54.3
18.25
3.95
114.2
95.1
11
72.875
33.9
4.5
Figure 2.6: Box and whisker plots of under-5 child mortality rate in low, middleand high-income countries
According to the shape, it can be notice that the right box of under-5 child mortality in lowincome countries is 18.575 (Q3-Q2) > 7.05 (Q2-Q1) and right whisker 41.325 (Max-Q3) >
left whisker 6.75 (Q1-Min) and hence the shape of the distribution is right-skewed. Similarly,
with other countries in middle and high-income, the shape of distribution is also rightskewed.
Part 3: Confidence Intervals
a. Calculate confidence intervals for the world average of Child mortality rate
under the age of 5 (per 1,000 live birth)
o
o
o
o
o
6
Level of significance: α=0.05 =5%
Level of confidence: 1- α = 1-0.05=0.95=95%
Sample size: n=28
Sample mean: X : 27.42
Standard Deviation: S= 28.87
o
α=0.05 , degree of freedom= n-1=27
o Use T-online calculator: t= = 2.0518
s
o => μ= X : +/- t*(
)= 16.23 ≤ μ ≤ 38.6
√n
o With 95% level of confidence, we can say that the world average of child
mortality rate under the age of 5 (per 1,000 birth) is between 16.23 and 38.6.
b. Discuss whether and why the assumptions are required or not to calculate these
confidence intervals
As population distribution is unknown and sample size is 28< 30 then CLT is not
applicable and hence we assume that population is normally distributed and standard
deviation of ¯ X is normally distributed.
c. Suppose the world standard deviation of each variables is known. Discuss the
possible impact on the confidence interval results.
σ
)
√n
2 zσ
W=
√n
μ= X + z (
The confidence intervals are affected by 4 components including X , z , standard deviation
and sample size. Hence, the relationship between confidence intervals and sample size is
indirect. By looking at the formula, we can see that if the sample size “n” increases, the width
of confidence intervals will be narrowed. Therefore, as the spreading level is lower, the
outcomes will become more accurate and less error occurs. On the other hand, as the sample
size and confidence level are direct relationship, meaning the rising in z value will lead to the
expansion of confidence intervals. As a result, the outcomes turn out to be less accurate.
Part 4: Hypothesis Testing
A. Regarding the report from WHO 2013, the world average child mortality rate is 46
deaths per 1,000 birth, whereas from the confidence intervals calculated in previous part,
the child mortality rate is between 16.23 and 38.6 deaths per 1,000 birth. Nonetheless,
the figure of child mortality rate has decreased significantly from 42.4 in 2015 to 38.6 in
2018 (World Bank 2018). Therefore, we can say that the world average child mortality
will continue to decrease, which is the good signal for the world.
Hypothesis testing:
μ=46( deaths )
n=28
X =27.42
S=28.87
α =0.05=5 %
CL: 95%=0.95
7
1. As population distribution is unknown and sample size is 28< 30 then CLT is not
applicable and hence we assume that population is normally distributed and sampling
distribution of X is normally distributed.
2. Ho; μ ≤ 46 (claim) ; H1; μ>46
3. As population SD is unknown, we use t-table
4. Upper tail
5. At the significant level of 0.05 and degree of freedom 27, CV(t)=> t=2.0518
X−μ
=¿
s
-3.41
6. Test statistic: t=
√n
7. As test statistic falls in non-rejection region, hence we do not reject Ho.
Ho
-3.41
0
2.0518
8. As we do not reject Ho, hence with 95% level of confidence, we can say that the
world child mortality rate in 2015 is less or equal 46 deaths per 1,000 births.
9. As we do not reject Ho, we might have committed type II error, we can say that the
world average child mortality is no more than 46 deaths per birth, but actually the
world average child mortality can be more than 46 deaths per birth.
There are two approaches to eliminate the errors, which are accumulating the
significant level or the sample size. Nonetheless, in this scenario, extending the
sample size is considered to be more reasonable and acceptable among other methods.
The reason is because there are 195 countries in total, whereas the sampling gathered
data only from 28 nations.
B. The possible impact on the hypothesis testing result when the number of countries
of the data set will triple
Assume that the number of countries is triple, and other data remain the same, as the sample
size is triple => n=28*3= 84
X−μ
s
Applying this formula to calculation new critical value: t=
= -5.989
√n
Compare: t(n=28) = -3.41> t(n=84) = -5.989
We can see that the new critical value is also outside the rejection region, hence we do not
reject Ho.Therefore, we can conclude that when expanding the sample size to triple, the
8
statistical decision still remains unchanged. In conclusion, as the results stay the same, the
increasing of sample size leads to more accurate outcomes.
Part 5: Regression Analysis
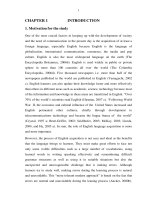
A. By observing the scatter plot 2, it is clear that the data is declining and is on a negative
trend. This explains that the investment in measles immunization could lead to the
deduction in child mortality rate. Moreover, the data set concentrated closely at the end
of the trendline, meaning the R square will be higher leading to less error occurs, also
stronger relationship between under 5 child mortality rate and the measles
immunization.
Motality rate, under 5 (per 1,000 birth)
Immunization, measles (% of children ages 12-23 months)
120
100
80
Predicted 11.6
Linear (Predicted 11.6)
60
40
20
0
65
70
75
80
85
90
95
100
105
Immunization, measles (% of children ages 12-23 months)
Scatter plot 2: The relationship between under-5 child mortality and immunization measles
Dependent variables: Mortality rate, under-5 (per 1,000 live births)
Independent variables:
Domestic general government health expenditure per capita, PPP (current
international $)
Immunization, measles (% of children ages 12-23 months)
Compulsory education, duration (years)
GNI per capita, Atlas method (current US$)
P-VALUE
Domestic general
government
health
expenditure per
capita, PPP
(current
international $)
Immunizatio
n, measles
(% of
children
ages 12-23
months)
Compulsory
education,
duration
(years)
GNI per
capita, Atlas
method
(current US$)
0.0027
0.0002
0.0599
0.0023
Figure 5.1: The P-value of 4 variables
9
The table above shows the p-value of four factors that affect the mortality rate of low,
middle and high-income countries. It is noticeable that the p-value of immunization measles
is the lowest (0.0002) when compared with three other factors. Additionally, the significant
level is 0.05, which are greater than p-value of immunization measles. This means the two
variables have the relationship with each other. To conclude, as the immunization measles has
the lowest p-value indicates the most significant variable.
Simple Linear Regression Equation:
^
Y =
b0 +
b1 X
Under 5 child mortality = b0 + b1 x % of measles immunization (children ages
12-23 months)
= 199.198 – 1.918 x % of measles immunization (children ages 12-23 months)
Interpret the regression coefficient (slope):
b0 =¿ 199.198 shows the value of child mortality when there is no immunization
measles because the regression line cuts the y-axis where x=0. This means when the
percentage of immunization measles is zero, the average of child mortality rate is
around 199.198 deaths per 1,000 birth.
b1=−1.918 presents the average decline by 1.918 (per 1,000 birth) in the child
mortality rate when the immunization measles increases by 1 percent of total output.
Interpret the coefficient of determination (R-square)
R2 = 42.8% (0.428). This means that the 42.8% of variation in child mortality can
be explained by variation in immunization measles and remaining (100-42.8%) 57.2%
of variation in child mortality an may be due to other factors.
B. Two other variables that will affect the child mortality rate.
In general, levels of child mortality rate have dropped considerably over the last
century due to the improvement in healthcare system, especially in high-income
countries. However, there are several countries whose under-five child mortality rate are
still alarmingly high, specifically in developing categories countries. According to
10
Gordon (2009) study shows that there is a relationship between mother’s years of
education and the mortality rate. It claimed that the better levels of maternal education
could lead to the reduction of the probability of a child’s death before the age of five.
Inversely, the increase in mother’s age also spurring the mortality rate. Similarly,
Demographic and Health Survey (DHS) programme found that components such as
“environmental health factors” also contribute in changing the trend of mortality rate.
Removing contaminants from the living environment of the children is a crucial means
of preventing the elements of health that might lead to death. In most of developed
countries, the decline in mortality rate has come from the improvement in environmental
health, particularly water purification, trash and garbage collection and diminishing in
food contaminations (Bulletin of the World Health Organization 2000).
Part 6: Conclusion
Overall, we can see that high-income countries tend to have higher under-5 child
mortality rate when compared with others developing countries, especially low-income
categories. To be more precise, we can take a look at the mean (average) of LI, MI and
HI countries, at 65.8, 29.1, 4.8, respectively. Clearly, the figure for HI countries is the
lowest (4.8), meaning the child mortality rate of developed countries is not rising
alarmingly. Meanwhile, the figure of LI is the highest (65.8), particularly in Sub-Sahara
area, the child mortality is increased significantly (WHO 2019). Therefore, certain
actions need to be applied to help reduce the mortality rate and achieve the SDG goals.
Additionally, the hypothesis testing shows that the mortality rate is less than or equal
46 deaths per 1,000 birth. The results indicate that the rate is on the decline trend,
meaning in the long-term, the data might keep decrease or remain constant. This is the
good signal for the world since the mortality rate is not rising rapidly like it was in the
past.
Last but not least, regarding the outcomes of regression analysis, we can say that there
is still a relationship between child mortality and the variables such as education, GNI,
as well as the immunization measles. Higher-income countries with higher GNI,
education can lead to the reduction in mortality rate. This happens because these
countries provide the residents with better living standard due to the high GNI rate, and
advance health-care system for the infant. These factors also considered as an important
criterion to determine the mortality rate. Moreover, there is a strong relationship
between under-five child mortality rate and the immunization measles. The countries
with high immunization measles rate will help deduct the mortality rate.
11
References:
Adam Hayes 2019, Coefficient of Variation (CV), Investopedia, viewed 11th December 2019,
< />Max Roser, Hannah Ritchie and Bernadeta Dadonaite 2019, “Child & Infant Mortality”,
OurWorldInData.org., viewed 1st December 2019, < >
Sarah N & Jane F, 2014, ‘Neonatal Death and National Income in Developing Countries: Will
Economics Growth Reduce Deaths in the First Month of Life?’, International Journal of
Population Research, vol. 2014
Shea O. nd, Factors associated with trends in infant and child mortality in developing
countries during the 1990s, World Health Organization, viewed 5th December 2019,
< />UN Inter-agency Group for Child Mortality Estimation 2019, Levels & Trends in Child
Mortality, UN Inter-agency Group for Child Mortality Estimation, viewed 2nd December
2019, < />UNICEF 2019, Children survival and the SDGs, UNICEF, viewed 1st December 2019,<
>
World Bank nd, Mortality Rate, under-5(per 1,000 live births), World Bank, viewed 10th
December 2019, < />end=2018&start=2015>
World Health Organization 2017, Causes of child mortality, World Health Organization,
viewed 1st December 2019, << />World Health Organization 2019, Children: Reducing mortality, World Health Organization,
viewed 1st December 2019,< >
12
13