Tài liệu Trends in the Fees and expenses of Mutual Funds, 2010 pptx
Bạn đang xem bản rút gọn của tài liệu. Xem và tải ngay bản đầy đủ của tài liệu tại đây (762.5 KB, 16 trang )
ICI RESEARCH PERSPECTIVE
1401 H STREET, NW, SUITE 1200 | WASHINGTON, DC 20005 | 202/326-5800 | WWW.ICI.ORG MARCH 2011 | VOL. 17, NO. 2
WHAT’S INSIDE
2 Mutual Fund Fees and Expenses
Have Declined by More Than Half
Since 1990
2 How ICI Measures Average Mutual
Fund Fees and Expenses
4 Stock Funds
10 Bond Funds
10 Money Market Funds
13 Funds of Funds
16 Notes
16 References
Michael Breuer, ICI Assistant Economist, and
Sean Collins, ICI Senior Director of Industry
and Financial Analysis, prepared this report.
Suggested citation: Breuer, Michael, and
Sean Collins. 2011. “Trends in the Fees
and Expenses of Mutual Funds, 2010.”
ICI Research Perspective 17, no. 2 (March).
Trends in the Fees and Expenses of Mutual
Funds, 2010
KEY FINDINGS
»
On average, fees and expenses incurred by investors in long-term mutual funds
declined in 2010. Stock fund investors in 2010 paid an average of 95 basis points
(0.95 percent) in fees and expenses, down 3 basis points from 2009. Fees and
expenses of bond funds declined 1 basis point, to 72 basis points.
»
Expense ratios of stock funds declined in 2010, while expense ratios of bond funds
were unchanged. The average expense ratio of stock funds fell 2 basis points to
84 basis points, after having risen the previous year. Bond fund expense ratios
remained unchanged at 64 basis points.
»
The decline in fees and expenses of long-term funds was aided by a decline in load
fee payments by investors. In 2010, the maximum sales load on stock funds offered
to investors averaged 5.3 percent. But the average sales load investors actually paid
was only 1.0 percent, owing to load fee discounts on large purchases and fee waivers,
such as those on purchases through 401(k) plans.
»
The average fees and expenses of money market funds declined sharply in 2010.
The average expense ratio on money market funds fell 7 basis points, from 33 basis
points in 2009 to 26 basis points in 2010. Expense ratios on money market funds
fell sharply in 2010 because the great majority of funds waived expenses to ensure
that net returns to investors remained positive in the current low interest rate
environment.
»
Average expense ratios of funds of funds—mutual funds that invest in other mutual
funds—declined for the fifth consecutive year. In 2010, the total expense ratio of
funds of funds, which includes both the expenses that a fund pays directly out of its
assets as well as the expense ratios of the underlying funds in which it invests, fell
1 basis point to 90 basis points. Since 2005, the average expense ratio for investing
in funds of funds has fallen 11 basis points, in part reflecting a shift by investors
toward funds with lower expense ratios.
2 ICI RESEARCH PERSPECTIVE, VOL. 17, NO. 2 | MARCH 2011
Mutual Fund Fees and Expenses Have
Declined by More Than Half Since 1990
Over the past two decades, average fees and expenses
paid by mutual fund investors have fallen by more than
half (Figure 1). In 1990, investors on average paid 200 basis
points, or $2.00 for every $100 in assets, to invest in stock
funds.
1
Fees and expenses averaged 95 basis points for
stock fund investors in 2010, a decline of 53 percent from
1990. Similarly, the average fees and expenses paid by
investors in bond funds declined 61 percent, from 185 basis
points in 1990 to 72 basis points in 2010, while fees incurred
by investors in money market funds dropped 52 percent,
from 54 basis points in 1990 to 26 basis points in 2010.
How ICI Measures Average Mutual Fund Fees
and Expenses
Investors in mutual funds incur two primary kinds of fees
and expenses: sales loads and fund expenses. Sales loads
are one-time fees that investors pay either at the time of
purchase (front-end loads) or when shares are redeemed
(back-end loads). Fund expenses are paid from fund assets,
and investors thus pay these expenses indirectly. Fund
expenses cover portfolio management, fund administration
and compliance, shareholder services, recordkeeping,
distribution charges (known as 12b-1 fees), and other
operating costs. A fund’s expense ratio, which is disclosed in
the fund’s prospectus and shareholder reports, is the fund’s
total annual expenses expressed as a percentage of the
fund’s net assets.
Various factors affect a mutual fund’s fees and expenses,
including its investment objective, its level of assets, the
average account balance of its investors, the range of
services it offers, fees that investors may pay directly,
and whether the fund is a “load” or “no-load” fund.
Load funds are sold through financial intermediaries
such as brokers and registered financial advisers. These
professionals help investors define their investment goals,
select appropriate funds, and provide ongoing service.
Financial professionals are compensated for providing these
services through some combination of front- or back-end
loads and 12b-1 fees.
Investors who do not use a financial adviser (or who pay
the financial adviser directly for services) purchase no-load
funds, which have neither front- nor back-end load fees
and have low or no 12b-1 fees. Because load funds include
payments to brokers or other financial professionals, they
typically have higher fees and expenses than no-load funds.
To understand trends in the cost of owning mutual funds,
it is helpful to combine one-time sales loads and fund
expenses in a single measure. ICI does this by adding a
fund’s annual expense ratio to an estimate of the annualized
cost that investors pay for one-time sales loads.
2
ICI RESEARCH PERSPECTIVE, VOL. 17, NO. 2 | MARCH 2011 3
FIGURE 1
Mutul Fund Fees nd Expenses Hve Fllen by More Thn Hlf Since 1990
Basis points, 1990–2010
Stock funds and bond funds
0
50
100
150
200
250
201020092008200720062005200420032002200120001999199819971996199519941993199219911990
0
25
50
75
100
201020092008200720062005200420032002200120001999199819971996199519941993199219911990
Money market funds
200
185
95
72
Stock funds
Money market funds
Bond funds
54
26
Note: Fees and expenses are measured as an asset-weighted average; figures exclude mutual funds available as investment choices in variable
annuities and mutual funds that invest primarily in other mutual funds.
Sources: Investment Company Institute and Lipper
4 ICI RESEARCH PERSPECTIVE, VOL. 17, NO. 2 | MARCH 2011
ICI uses asset-weighted averages to summarize the fees
and expenses that shareholders actually pay through
mutual funds. In this context, asset-weighted averages are
preferable to simple averages, which would overstate the
fees and expenses of funds in which investors hold few
dollars. Note that in this study, fees and expenses shown
for years prior to 2010 have been revised slightly because
of a change in asset-weighting methodology. Previously,
ICI created asset-weighted fee and expense ratio measures
by averaging a fund’s assets over all months in that fund’s
fiscal year. Beginning with this study, to simplify calculations
and exposition, as well as to enhance consistency with other
ICI publications, ICI weights each fund’s expense ratio by its
end-of-year assets.
In addition, to assess the fees and expenses incurred by
individual shareholders in long-term funds, the analysis
includes both retail and institutional share classes of
long-term mutual funds. Including institutional share
classes is appropriate because the vast majority of the
assets in the institutional share classes of long-term funds
represent investments made on behalf of retail investors,
such as through defined contribution (DC) plans, individual
retirement accounts (IRAs), broker-dealers investing on
behalf of retail clients, 529 plans, and other accounts such
as “omnibus accounts.”
3
For money market funds, this study provides an overall
summary of fees and expenses, as well as a breakdown
between retail and institutional share classes of money
market funds. In contrast with long-term funds, a large
portion of the assets in money market funds is held by
corporations, municipalities, endowments, and other
institutional investors investing for their own accounts,
rather than on behalf of retail investors.
Stock Funds
The average fees and expenses paid by stock fund
investors declined 3 basis points in 2010, to 95 basis points
(Figure 2). This decline was the result of a 1 basis-point drop
in load fees paid by stock fund investors, combined with a
2 basis-point fall in the average expense ratio of stock
funds.
The drop in load fees paid by stock investors reflects an
increased volume of sales of load funds that were entitled
to a discounted load fee (see “Understanding the Decline
in Load Fee Payments” below). For example, in 2010, the
maximum sales load charged by stock funds averaged
5.3 percent (Figure 3). However, owing to sales of fund
shares with load fee discounts, the average sales load
actually paid by fund investors was just 1.0 percent.
ICI RESEARCH PERSPECTIVE, VOL. 17, NO. 2 | MARCH 2011 5
FIGURE 2
Averge Lod Fees nd Expense Rtios for Mutul Funds
Basis points, 1990–2010
Stock funds Bond funds
Money market
funds
Year
Fees and
expenses
Load fees
Annualized
Total expense
ratio
Fees and
expenses
Load fees
Annualized
Total expense
ratio
Total expense
ratio
Note: Fees and expenses, one-time load fees, and total expense ratio are measured as asset-weighted averages. Figures exclude mutual funds
available as investment choices in variable annuities and mutual funds that invest primarily in other mutual funds.
Sources: Investment Company Institute and Lipper
6 ICI RESEARCH PERSPECTIVE, VOL. 17, NO. 2 | MARCH 2011
The average expense ratio of stock funds fell by 2 basis
points in 2010, following a rise of 4 basis points in 2009.
This pattern was not unexpected, given recent stock market
developments. Expense ratios often vary inversely with
fund assets. The reason is that certain fund costs—such
as transfer agency fees, accounting and audit fees, and
directors’ fees—are more or less fixed in dollar terms. Thus,
as fund assets rise, these costs become smaller relative to
those assets. As fund assets fall, the fixed costs become
relatively greater.
FIGURE 3
Front-End Sles Lods Tht Investors Pid Were Well Below Mximum Front-End Lods
Tht Funds Chrged
Percentage of purchase amount, selected years
Maximum front-end sales load
1
Percent
Front-end sales load that investors
actually incurred
1
Percent
Stock
2
Bond Stock
2
Bond
1
The maximum front-end sales load is a simple average of the highest front-end load that funds may charge as set forth in their prospectuses.
The average actually incurred is the maximum sales load multiplied by the ratio of total front-end sales loads collected by stock funds as a
percentage of new sales of shares by such funds.
2
Stock funds include equity and hybrid funds.
Note: Figures exclude mutual funds available as investment choices in variable annuities and mutual funds that invest primarily in other
mutual funds.
Sources: Investment Company Institute, Lipper, and Strategic Insight Simfund
ICI RESEARCH PERSPECTIVE, VOL. 17, NO. 2 | MARCH 2011 7
FIGURE 4
Stock Fund Expense Rtios Are Relted to Stock Fund Assets
Expense ratio
Percentage points
0.80
0.85
0.90
0.95
1.00
1.05
1.10
20102008200620042002200019981996
6,000
5,000
4,000
3,000
2,000
1,000
0
Expense ratio
Assets
Assets*
Billions of dollars, inverted scale
* Assets are the total net assets of equity and hybrid funds. Figure excludes assets of mutual funds available as investment choices in variable
annuities and mutual funds that invest primarily in other mutual funds. Assets are plotted as a two-year moving average.
Sources: Investment Company Institute and Lipper
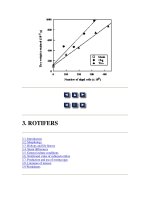
During the stock market downturn from October 2007 to
March 2009, the assets of stock funds declined markedly
(Figure 4, dashed line with an inverted scale), leading
expense ratios to rise slightly. As the stock market
recovered, stock fund assets rebounded. For example,
excluding variable annuities and funds of funds, the net
assets of stock funds rose from $4.7 trillion in December
2009 to $5.4 trillion in December 2010, a 15 percent
increase. (For exposition, Figure 4 plots fund asset levels as
a two-year moving average.) This turnaround in stock fund
assets helped to lower stock fund expense ratios in 2010.
8 ICI RESEARCH PERSPECTIVE, VOL. 17, NO. 2 | MARCH 2011
Understanding the Decline in Load Fee Payments
Over time, load fee payments have declined very substantially as a proportion of the total fees investors incur in
mutual funds. Load fees now contribute considerably less than fund expense ratios to the total fees investors pay to
invest in mutual funds. For example, load fees now contribute just 11 basis points to the annualized cost of investing
in stock funds, while fund expense ratios contribute 84 basis points. In 1990, by contrast, load fees and expense
ratios contributed equally (100 basis points each) to the costs of investing in stock funds.
This decline in load fees paid reflects several developments. First, the ways in which mutual funds are sold have
changed. In the 1980s and early 1990s, mutual funds were sold largely through stock brokers. Load fees were a
primary means of compensating brokers for service they provided to investors. Over time, however, brokers and
other financial professionals who sell mutual funds have increasingly been compensated through “asset-based”
fees (assessed as a percentage of the assets that the financial professional manages for an investor).
4
Investors
may pay these fees indirectly through a fund’s 12b-1 fee, which is included in the fund’s expense ratio. The fund’s
underwriter collects the 12b-1 fee from the fund but passes the bulk of that fee to the financial professionals serving
fund investors. Alternatively, investors may purchase no-load funds with the help of a financial professional, then
directly pay the professional a fee (typically an asset-based fee) for his or her services. Either way, the increased
use of asset-based fees to compensate financial professionals has resulted in lower front-end load fee payments.
A second factor is the increasingly significant role of mutual funds in helping investors save for retirement. Some
portion of share purchases made through 401(k) plans has gone to funds that normally charge front- or back-end
load fees. However, load funds often waive sales charges on purchases made through 401(k) plans. As a result, the
total dollar amount of load fees paid by investors has declined over time relative to the assets in load funds.
Third, even for purchases made outside of retirement plans, load funds typically offer significant load fee discounts,
called “breakpoints,” for initial purchases above a given dollar amount or cumulative purchases above pre-specified
levels. For example, in 2010, among domestic equity funds (excluding sector funds) that charged a front-end load
fee, investors most commonly incurred a front-end load of 5.75 percent of initial share purchases up to $50,000
(Figure 5). For larger initial purchases—or cumulative purchases that over time exceeded $50,000—investors paid
a lower front-end load fee, with the front-end load fee declining with total dollars invested. In 2010, for purchases
between $50,000 and $100,000, investors most commonly paid a front-end load fee of 4.5 percent of the amount
invested. In most cases, front-end load fees are waived altogether for purchases over $1 million. Fee breakpoints
thus help reduce investors’ load fee payments as a percentage of share purchases, which contributes to a reduction
in load fees paid as a percentage of assets.
ICI RESEARCH PERSPECTIVE, VOL. 17, NO. 2 | MARCH 2011 9
Fourth, fee breakpoints have interacted with inflation to reduce the real (inflation-adjusted) cost to investors of
load fees. As Figure 5 shows, the most common front-end load fees and associated fee breakpoints have remained
the same since 2000. However, over the 10-year period 2000 to 2010, the consumer price level rose almost
30 percent. Consequently, by 2010 investors could in real terms achieve a given breakpoint with a considerably
smaller investment than they could in 2000. For example, in 2000, shareholders most commonly needed a
minimum investment of $50,000 to achieve a breakpoint. By 2010, however, $50,000 was worth only $39,830
in inflation-adjusted terms. Thus, it was easier for investors to achieve a breakpoint in 2010 than in 2000, which
likely contributed to a reduction in load fees paid as a percentage of dollars invested.
FIGURE 5
Front-End Lod Fees nd Associted Fee Brekpoints
Most frequently occurring vlues
1
2010 2000 2010-adjusted for inflation
2
Cumulative dollar
purchases
Fee breakpoints
Front-end
load fee
Cumulative dollar
purchases
Fee breakpoints
Front-end
load fee
Cumulative dollar
purchases
Fee breakpoints
Front-end
load fee
to to to
to to to
to to to
to to to
to to to
ormore ormore ormore
1
“Most frequently occurring values” are modal values for load fees and breakpoints among all domestic equity (excluding sector funds)
that charged a front-end load fee.
2
Fee breakpoints are adjusted for inflation by taking the fee breakpoints available in 2010 and multiplying by the Consumer Price Index
in December 2000 and dividing by the Consumer Price Index in December 2010.
3
The front-end load fee is a percentage of purchase amount.
Sources: Investment Company Institute, U.S. Bureau of Labor Statistics, and Morningstar
10 ICI RESEARCH PERSPECTIVE, VOL. 17, NO. 2 | MARCH 2011
Bond Funds
The average fees and expenses that shareholders paid for
investing in bond funds declined by 1 basis point in 2010, to
72 basis points (Figure 2). This reflects a 1 basis-point drop
in the annualized cost of load fee payments and no change
in the average expense ratio of bond funds.
Like stock funds, bond funds experienced strong asset
growth in 2010. Bond fund assets totaled $2.6 trillion at the
end of 2010, up 18 percent from year-end 2009. As noted,
growth in fund assets often puts downward pressure on
fund expense ratios. In 2010, however, bond fund expense
ratios on average remained unchanged. At least two factors
played a role.
First, investors, seeking higher yields available in a
number of foreign markets, increased their holdings of
global/international bond funds. Such funds generally are
more costly to manage than bond funds with a domestic
orientation and thus have above-average expense ratios.
Second, certain bond funds that saw large increases in
assets have “unified fee” structures. With a unified fee
structure, investors incur an expense ratio that is fixed as
a percentage of a fund’s assets for a bundle of services.
As a result, the expense ratios of these funds do not
automatically decline as fund assets rise. Investors in these
funds in 2010 were not disadvantaged because the funds
had performance at the upper end—and expense ratios at
the lower end—of all bond funds with similar investment
objectives.
Money Market Funds
The average expense ratio of money market funds was
26 basis points in 2010, a drop of 7 basis points from
2009 (Figure 2). Because investors generally do not pay
sales loads for investing in money market funds, the fees
and expenses of money market funds are simply measured
as the expense ratios of these funds.
From 2001 to 2009, the declining average expense ratio
of money market funds largely reflected an increase in the
market share of institutional share classes of money market
funds (Figure 6). Because institutional share classes serve
fewer investors with larger average account balances, they
tend to have lower expense ratios than retail share classes
of money market funds (Figure 7). Thus, the increase in the
institutional market share helped reduce the industry-wide
average expense ratio of all money market funds.
By contrast, the market share of institutional share
classes of money market funds dropped slightly in 2010
(to 67 percent from 68 percent in 2009), indicating that
other factors pushed expenses down. Primarily, the steep
decline in the average expense ratio of money market
funds reflects developments stemming from the current
low interest rate environment.
ICI RESEARCH PERSPECTIVE, VOL. 17, NO. 2 | MARCH 2011 11
FIGURE 7
Expense Rtios of Institutionl nd Retil Money Mrket Shre Clsses
Basis points, 2001–2010
Retail share classes
0
25
50
75
100
2010200920082007200620052004200320022001
Institutional share classes
37
49
53
54
56
5858
59
6161
21
26
26
27
28
29
30
29
30
31
Note: Expense ratios are measured as an asset-weighted average; figures exclude mutual funds available as investment choices in variable
annuities and mutual funds that invest primarily in other mutual funds.
Sources: Investment Company Institute and Lipper
FIGURE 6
Mrket Shre of Institutionl Shre Clsses of Money Mrket Funds
Percentage of assets of all money market funds, 2001–2010
50
2010200920082007200620052004200320022001
53
54
55
57 57
60
64
68
67
Source: Investment Company Institute
12 ICI RESEARCH PERSPECTIVE, VOL. 17, NO. 2 | MARCH 2011
FIGURE 9
Percentge of Money Mrket Fund Shre Clsses Tht Wive Expenses Hs Incresed
Percent, January 2000–December 2010
0
10
20
30
40
50
60
70
80
90
100
20102009200820072006200520042003200220012000
Sources: Investment Company Institute and iMoneyNet
FIGURE 8
Txble Money Mrket Fund Yields
Percent, 1990–2010
Gross yield
Net yield
0
1
2
3
4
5
6
7
8
9
20102008200620042002200019981996199419921990
Sources: Investment Company Institute and iMoneyNet
In 2007 and 2008, to stimulate the economy and respond
to the financial crisis, the Federal Reserve sharply reduced
short-term interest rates. Yields on money market funds,
which closely track short-term interest rates, tumbled
(Figure 8). In 2010, the average gross yield (the yield before
deducting fund expense ratios) on taxable money market
funds hit a historic low, hovering just above zero.
In this setting, money market fund advisers increased
expense waivers to ensure that fund net yields (the yields
after deducting fund expense ratios) did not fall below
zero. Waivers raise a fund’s net yield by reducing the fund’s
expense ratio. Historically, money market funds have often
waived expenses, usually for competitive reasons. For
example, in 2006, before the onset of the financial crisis,
60 percent of money market fund share classes were
waiving expenses. By the end of 2010, over 90 percent of
money market fund share classes were waiving some or
all expenses (Figure 9).
ICI RESEARCH PERSPECTIVE, VOL. 17, NO. 2 | MARCH 2011 13
Expense waivers are paid for by money market fund
advisers, who thus forego profits and bear more, if not all,
of the costs of running their money market funds. Money
market fund advisers waived an estimated $4.5 billion in
expenses in 2010, over three times the amount waived in
2006 (Figure 10). Thus, these waivers posed a substantial
financial cost on fund advisers. In the future, if gross
yields on money market funds rise, advisers may reduce
or eliminate waivers, which could lead expense ratios on
money market funds to rise somewhat.
Funds of Funds
Funds of funds are mutual funds that invest in other
mutual funds.
5
The market for funds of funds has expanded
considerably in recent years. By the end of 2010, there were
966 funds of funds with $928 billion in assets (Figure 11).
Approximately 85 percent of the assets of funds of funds are
in hybrid funds of funds, which are funds that invest in a mix
of stock, bond, and hybrid mutual funds.
FIGURE 10
Money Mrket Funds Wived n Estimted $4.5 Billion in Expenses in 2010
Estimated expense waivers, billions of dollars, 2000–2010
20102009200820072006200520042003200220012000
4.5
3.6
1.8
1.4
1.31.31.3
1.4
1.3
1.2
1.0
Sources: Investment Company Institute and iMoneyNet
14 ICI RESEARCH PERSPECTIVE, VOL. 17, NO. 2 | MARCH 2011
FIGURE 11
Funds of Funds Hve Grown Rpidly in Recent Yers
Number of funds of funds
Year-end Total Equity Hybrid Bond
Memo
Lifestyle
1
Target date
2
Total net assets of funds of funds, billions of dollars
Year-end Total Equity Hybrid Bond
Memo
Lifestyle
1
Target date
2
1
A lifestyle mutual fund maintains a predetermined asset allocation and generally contains “conservative,” “aggressive,” or “moderate” in its name.
2
A target date mutual fund is a hybrid fund that typically rebalances to an increasingly conservative portfolio as it approaches and passes the
fund’s target date, which is usually included in the fund’s name.
Note: Components may not add to total because of rounding.
Source: Investment Company Institute
ICI RESEARCH PERSPECTIVE, VOL. 17, NO. 2 | MARCH 2011 15
Much of the growth in funds of funds stems from investor
interest in lifestyle and target date funds. Lifestyle funds,
also known as “target risk” funds, maintain pre-determined
asset allocations and usually contain “conservative,”
“moderate,” or “aggressive” in the funds’ names. Target
date funds adjust their asset allocations over time in a
pre-specified way. Typically, a target date fund provides
investors more exposure to fixed income and cash as it
approaches and passes the target date, which is usually
mentioned in the fund’s name.
These features have made lifestyle and target date funds
especially attractive for individuals saving for retirement in
401(k) plans and IRAs.
6
Lifestyle and target date funds of
funds account for 59 percent of the total number and
61 percent of the total assets of funds of funds.
From 2005 to 2010, the average expense ratio of funds
of funds fell from 101 basis points to 90 basis points
(Figure 12). The total expense ratios shown in Figure 12
account for both the expenses that a fund pays directly out
of its assets (sometimes called “direct expenses”), as well as
the expense ratios of the underlying funds in which it invests
(often called “acquired fund fees” or “indirect expenses”).
7
Of that 11 basis-point drop from 2005 to 2010, 3 basis points
are due to a fall in the expense ratios of individual funds
of funds over the period (Figure 13). The remaining 8 basis
points reflect a shift by investors toward lower-cost funds
of funds, as well as other factors.
8
FIGURE 12
Totl Expense Rtios of Funds of Funds
Basis points
Asset-weighted average Simple average Median
Sources: Investment Company Institute and Morningstar
FIGURE 13
Fctors Contributing to the Drop in the Averge Expense Rtio of Funds of Funds from
2005 to 2010
Basis point drop due to each factor
8 basis points
Increase in market share of lower-cost
funds and other factors
3 basis points
Fall in expense ratios of individual funds
Sources: Investment Company Institute and Morningstar
1401 H Street, NW
Washington, DC 20005
202/326-5800
www.ici.org
Copyright © 2011 by the Investment Company Institute
The Investment Company Institute (ICI) is the national association of U.S. investment companies. ICI seeks to encourage adherence to high ethical
standards, promote public understanding, and otherwise advance the interests of funds, their shareholders, directors, and advisers.
Notes
1
Stock funds includes both equity mutual funds and balanced/
hybrid mutual funds. Balanced and hybrid funds that are funds
of funds are analyzed separately along with all funds of funds
in the discussion at the end of this report.
2
For more details, see Rea and Reid 1998.
3
When an investor purchases shares of a mutual fund through
a brokerage firm, the broker often registers the purchase
with the mutual fund under the broker’s name in a pooled
(“omnibus”) account, which is known as registering in “street
name.” Brokers do this for operational convenience and to help
reduce costs.
4
See, for example, Damato and Pessin 2010.
5
Some funds of funds also invest in exchange-traded funds.
6
As of September 2010, 43 percent of lifestyle mutual fund
assets and 87 percent of target date mutual fund assets were
held in IRAs and DC retirement plans. See Brady et al. 2011.
7
An SEC rule addressing funds of funds, adopted in 2006,
requires a fund of funds to report a total expense ratio in its
prospectus fee table that accounts for both direct and indirect
expenses. The expense ratios in Figure 12 include both types of
expenses.
8
The contribution analysis in Figure 13 is determined by first
calculating the amount by which the asset-weighted average
expense ratio of funds of funds changed from 2005 to 2010 as
the result of changes in the expense ratios of individual funds
of funds, while holding their assets constant as of 2005. This
factor contributed 3 basis points of the 11 basis-point decline
in the average expense ratio of funds of funds over the period
(labeled in Figure 13 as “Fall in expense ratios of individual
funds”). By definition, the remaining 8 basis points must result
from an increase in the market share of lower expense ratio
funds of funds, or to a net reduction in the average expense
ratio of funds of funds because the expense ratios of newly
created funds were lower on average than the expense ratios
of funds of funds that were merged or liquidated over the
period (labeled in Figure 13 as “Increase in market share of
lower-cost funds and other factors”).
References
Brady, Peter, Erin Short, Shaun Lutz, and Sarah Holden. 2011.
The U.S. Retirement Market: Third Quarter 2010. Washington,
DC: Investment Company Institute (January). Available at
www.ici.org/pdf/ppr_11_retire_q3_10.pdf.
Damato, Karen, and Jaime Levy Pessin. 2010. “Shift from
Commissions to Fees Has Benefits for Fund Investors.”
Wall Street Journal, February 1.
Rea, John D., and Brian K. Reid. 1998. “Trends in the Ownership
Cost of Equity Mutual Funds.” Investment Company Institute
Perspective 4, no. 3 (November). Available at www.ici.org/pdf/
per04-03.pdf.