Tài liệu Characteristics of Mutual Fund Investors, 2011 ppt
Bạn đang xem bản rút gọn của tài liệu. Xem và tải ngay bản đầy đủ của tài liệu tại đây (1.29 MB, 16 trang )
ICI RESEARCH PERSPECTIVE
1401 H STREET, NW, SUITE 1200 | WASHINGTON, DC 20005 | 202/326-5800 | WWW.ICI.ORG OCTOBER 2011 | VOL. 17, NO. 6
WHAT’S INSIDE
I U.S. Household Ownership
of Mutual Funds in 2011
2 Most Mutual Fund Owners Are
Married, Educated, and in Their
Prime Earning Years
3 Most Mutual Fund Owners
Are Employed and Middle-
Income
4 Mutual Fund Owners Hold a
Range of Other Investments
5 Mutual Funds Are Important
Components in Investor
Portfolios
6 Retirement Saving Is Often the
Goal of Mutual Fund Investors
8 Employer-Sponsored Plans and
Financial Advisers Are the Main
Channels of Fund Investments
9 First Mutual Fund Purchases
Increasingly Are Made Through
Employer-Sponsored Plans
10 Most Mutual Fund–Owning
Households Bought Their First
Fund Before 2000
11 Baby Boomers Own the Largest
Share of Mutual Fund Assets
13 Notes
14 References
Michael Bogdan, Associate Economist;
Sarah Holden, Senior Director of Retirement
and Investor Research; and Daniel Schrass,
Associate Economist, prepared this report.
Suggested citation: Bogdan, Michael,
Sarah Holden, and Daniel Schrass. 2011.
“Characteristics of Mutual Fund Investors,
2011.” ICI Research Perspective 17, no. 6
(October). Available at www.ici.org/pdf/
per17-06.pdf.
Characteristics of Mutual Fund Investors, 2011
KEY FINDINGS
»
In 2011, most households that owned mutual funds were headed by individuals
in their peak earning and saving years. About two-thirds of mutual fund–owning
households were headed by individuals between the ages of 35 and 64.
»
The majority of mutual fund owners was employed and had moderate household
incomes. Seventy-one percent of individuals heading households owning mutual
funds were employed either full- or part-time. Fifty-five percent of U.S. households
owning mutual funds had incomes between $25,000 and $99,999.
»
Mutual fund–owning households often held several funds, and equity funds were
the most commonly owned type of mutual fund. Among households owning mutual
funds in 2011, 86 percent held more than one fund and 81 percent owned equity
funds.
»
Almost all mutual fund investors were focused on retirement saving. Saving for
retirement was one of the financial goals for 94 percent of mutual fund–owning
households, and almost three-quarters indicated that retirement saving was the
household’s primary financial goal.
»
Employer-sponsored retirement plans increasingly are the gateway to mutual
fund ownership. Almost three-quarters of mutual fund–owning households
that purchased their first fund in 2005 or later purchased that fund through an
employer-sponsored retirement plan, as compared with 55 percent of those that
made their first purchase before 1990. In 2011, 37 percent of mutual fund–owning
households owned funds both inside and outside employer-sponsored retirement
plans. An additional 32 percent owned mutual funds only inside employer-sponsored
retirement plans.
U.S. Household Ownership of Mutual Funds in 2011
In 2011, the annual ICI survey of mutual fund ownership found that 52.3 million, or
44.1 percent, of households in the United States owned mutual funds.
1
This report
highlights the characteristics of those households.
2 ICI RESEARCH PERSPECTIVE, VOL. 17, NO. 6 | OCTOBER 2011
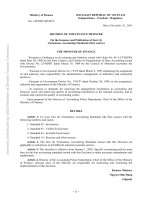
FIGURE 1
Mutul Fund Owners Represent Vriety of Demogrphic Groups
Percentage of U.S. households owning mutual funds, 2011
16%
Younger than 35
18%
65 or older
21%
35 to 44
24%
45 to 54
21%
55 to 64
24%
High school graduate
or less
24%
Some graduate school or
completed graduate school
29%
Associate’s degree
or some college
23%
Completed college
10%
Single
7%
Widowed
74%
Married or living with a partner
9%
Divorced or separated
Age of head of household
Education level of head of household
Marital status of head of household
Mean: 50 years
Median: 50 years
Note: Head of household refers to the sole or co-decisionmaker for household saving and investing.
Source: Investment Company Institute Annual Mutual Fund Shareholder Tracking Survey
Most Mutual Fund Owners Are Married,
Educated, and in Their Prime Earning Years
Mutual fund shareholders vary in their age, educational
attainment, and marital status. In 2011, the median age
of individuals heading mutual fund–owning households
was 50 (Figure 1). Most mutual fund–owning households
(66 percent) were headed by individuals between the
ages of 35 and 64, the age range in which saving and
investing traditionally is the greatest.
2
ICI RESEARCH PERSPECTIVE, VOL. 17, NO. 6 | OCTOBER 2011 3
In 2011, 16 percent of mutual fund–owning households were
headed by individuals younger than 35, and 18 percent were
headed by individuals aged 65 or older (Figure 1). Among
heads of mutual fund–owning households, 47 percent had
college degrees or postgraduate education, and another
29 percent had obtained associate’s degrees or some college
education. Seventy-four percent were married or living with
a partner.
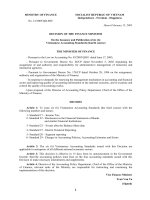
Most Mutual Fund Owners Are Employed
and Middle-Income
Individuals across all employment and income groups own
mutual funds. Among households that owned mutual funds
FIGURE 2
Mutul Fund Owners Represent Mny Different Employment nd Income Groups
Percentage of U.S. households owning mutual funds, 2011
2%
Retired and employed
full-time
8%
Not employed
61%
Employed full-time
5%
Employed part-time
21%
Retired and not employed
7%
Less than $25,000
21%
$50,000 to $74,999
7%
$25,000 to $34,999
10%
$35,000 to $49,999
Employment status of head of household
1
Total household income
2
3%
Retired and employed
part-time
17%
$75,000 to $99,999
38%
$100,000 or more
Mean: $99,900
Median: $80,000
1
Head of household refers to the sole or co-decisionmaker for household saving and investing.
2
Total reported is household income before taxes in 2010.
Source: Investment Company Institute Annual Mutual Fund Shareholder Tracking Survey
in 2011, 71 percent were headed by individuals who were
employed full- or part-time (Figure 2). Among the
29 percent who were not employed, 72 percent were
retired—that is to say, they responded affirmatively to:
“Are you retired from your lifetime occupation?” Overall,
26 percent of individuals heading households that owned
mutual funds said that they were retired.
3
The median
household income of mutual fund–owning households
was $80,000; 24 percent had household incomes of less
than $50,000; 21 percent had household incomes between
$50,000 and $74,999; and 17 percent had incomes between
$75,000 and $99,999. The remaining 38 percent had
household incomes of $100,000 or more.
4 ICI RESEARCH PERSPECTIVE, VOL. 17, NO. 6 | OCTOBER 2011
FIGURE 3
Mutul Fund–Owning Households Hold Mix of Finncil Assets
Percentage of U.S. households owning mutual funds, 2011
Closed-end funds
Exchange-traded funds
Individual bonds (excluding U.S. savings bonds)
Investment real estate
Certificates of deposit
Fixed or variable annuities
U.S. savings bonds
Individual stocks
3
6
9
29
29
33
33
44
Note: Multiple responses are included.
Source: Investment Company Institute Annual Mutual Fund Shareholder Tracking Survey
Mutual Fund Owners Hold a Range of
Other Investments
Mutual fund–owning households typically have other types
of savings and investments: 44 percent owned individual
stocks, 33 percent owned U.S. savings bonds, 33 percent
owned fixed or variable annuities, and 29 percent owned
Additional Reading
For more detailed information about mutual fund owners, see “Profile of Mutual Fund Shareholders, 2011,” ICI’s full
report of the findings of the 2011 Annual Mutual Fund Shareholder Tracking Survey. “Profile” presents a comprehensive
overview of mutual fund owners, including their demographic characteristics, the ways in which they purchase fund
shares, and the ways in which U.S. households use funds to meet their current and long-term financial needs. “Profile
of Mutual Fund Shareholders, 2011” will be published in early 2012. See also “Ownership of Mutual Funds, Shareholder
Sentiment, and Use of the Internet, 2011,” ICI Research Perspective, available at www.ici.org/pdf/per17-05.pdf.
certificates of deposit in 2011 (Figure 3). In addition,
29 percent owned investment real estate, 9 percent owned
individual bonds (excluding U.S. savings bonds), 6 percent
owned exchange-traded funds (ETFs), and 3 percent owned
closed-end funds.
ICI RESEARCH PERSPECTIVE, VOL. 17, NO. 6 | OCTOBER 2011 5
Mutual Funds Are Important Components
in Investor Portfolios
Mutual fund–owning households often hold more than one
mutual fund. In 2011, the median number of mutual funds
owned by shareholder households was four (Figure 4).
Among these households, 41 percent owned three or fewer
funds, and 59 percent owned four or more, with 17 percent
reporting they held 11 or more funds.
FIGURE 4
Most Mutul Fund–Owning Households Own Multiple Funds
Percentage of U.S. households owning mutual funds, 2011
15%
Five to six
17%
11 or more
14%
One
15%
Three
15%
Seven to 10
12%
Two
12%
Four
Mean: Seven mutual funds
Median: Four mutual funds
Number of mutual funds household owns
Source: Investment Company Institute Annual Mutual Fund Shareholder Tracking Survey
Equity funds were the most commonly owned type of
mutual fund, held by 81 percent of mutual fund–owning
households (Figure 5). In addition, 44 percent owned hybrid
funds, 52 percent owned bond funds, and 63 percent owned
money market funds. Mutual fund holdings represented a
significant portion of these households’ financial assets:
68 percent had more than half of their household financial
assets invested in mutual funds (Figure 6).
FIGURE 5
Equity Funds Are the Most Commonly Owned Type of Mutul Fund
Percentage of U.S. households owning mutual funds, 2011
Other fund type specified Money market funds Bond funds Hybrid funds Equity funds
6
63
52
44
81
Type of mutual fund owned
Note: Multiple responses are included.
Source: Investment Company Institute Annual Mutual Fund Shareholder Tracking Survey
6 ICI RESEARCH PERSPECTIVE, VOL. 17, NO. 6 | OCTOBER 2011
Retirement Saving Is Often the Goal of Mutual
Fund Investors
Mutual fund–owning households have a variety of financial
goals for their mutual fund investments. The vast majority,
94 percent, indicated they were using mutual funds to save
for retirement (Figure 7); 73 percent indicated that saving
for retirement was their household’s primary financial goal.
Retirement is not the only financial goal for households’
mutual fund investments. Forty-eight percent listed saving
for an emergency as a goal; and 24 percent reported saving
for education among their goals. Almost half of mutual
fund–owning households reported that reducing their
taxable income was one of their goals (Figure 7). While
many mutual fund–owning households (47.5 million) held
funds in tax-deferred savings accounts,
4
15.8 million U.S.
households held long-term mutual funds (stock, bond, and
balanced/hybrid funds) in taxable accounts in 2011.
FIGURE 6
Mutul Funds Are n Importnt Component of Investor Portfolios
Percentage of U.S. households owning mutual funds, 2011
15%
25% or less
21%
51% to 75%
47%
Greater than 75%
17%
26% to 50%
Mutual funds’ share of household financial assets
Note: Household financial assets include assets in employer-sponsored retirement plans but exclude the household’s primary residence.
Source: Investment Company Institute Annual Mutual Fund Shareholder Tracking Survey
ICI RESEARCH PERSPECTIVE, VOL. 17, NO. 6 | OCTOBER 2011 7
FIGURE 7
Bulk of Mutul Fund Investors Focus on Retirement
Percentage of U.S. households owning mutual funds, 2011
6%
Education
Financial goals for mutual fund investments*
Other
House or other large item
Current income
Education
Emergency
Reduce taxable income
Retirement
7
12
22
24
48
49
94
7%
Current income
6%
Emergency
3%
Reduce taxable income
2%
House or other large item
3%
Other
73%
Retirement
Primary financial goal for mutual fund investments
* Multiple responses are included.
Source: Investment Company Institute Annual Mutual Fund Shareholder Tracking Survey
8 ICI RESEARCH PERSPECTIVE, VOL. 17, NO. 6 | OCTOBER 2011
Employer-Sponsored Plans and Financial
Advisers Are the Main Channels of Fund
Investments
Among mutual fund–owning households, 32 percent
invested in mutual funds solely inside employer-sponsored
retirement plans, which include defined contribution (DC)
plans and employer-sponsored individual retirement
accounts (IRAs);
5
31 percent owned funds solely outside
these plans; and 37 percent had funds both inside and
outside employer-sponsored retirement plans (Figure 8).
Altogether, 69 percent of mutual fund–owning households
owned funds through employer-sponsored retirement plans,
and 68 percent owned funds outside of these plans.
6
Among
households owning mutual funds outside of employer-
sponsored retirement plans, 80 percent owned funds
purchased from a professional financial adviser.
7
FIGURE 8
Mutul Fund Investments Outside Retirement Plns Are Often Guided by Finncil Advisers
8%
Source unknown
35%
Professional financial advisers
2
and
fund companies, fund supermarkets,
or discount brokers
Sources of mutual fund ownership
Percentage of U.S. households owning mutual funds, 2011
Sources for households owning mutual funds outside
employer-sponsored retirement plans
Percentage of U.S. households owning mutual funds outside
employer-sponsored retirement plans,
1
2011
Outside employer-sponsored
retirement plans only
1
Inside and outside employer-
sponsored retirement plans
1
Inside employer-sponsored
retirement plans only
1
31
37
32
12%
Fund companies, fund
supermarkets, or discount
brokers
45%
Professional financial
advisers only
2
1
Employer-sponsored retirement plans include DC plans (such as 401(k), 403(b), or 457 plans) and employer-sponsored IRAs (SEP IRAs,
SAR-SEP IRAs, and SIMPLE IRAs).
2
Professional financial advisers include full-service brokers, independent financial planners, bank and savings institution representatives,
insurance agents, and accountants.
Source: Investment Company Institute Annual Mutual Fund Shareholder Tracking Survey
ICI RESEARCH PERSPECTIVE, VOL. 17, NO. 6 | OCTOBER 2011 9
FIGURE 9
Employer-Sponsored Retirement Plns Are Incresingly the Source of First Fund Purchse
Percentage of U.S. households owning mutual funds, 2011
Year of household’s first mutual fund purchase
Memo:
all mutual
fund–owning
households
Before
1990
Between
1990
and 1994
Between
1995
and 1999
Between
2000
and 2004
2005
or later
Source of first mutul fund purchse
Insideemployer-sponsoredretirementplan
Outsideemployer-sponsoredretirementplan
Note: Employer-sponsored retirement plans include DC plans (such as 401(k), 403(b), or 457 plans) and employer-sponsored IRAs (SEP IRAs,
SAR-SEP IRAs, and SIMPLE IRAs).
Source: Investment Company Institute Annual Mutual Fund Shareholder Tracking Survey
First Mutual Fund Purchases Increasingly Are
Made Through Employer-Sponsored Plans
Mutual fund–owning households often purchase their
first mutual fund through employer-sponsored retirement
plans. In 2011, across all mutual fund–owning households,
62 percent had purchased their first fund through that
channel (Figure 9). Households that made their first mutual
fund purchase more recently were more likely to have done
so through employer-sponsored retirement plans. Among
households that bought their first mutual fund in 2005
or later, 74 percent bought that first fund through such a
plan, compared with 55 percent of households that first
purchased mutual funds before 1990.
10 ICI RESEARCH PERSPECTIVE, VOL. 17, NO. 6 | OCTOBER 2011
FIGURE 10
Most Mutul Fund–Owning Households Purchsed Their First Fund More Thn Decde Ago
Percentage of U.S. households owning mutual funds, 2011
12%
2005 or later
38%
Before 1990
16%
Between 1990 and 1994
18%
Between 1995 and 1999
16%
Between 2000 and 2004
Year of household’s first mutual fund purchase
Source: Investment Company Institute Annual Mutual Fund Shareholder Tracking Survey
Most Mutual Fund–Owning Households
Bought Their First Fund Before 2000
Most mutual fund–owning households have invested in
mutual funds for many years: 38 percent bought their first
mutual fund before 1990; 16 percent purchased their first
fund between 1990 and 1994; and 18 percent bought their
first fund between 1995 and 1999 (Figure 10). Twenty-eight
percent of mutual fund–owning households purchased their
first fund in 2000 or later.
ICI RESEARCH PERSPECTIVE, VOL. 17, NO. 6 | OCTOBER 2011 11
Baby Boomers Own the Largest Share of
Mutual Fund Assets
Mutual fund–owning households are headed by members of
all generations, but members of the Baby Boom Generation
(head of household born between 1946 and 1964) were
the largest share in 2011. Forty-two percent of households
owning mutual funds were headed by members of the
Baby Boom Generation (Figure 11). In addition, 41 percent
of households owning mutual funds were headed by
members of Generation X and Generation Y (head of
household born between 1965 and 2001),
8
and 17 percent
were headed by members of the Silent and GI Generations
(head of household born between 1904 and 1945).
9
FIGURE 11
Bby Boomers Are the Lrgest Mutul Fund–Owning Genertion
Percentage of U.S. households owning mutual funds, 2011
17%
Silent and GI Generations
(head of household born between 1904 and 1945)
42%
Baby Boom Generation
(head of household born between 1946 and 1964)
41%
Generation X and Generation Y
(head of household born between 1965 and 2001)
Source: Investment Company Institute Annual Mutual Fund Shareholder Tracking Survey
12 ICI RESEARCH PERSPECTIVE, VOL. 17, NO. 6 | OCTOBER 2011
FIGURE 12
The Mjority of Mutul Fund Assets Is Held by Bby Boomers
Percentage of households’ total mutual fund assets held by generation, 2011
19%
Silent and GI Generations
(head of household born between 1904 and 1945)
55%
Baby Boom Generation
(head of household born between 1946 and 1964)
26%
Generation X and Generation Y
(head of household born between 1965 and 2001)
Source: Investment Company Institute Annual Mutual Fund Shareholder Tracking Survey
In addition to being the largest shareholder group,
households headed by members of the Baby Boom
Generation also held the largest percentage of mutual
fund assets owned by households. Fifty-five percent
of households’ total mutual fund assets were owned
by households headed by members of the Baby Boom
Generation (Figure 12). Households headed by members
of the Silent and GI Generations held another 19 percent of
households’ total mutual fund assets, and Generation
X– and Generation Y–headed households held the remaining
26 percent of households’ total mutual fund assets.
About the Survey
The Investment Company Institute conducts the Annual Mutual Fund Shareholder Tracking Survey each spring to gather
information on the demographic and financial characteristics of mutual fund–owning households in the United States.
The most recent survey was undertaken in May 2011 and was based on a sample of 4,216 U.S. households selected by
random digit dialing, of which 1,859 households, or 44.1 percent, owned mutual funds. All interviews were conducted
over the telephone with the member of the household who was the sole or co-decisionmaker most knowledgeable about
the household’s savings and investments. The standard error for the 2011 sample of households owning mutual funds
was ± 2.3 percentage points at the 95 percent confidence level.
ICI RESEARCH PERSPECTIVE, VOL. 17, NO. 6 | OCTOBER 2011 13
Notes
1
The 2011 ICI Annual Mutual Fund Shareholder Tracking
Survey included a randomly selected sample of 4,216 U.S.
households, of which 1,859 households, or 44.1 percent,
owned mutual funds. The standard error for the 2011 sample
of households owning mutual funds is ± 2.3 percentage points
at the 95 percent confidence level. Survey data have been
weighted to match census region, age distribution, household
income distribution, and educational attainment of the U.S.
population. For additional discussion of incidence of mutual
fund ownership in the United States, see Bogdan, Holden,
and Schrass 2011. For additional detail on the characteristics
of U.S. households that own mutual funds, see Bogdan and
Schrass 2012 (forthcoming). U.S. Census Bureau 2011 reported
that there were 118.7 million households in the United States
in 2011.
2
The life-cycle pattern of savings suggests that older
individuals are able to save at higher rates because they no
longer face the expenses of buying a home, putting children
through college, or paying for their own education. An
augmented version of the life-cycle theory predicts that the
optimal savings pattern increases with age. For a summary
discussion of life-cycle models, see Browning and Crossley
2001. In addition, see discussion in Brady and Bogdan 2011,
as well as Sabelhaus, Bogdan, and Schrass 2008.
3
Among households whose heads reported they were retired,
82 percent were not employed, 10 percent were employed
part-time, and 8 percent were employed full-time.
4
Tax-deferred accounts include employer-sponsored retirement
plans (including employer-sponsored IRAs), traditional IRAs,
Roth IRAs, and variable annuities. See Bogdan, Holden, and
Schrass 2011 for additional information.
5
DC plans include 401(k), 403(b), 457 plans, and other DC
plans. Employer-sponsored IRAs include SEP IRAs, SAR-SEP
IRAs, and SIMPLE IRAs. For more information on employer-
sponsored retirement plans, see Investment Company Institute
2011. For additional information on households that own IRAs,
see Holden and Schrass 2010a and 2010b.
6
Mutual funds held in traditional IRAs or Roth IRAs were
counted as funds owned outside employer-sponsored
retirement plans. Forty-eight percent of U.S. households that
owned mutual funds held funds in traditional IRAs or Roth
IRAs in 2011 (see Bogdan and Schrass 2012, forthcoming).
7
Professional financial advisers include full-service brokers,
independent financial planners, bank and savings institution
representatives, insurance agents, and accountants. For
additional information on mutual fund owners’ use of
professional financial advisers, see Bogdan and Schrass 2012
(forthcoming); Leonard-Chambers and Bogdan 2007; and
Schrass 2008.
8
Households headed by members of Generation X were
25 percent of all mutual fund–owning households; Generation
Y represented 16 percent. For additional information on mutual
fund–owning households by generation, see Bogdan and
Schrass 2012 (forthcoming).
9
Households headed by members of the Silent Generation
were 16 percent of all mutual fund–owning households;
the GI Generation represented less than 1 percent. For
additional information on mutual fund–owning households
by generation, see Bogdan and Schrass 2012 (forthcoming).
14 ICI RESEARCH PERSPECTIVE, VOL. 17, NO. 6 | OCTOBER 2011
References
Bogdan, Michael, Sarah Holden, and Daniel Schrass. 2011.
“Ownership of Mutual Funds, Shareholder Sentiment,
and Use of the Internet, 2011.” ICI Research Perspective
17, no. 5 (October). Available at www.ici.org/pdf/
per17-05.pdf.
Bogdan, Michael, and Daniel Schrass. 2012. “Profile of
Mutual Fund Shareholders, 2011.” ICI Research Report.
(forthcoming).
Brady, Peter, and Michael Bogdan. 2011. “Who Gets
Retirement Plans and Why: An Update.” ICI Research
Perspective 17, no. 3 (March). Available at www.ici.org/
pdf/per17-03.pdf.
Browning, Martin, and Thomas F. Crossley. 2001. “The
Life-Cycle Model of Consumption and Saving.” Journal
of Economic Perspectives 15, no. 3: 3–22 (summer).
Holden, Sarah, and Daniel Schrass. 2010a. “The Role of
IRAs in U.S. Households’ Saving for Retirement, 2010.”
Investment Company Institute Fundamentals 19, no. 8
(December). Available at www.ici.org/pdf/fm-v19n8.pdf.
Holden, Sarah, and Daniel Schrass. 2010b. “Appendix:
Additional Data on IRA Ownership in 2010.” Investment
Company Institute Fundamentals 19, no. 8A (December).
Available at www.ici.org/pdf/fm-v19n8_appendix.pdf.
Investment Company Institute. 2011. “The U.S. Retirement
Market, Second Quarter 2011” (September). Available at
www.ici.org/info/ret_11_q2_data.xls.
Leonard-Chambers, Victoria, and Michael Bogdan. 2007.
“Why Do Mutual Fund Investors Use Professional Financial
Advisers?” Investment Company Institute Fundamentals 16,
no. 1 (April). Available at www.ici.org/pdf/fm-v16n1.pdf.
Sabelhaus, John, Michael Bogdan, and Daniel Schrass. 2008.
Equity and Bond Ownership in America, 2008. Washington,
DC: Investment Company Institute; New York: Securities
Industry and Financial Markets Association (December).
Available at www.ici.org/pdf/rpt_08_equity_owners.pdf.
Schrass, Daniel. 2008. “Ownership of Mutual Funds Through
Professional Financial Advisers, 2007.” Investment Company
Institute Fundamentals 17, no. 4 (September). Available at
www.ici.org/pdf/fm-v17n4.pdf.
U.S. Census Bureau. 2011. “Income, Poverty, and Health
Insurance Coverage in the United States: 2010.” Current
Population Reports, P60-239 (September). Washington, DC:
U.S. Government Printing Office. Available at
www.census.gov/prod/2011pubs/p60-239.pdf.
1401 H Street, NW
Washington, DC 20005
202/326-5800
www.ici.org
Copyright © 2011 by the Investment Company Institute
The Investment Company Institute (ICI) is the national association of U.S. investment companies. ICI seeks to encourage adherence to high ethical
standards, promote public understanding, and otherwise advance the interests of funds, their shareholders, directors, and advisers.