Tài liệu Trends in the Expenses and Fees of Mutual Funds, 2011 ppt
Bạn đang xem bản rút gọn của tài liệu. Xem và tải ngay bản đầy đủ của tài liệu tại đây (551.48 KB, 20 trang )
ICI RESEARCH PERSPECTIVE
1401 H STREET, NW, SUITE 1200 | WASHINGTON, DC 20005 | 202-326-5800 | WWW.ICI.ORG APRIL 2012 | VOL. 18, NO. 2
WHAT’S INSIDE
2 Mutual Fund Expense Ratios
Continue to Decline
2 Equity Funds
4 Hybrid Funds
5 Bond Funds
6 Index Funds
9 Money Market Funds
11 Funds of Funds
13 Mutual Fund Load Fees
18 Conclusion
19 Notes
20 References
Sean Collins, ICI Senior Director of Industry
and Financial Analysis, and Emily Gallagher,
ICI Research Associate, prepared this report.
Suggested citation: Collins, Sean, and Emily
Gallagher, 2012. “Trends in the Expenses and
Fees of Mutual Funds, 2011.” ICI Research
Perspective 18, no. 2 (April).
Trends in the Expenses and Fees
of Mutual Funds, 2011
KEY FINDINGS
»
On average, expense ratios incurred by investors in long-term mutual funds
declined in 2011: equity fund investors on average paid 79 basis points
(0.79 percent) in expenses, down 4 basis points from 2010. Expenses of bond
funds declined 2 basis points, to 62 basis points.
»
Expense ratios of money market funds fell in 2011 following a sharp decline in
2010. The asset-weighted average expense ratio of money market funds was 21 basis
points in 2011, a drop of 3 basis points from 2010. Expense ratios on money market
funds have fallen sharply in the past few years as the great majority of funds waived
expenses to ensure that net returns to investors remained positive in the current low
interest rate environment.
»
In 2011, the average expense ratio paid by investors in funds of funds—mutual
funds that invest in other mutual funds—declined 4 basis points to 83 basis points.
The total expense ratio of funds of funds includes the expenses that a fund pays
directly out of its assets as well as the expense ratios of the underlying funds in
which it invests. Since 2005, the average expense ratio for investing in funds of funds
has fallen 18 basis points.
»
The average expense ratio investors paid to hold either index or actively managed
funds declined in 2011. Since 1997, the average expense ratio of actively managed
equity funds has declined 11 basis points, while that of equity index funds declined
13 basis points. Growing investor demand for index funds has contributed to the
overall decline in long-term fund expenses because index funds have lower average
expense ratios than actively managed funds.
»
Load fee payments have declined over time. In 2011, the average maximum sales
load on equity funds offered to investors was 5.4 percent. But the average sales load
investors actually paid was only 1.0 percent, owing to load fee discounts on large
purchases and fee waivers, such as those on purchases through 401(k) plans. This
represents a decline of nearly 75 percent from the average load fee investors paid
in 1990.
2 ICI RESEARCH PERSPECTIVE, VOL. 18, NO. 2 | APRIL 2012
Mutual Fund Expense Ratios Continue
to Decline
Fund expenses cover portfolio management, fund
administration and compliance, shareholder services,
recordkeeping, certain kinds of distribution charges (known
as 12b-1 fees), and other operating costs. A fund’s expense
ratio, which is disclosed in the fund’s prospectus and
shareholder reports, is the fund’s total annual expenses
expressed as a percentage of the fund’s net assets. As
opposed to sales loads, which are discussed later, fund
expenses are paid from fund assets.
Various factors affect a mutual fund’s expenses, including
its investment objective, its level of assets, the average
account balance of its investors, the range of services it
offers, fees that investors may pay directly, and whether
the fund is a “load” or “no-load” fund (see “Understanding
Mutual Fund Load Fees,” below).
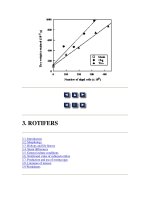
Over the past two decades, on an asset-weighted basis,
average expenses* paid by mutual fund investors have
fallen significantly (Figure 1).
1
In 1990, investors on average
paid 99 basis points, or 99 cents for every $100 in assets,
to invest in equity funds. By contrast, expenses averaged
79 basis points for equity fund investors in 2011, a decline
of over 20 percent from 1990. The decline in the average
expense ratio of hybrid funds mimicked that of equity funds
while the decline of bond funds was more marked, falling
30 percent, from 88 basis points in 1990 to 62 basis points
in 2011.
2
Expenses incurred by investors in money market
funds dropped 61 percent, from 54 basis points in 1990 to
21 basis points in 2011.
3, 4
Equity Funds
Expense ratios of equity funds declined in 2010 and 2011,
following a rise of 4 basis points in 2009. This pattern was
not unexpected, given recent stock market developments.
Expense ratios often vary inversely with fund assets. Certain
fund costs—such as transfer agency fees, accounting and
audit fees, and directors’ fees—are more or less fixed in
dollar terms regardless of fund size. When fund assets rise,
these fixed costs become smaller relative to those assets.
As fund assets fall, the fixed costs contribute relatively more
(as a percentage of assets) to a fund’s expense ratio.
During the stock market downturn from October 2007 to
March 2009, the assets of stock funds declined markedly
(Figure 3, dashed line with an inverted scale), leading
expense ratios to rise slightly. As the stock market
recovered, stock fund assets rebounded in 2010. This
coincided with a 4 basis point drop in average expenses
that year. In 2011, fund assets peaked in April. After that,
market volatility and sovereign debt crises contributed to
a retrenchment in the stock market, but the downturn was
not strong enough to knock fund assets off their upward
two-year moving average trend—contributing to the 3 basis
point decline in average fund expenses in 2011.
* In this paper, unless otherwise noted, average expenses are calculated on an asset-weighted basis. See note 1 on page 19.
ICI RESEARCH PERSPECTIVE, VOL. 18, NO. 2 | APRIL 2012 3
FIGURE 1
Mutul Fund Fees nd Expenses Hve Fllen Since 1990
Basis points, 1990–2011
Equity, hybrid, and bond funds
Money market funds
102
88
80
79
62
Money market funds
Bond funds
54
21
Hybrid funds
Equity funds
99
0
20
40
60
80
100
120
20112008200520021999199619931990
0
25
50
75
20112008200520021999199619931990
Note: Expense ratios are measured as an asset-weighted average; figure excludes mutual funds available as investment choices in variable annuities
and mutual funds that invest primarily in other mutual funds.
Sources: Investment Company Institute and Lipper
4 ICI RESEARCH PERSPECTIVE, VOL. 18, NO. 2 | APRIL 2012
Another factor in the decline in the average expenses
of long-term funds has been a shift by investors toward
no-load share classes, particularly institutional no-load
share classes, which tend to have lower-than-average
expense ratios. This is due in large part to a change in
the way investors compensate brokers and other financial
professionals (see “Understanding Mutual Fund Load
Fees” below).
Hybrid Funds
The average expense ratios of hybrid funds also continued
a pattern of decline after a sharp rise in 2009. Hybrid funds
invest in a mix of equities and bonds. Due to their bond
holdings, they are less susceptible to stock market volatility
and did not experience a year-over-year decline in assets
in 2011. The net assets of hybrid funds rose from $695 billion
in December 2009 to $839 billion in December 2011, a
21 percent increase. This was accompanied by a 2 basis point
per year decline in average expenses in 2010 and 2011.
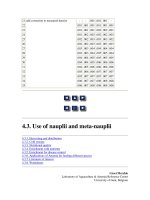
FIGURE 2
Totl Expense Rtios for Mutul Funds Hve Fllen
Basis points, 1990–2011
Year Equity funds Hybrid funds Bond funds Money market funds
Note: Total expense ratios are measured as an asset-weighted averages. Figures exclude mutual funds available as investment choices in variable
annuities and mutual funds that invest primarily in other mutual funds.
Sources: Investment Company Institute and Lipper
ICI RESEARCH PERSPECTIVE, VOL. 18, NO. 2 | APRIL 2012 5
FIGURE 3
Equity Fund Expense Rtios Are Inversely Relted to Equity Fund Assets
Expense ratio
Percentage points
6,000
5,000
4,000
3,000
2,000
1,000
0
Expense ratio
Assets
Assets*
Billions of dollars, inverted scale
0.75
0.80
0.85
0.90
0.95
1.00
1.05
201120082005200219991996
* Figure excludes assets of mutual funds available as investment choices in variable annuities and mutual funds that invest primarily in other mutual
funds. Assets are plotted as a two-year moving average.
Sources: Investment Company Institute and Lipper
Bond Funds
The average expenses that shareholders paid for investing
in bond funds declined by 2 basis points in 2011, to 62 basis
points (Figure 2). Bond funds experienced strong asset
growth in 2010, which continued in 2011. Bond fund assets
totaled $2.9 trillion at the end of 2011, up 10 percent from
year-end 2010. As with equity and hybrid funds, growth in
fund assets put downward pressure on the expense ratios
of bond funds. Two other factors also played a role.
First, in 2010, investors, seeking higher yields available in
a number of foreign markets, increased their holdings of
global/international bond funds. Such funds generally are
more costly to manage than bond funds with a domestic
orientation and thus have above-average expense ratios.
Money continued to flow into global/international bond
funds in 2011, albeit at a more tempered pace (net new
cash flow into these funds was $39 billion in 2011 versus
$53 billion in 2010). This comparatively smaller inflow was
coupled with nearly a 5 basis point decline in the average
expenses of global/international bond funds in 2011—
reducing upward pressure on the overall average expense
ratio of bond funds.
6 ICI RESEARCH PERSPECTIVE, VOL. 18, NO. 2 | APRIL 2012
Second, in 2011, on the back of Federal Reserve
announcements that short-term interest rates were likely
to remain very low through 2014, money flowed into longer-
term and mortgage-backed bond funds. Expense ratios of
these funds tend to be lower than average. For example, in
2011, the average expense ratio of long-term government
bond funds was 57 basis points, 5 basis points lower than
the average for all bond funds. This category witnessed a
17 percent increase in assets in 2011 versus only a 1 percent
increase in 2010, helping to explain why average expenses
of all bond funds declined in 2011 but held steady in 2010.
Index Funds
Another factor that has contributed to the decline of equity
and bond fund expense ratios has been growing investor
demand for index funds. Index funds generally seek to
mimic the returns on a specified index; this is often referred
to as passive management. To do this, their portfolio
managers buy and hold all, or a representative sample of,
the securities in their target indexes. Index fund assets
have grown substantially in the last 15 years, from
$170 billion in assets in 1997 to nearly $1.1 trillion in 2011
(Figure 4). Investor demand for indexed bond funds has
FIGURE 4
Totl Net Assets nd Number of Index Funds* Hve Incresed
Billions of dollars, year-end, 1997–2011
201120102009200820072006200520042003200220012000199919981997
Total net assets of bond index funds
Total net assets of equity and hybrid index funds
867
834
687
488
759
674
556
501
410
285
338
361
368
250
160
227
182
149
113
97
73
62
53
45
42
32
23
19
15
10
1,094
1,017
835
602
855
747
619
554
455
327
371
384
387
265
170
383365357359354342322328321313286271197156132
Number of index funds
* Index fund data exclude funds that invest primarily in other funds.
Note: Components may not add to the total because of rounding.
Source: Investment Company Institute
ICI RESEARCH PERSPECTIVE, VOL. 18, NO. 2 | APRIL 2012 7
grown in the past few years, but nearly 80 percent of index
fund assets are invested in equity and hybrid index funds.
5
The increased demand for index funds has contributed to
the overall decline in fund expense ratios because index
funds generally have lower expense ratios than actively
managed funds (Figure 5).
Although growing investor demand for index funds has
contributed to the overall decline in fund expense ratios,
the average expense ratios incurred by investors in both
index and actively managed funds have fallen, and by
roughly the same amount. For example, from 1997 to
2011 the average expense ratio of index equity funds has
fallen 13 basis points, compared with a decline of 11 basis
points for actively managed equity funds. Similarly, the
average expense ratios of index and actively managed bond
funds have fallen 8 and 16 basis points, respectively. This
indicates that both index and actively managed funds have
contributed to the decline in the overall average expense
ratios of mutual funds shown in Figure 1.
All else equal, the average expense ratios of index funds
tend to be lower than those of actively managed funds
because active management is a costly enterprise. Other
factors also play a role. For example, actively managed
funds more commonly bundle in the fund’s expense ratio
the cost of compensating financial professionals who may
assist fund investors, whereas index fund investors who
seek the assistance of financial professionals may pay for
that advice out-of-pocket outside the fund’s expense ratio
(see “Understanding Mutual Fund Load Fees,” below).
Also, index funds are larger on average than actively
managed funds, which through economies of scale helps
keep their expense ratios down. For example, in 2011,
the average equity index fund had assets of $1.6 billion
compared to $374 million for the actively managed equity
funds.
FIGURE 5
Expense Rtios of Actively Mnged nd Index Funds
Basis points, 1997–2011
0
10
20
30
40
50
60
70
80
90
100
110
20112009200720052003200119991997
21
27
Actively managed equity funds
Actively managed bond funds
Index equity funds
Index bond funds
82
104
13
14
66
93
Note: Expense ratios are measured as an asset-weighted average; figures exclude mutual funds available as investment choices in variable annuities
and mutual funds that invest primarily in other mutual funds.
Sources: Investment Company Institute and Lipper
8 ICI RESEARCH PERSPECTIVE, VOL. 18, NO. 2 | APRIL 2012
FIGURE 6
Percentge of Totl Net Assets Held in Funds with Expense Rtios in the Lowest Decile
1997–2011
Actively managed funds
Index funds
0
10
20
30
40
50
60
201120102009200820072006200520042003200220012000199919981997
44
55
15
37
Note: The lowest decile is based on the distribution of fund expense ratios in 2011 and is fixed across time.
Sources: Investment Company Institute and Lipper
Furthermore, investor demand for index funds is
disproportionately concentrated in the very lowest cost
funds. For example, in 2011, 55 percent of the assets of index
equity funds were held in those funds whose expense ratios
were among the lowest 10 percent of all equity index funds
(Figure 6). This phenomenon is not unique to index funds,
however. Although it has been particularly dramatic among
index fund investors, there has been a general shift by
investors toward lower cost funds.
To a certain extent, the fact that equity index assets are
concentrated in the least costly index funds reflects the
investment focus of index funds compared to that of actively
managed funds. The assets of index funds have historically
been concentrated most heavily in “large-cap blend” funds
that target large-cap stock market indexes, notably the S&P
500 index. The assets of actively managed funds, on the
other hand, have been more diffuse, spread among funds
that focus on large-cap stocks, but also among those that
focus on mid- and small-cap stocks, the international sector,
or particular sectors, such as medical, electronics, or natural
resources. All else equal, managing a portfolio of large-cap
stocks is generally acknowledged to be less costly than
managing a portfolio of mid- or small-cap, international,
or sector funds.
ICI RESEARCH PERSPECTIVE, VOL. 18, NO. 2 | APRIL 2012 9
FIGURE 7
Mrket Shre of Institutionl Shre Clsses of Money Mrket Funds
Percentage of assets of all money market funds, 2002–2011
53
54
55
57 57
60
64
68
66
65
2011201020092008200720062005200420032002
Source: Investment Company Institute
Money Market Funds
The average expense ratio of money market funds was
21 basis points in 2011, a drop of 3 basis points from 2010
(Figure 2).
6
Until 2009, the declining average expense ratio of money
market funds largely reflected an increase in the market
share of institutional share classes of money market funds
(Figure 7). Because institutional share classes serve fewer
investors with larger average account balances, they tend
to have lower expense ratios than retail share classes of
money market funds (Figure 8). Thus, the increase in the
institutional market share helped reduce the industrywide
average expense ratio of all money market funds.
FIGURE 8
Expense Rtios of Institutionl nd Retil Money Mrket Fund Shre Clsses
Basis points, 2002–2011
20112002
Retail share classes
Institutional share classes
0
25
50
75
100
18
20102009200820072006200520042003
30
61
25
32
49
53
54
56
5858
59
21
2626
27
28
29
30
29
Note: Expense ratios are measured as an asset-weighted average; figure excludes mutual funds available as investment choices in variable
annuities and mutual funds that invest primarily in other mutual funds.
Sources: Investment Company Institute and Lipper
10 ICI RESEARCH PERSPECTIVE, VOL. 18, NO. 2 | APRIL 2012
By contrast, the market share of institutional share classes
of money market funds dropped slightly in 2010 and 2011
(to 65 percent from 68 percent in 2009), indicating that
other factors pushed expenses down. Primarily, the steep
decline in the average expense ratio of money market funds
reflects developments stemming from the current low
interest rate environment.
In 2007 and 2008, to stimulate the economy and respond
to the financial crisis, the Federal Reserve sharply reduced
short-term interest rates, so that by early 2009 the federal
funds rates and U.S. Treasury bill rates hit historic lows, both
hovering just above zero. Yields on money market funds,
which closely track short-term interest rates, also tumbled
(Figure 9). In 2011, the average gross yield (the yield before
deducting fund expense ratios) on taxable money market
funds was at a record low.
In this setting, money market fund advisers increased
expense waivers to ensure that fund net yields (the yields
after deducting fund expense ratios) did not fall below zero.
Waivers raise a fund’s net yield by reducing the expense
ratio that investors incur. Historically, money market funds
have often waived expenses, usually for competitive
reasons. For example, in 2006, before the onset of the
financial crisis, 60 percent of money market fund share
classes were waiving expenses. By the end of 2011,
98 percent of money market fund share classes were
waiving at least some expenses (Figure 10).
Expense waivers are paid for by money market fund
advisers and their distributors, who forgo profits and bear
more, if not all, of the costs of running money market funds.
Money market funds waived an estimated $5.2 billion in
expenses in 2011, four times the amount waived in 2006
(Figure 11). These waivers substantially reduced revenues
of fund advisers, and if gross yields on money market
funds rise, advisers may reduce or eliminate waivers, which
could cause expense ratios on money market funds to rise
somewhat.
FIGURE 9
Txble Money Mrket Fund Yields
Percent, selected years, 1990–2011
Gross yield
Net yield
0
1
2
3
4
5
6
7
8
9
1990 1993 1996 1999 2002 2005 2008 2011
Sources: Investment Company Institute and iMoneyNet
ICI RESEARCH PERSPECTIVE, VOL. 18, NO. 2 | APRIL 2012 11
FIGURE 10
Percentge of Money Mrket Fund Shre Clsses Tht Wive Expenses Hs Risen Substntilly
Percent, January 2000–December 2011
0
20
40
60
80
100
2000 2001 2002 2003 2004 2005 2006 2007 2008 2009 2010 2011
58
98
Sources: Investment Company Institute and iMoneyNet
FIGURE 11
Money Mrket Funds Wived n Estimted $5.2 Billion in Expenses in 2011
Expense waivers, billions of dollars, 2000–2011
201120102009200820072006200520042003200220012000
5.2
4.5
3.6
1.8
1.4
1.31.31.3
1.4
1.3
1.2
1.0
Sources: Investment Company Institute and iMoneyNet
Funds of Funds
Funds of funds are mutual funds that invest in other
mutual funds.
7
The market for funds of funds has expanded
considerably in recent years. By the end of 2011, there were
1,047 funds of funds with more than $1,046 billion in assets
(Figure 12). Approximately 89 percent of the assets of funds
of funds are in hybrid funds of funds, which are funds that
invest in a mix of stock, bond, and hybrid mutual funds.
Much of the growth in funds of funds stems from investor
interest in lifestyle and target date funds. Lifestyle funds,
also known as “target risk” funds, seek to maintain
pre-determined asset allocations and usually contain
“conservative,” “moderate,” or “aggressive” in the funds’
names. Target date funds adjust their asset allocations over
time in a pre-specified way. Typically, a target date fund
provides investors more exposure to fixed income and cash
as it approaches and passes the target date, which is usually
mentioned in the fund’s name.
12 ICI RESEARCH PERSPECTIVE, VOL. 18, NO. 2 | APRIL 2012
FIGURE 12
Funds of Funds Hve Grown Rpidly in Recent Yers
Number of funds of funds, 1997–2011
Year-end Total Equity Hybrid Bond
Memo
Lifestyle
1
Target date
2
Total net assets of funds of funds, billions of dollars, 1997–2011
Year-end Total Equity Hybrid Bond
Memo
Lifestyle
1
Target date
2
1
A lifestyle mutual fund is a hybrid fund that maintains a predetermined asset allocation and generally contains “conservative,” “aggressive,”
or “moderate” in its name.
2
A target date mutual fund is a hybrid fund that typically rebalances to an increasingly conservative portfolio as it approaches and passes the
fund’s target date, which is usually included in the fund’s name.
Note: Components may not add to the total because of rounding.
Source: Investment Company Institute
ICI RESEARCH PERSPECTIVE, VOL. 18, NO. 2 | APRIL 2012 13
These features have made lifestyle and target date funds
especially attractive for individuals saving for retirement
in 401(k) plans and IRAs.
8
Lifestyle and target date funds
of funds account for 58 percent of the total number and
57 percent of the total assets of funds of funds. From 2005
to 2011, the average expense ratio of funds of funds fell
from 101 basis points to 83 basis points, a decline of nearly
18 percent (Figure 13).
9
Mutual Fund Load Fees
Many mutual fund investors pay for the services of a
professional financial adviser. Financial advisers typically
devote time and attention to prospective investors
before investors make an initial purchase of funds and
other securities. The adviser generally meets with the
investor, identifies goals, analyzes the investor’s existing
portfolio, determines an appropriate asset allocation, and
recommends funds to help achieve the investor’s goals.
Advisers also provide ongoing services, such as periodically
reviewing investors’ portfolios, adjusting asset allocations,
and responding to customer inquiries.
FIGURE 13
Totl Expense Rtios of Funds of Funds
Basis points, 2005–2011
Asset-weighted average Simple average Median
Note: Morningstar is the data source for 2005–2007 information. Investment Company Institute is the data source for 2008–2011 assets. Lipper is
the data source for 2008–2011 expense ratios.
Sources: Investment Company Institute, Lipper, and Morningstar
14 ICI RESEARCH PERSPECTIVE, VOL. 18, NO. 2 | APRIL 2012
Understanding Mutual Fund Load Fees
Investors in mutual funds incur two primary kinds of expenses and fees: fund expenses and sales loads. Whereas fund
expenses are paid indirectly from fund assets throughout the year, sales loads are one-time fees that investors pay
either at the time of purchase (front-end loads) or when shares are redeemed (back-end loads).
Funds with load fees (load funds) are sold through financial professionals such as brokers and registered investment
advisers. These professionals help investors define their investment goals, select appropriate funds, and provide ongoing
service. Financial professionals are compensated for providing these services through some combination of front- and
back-end loads, also known as contingent deferred sales loads (CDSL), and 12b-1 fees, the latter of which are included
in a fund’s expense ratio. Investors who pay their financial advisers directly for services or who do not use a financial
adviser purchase no-load funds, which have neither front- nor back-end load fees and have low or no 12b-1 fees.
Various factors affect the load fees that an investor pays. For example, many load funds offer at least three share classes
within the same fund, most commonly A, B, and C share classes. To invest in A shares, the investor typically pays a
higher front-end load but incurs a lower expense ratio because the share class either has a low or no 12b-1 fee. With a
B share, an investor pays no front-end load, but for a number of years incurs a higher expense ratio because the share
class has a higher 12b-1 fee. In addition, if the shareholder redeems his or her shares before a number of years (generally
seven to eight years), the shareholder may be required to pay a load fee (a back-end load). With C shares, an investor
typically pays neither a front-end load nor back-end load, but incurs a higher ongoing expense ratio because the share
class has a higher 12b-1 fee.
Front-end load fees are also influenced by the size of an investor’s initial purchase. For example, an investor who wishes
to purchase the front-end load share class of a fund might expect to pay a front-end load fee of 5.75 percent of the initial
purchase, if the initial purchase is less than $50,000 (Figure 14). This would commonly decline to 4.5 percent for an
initial purchase of $50,000 to $99,999, or for purchases that over time cumulate to those amounts. Typically, for initial
purchases of $1 million or more (or cumulative purchases of more than that amount), an investor would pay no front-end
load fee in an A share class. Some fund providers also offer to discount load fees when an investor has total balances
exceeding a given amount in all of that provider’s funds, even if the investor makes a small purchase, such as $5,000, in
one of the provider’s funds that the investor previously did not own.
ICI RESEARCH PERSPECTIVE, VOL. 18, NO. 2 | APRIL 2012 15
FIGURE 14
Front-End Lod Fees nd Associted Fee Brekpoints
Most frequently occurring values, 2011
Cumulative dollar purchases
Fee breakpoints Front-end load fee
2
to
to
to
to
to
ormore
1
“Most frequently occurring values” are modal values for load fees and breakpoints among all domestic equity (excluding sector funds) that
charged a front-end load fee.
2
The front-end load fee is a percentage of the purchase amount.
Sources: Investment Company Institute and Morningstar
Thirty years ago, fund shareholders usually compensated
financial advisers for their assistance through a front-end
load—a one-time, up-front payment for current and future
services. That structure has changed significantly in a
number of ways since then.
One important element has been a marked decline in load
fees paid by mutual fund investors. The maximum front-end
load fee that shareholders might pay for investing in mutual
funds has remained nearly constant since 1990 (Figure 15).
However, front-end load fees that investors actually paid
have declined from nearly 4 percent in 1990 to 1 percent in
2011. This in part reflects the increasing role of mutual funds
in helping investors save for retirement. Purchases made
through 401(k) plans have often gone to funds that normally
charge front-end load fees, but funds often waive load fees
on purchases made through 401(k) plans. Also, front-end
load funds offer volume discounts, waiving or reducing
load fees for large initial or cumulative purchases
(see "Understanding Mutual Fund Load Fees" on the
previous page).
Another important element in the changing distribution
structure of mutual funds has been a shift toward asset-
based fees. Asset-based fees are assessed as a percentage
of the assets that the financial professional manages
for an investor, rather than as a percent of the dollars
initially invested. Over time, brokers and other financial
professionals who sell mutual funds have increasingly been
compensated through asset-based fees.
10
Investors may
pay these fees indirectly through a fund’s 12b-1 fee, which is
included in the fund’s expense ratio. The fund’s underwriter
collects the 12b-1 fee, passing the bulk of it to the financial
professionals serving fund investors. Alternatively, investors
may pay the professional an asset-based fee directly. In
such cases, the professional would normally recommend the
purchase of no-load mutual funds, those that have no front-
end or back-end load, and a 12b-1 fee of 0.25 percent or less.
16 ICI RESEARCH PERSPECTIVE, VOL. 18, NO. 2 | APRIL 2012
No-load share classes have received substantial inflows
in recent years. This inflow is concentrated in institutional
no-load share classes. In 2011, for example, institutional
no-load share classes received $190 billion in net new cash
flow while front-end, back-end, and level-load share classes
saw considerable outflows (Figure 16). Over time, these
flows have led to a concentration of long-term fund assets
in no-load classes (Figure 17). Some of the shift toward
no-load funds is due to do-it-yourself investors. However,
FIGURE 15
Front-End Sles Lods Tht Investors Pid Were Well Below Mximum Front-End Lods
Tht Funds Chrged
Percentage of purchase amount, selected years
Maximum front-end
sales load*
Percent
Average front-end sales load that
investors actually incurred*
Percent
Equity Hybrid Bond Equity Hybrid Bond
*
The maximum front-end sales load is a simple average of the highest front-end load that funds may charge as set forth in their prospectus.
The average actually incurred is the maximum sales load multiplied by the ratio of total front-end sales loads collected by stock funds as
a percentage of new sales of shares by such funds.
Note: Figure excludes mutual funds available as investment choices in variable annuities and mutual funds that invest primarily in other mutual
funds.
Sources: Investment Company Institute, Lipper, and Strategic Insight Simfund
much of the shift represents the change by investors toward
compensating financial professionals directly instead
of indirectly through mutual funds. Assets and flows to
institutional no-load share classes have also been supported
by 401(k) plans and other retirement accounts, which are
often invested in institutional no-load share classes. The
shift toward no-load share classes has been an important
factor driving down the average expense ratio of mutual
funds over time.
ICI RESEARCH PERSPECTIVE, VOL. 18, NO. 2 | APRIL 2012 17
FIGURE 16
Net New Csh Flow Ws Gretest in No-Lod Institutionl Shre Clsses
Billions of dollars, 2001–2011
2001 2002 2003 2004 2005 2006 2007 2008 2009 2010 2011
All long-term funds
-
Load
- - -
Front-endload
- - -
Back-endload
- - - - - - - - - - -
Levelload
- -
Otherload
No-load
5
-
Retailorgeneralpurpose - -
Institutional
Variable annuities
- - -
1
Front-end load > 1 percent. Primarily includes A shares; includes sales where front-end loads are waived.
2
Front-end load = 0 percent and CDSL > 2 percent. Primarily includes B shares.
3
Front-end load ≤ 1 percent, CDSL ≤ 2 percent, and 12b-1 fee > 0.25 percent. Primarily includes C shares; excludes institutional share classes.
4
All other load share classes not classified as front-end load, back-end load, or level load. Primarily includes retirement share classes known as
R shares.
5
Front-end load = 0 percent, CDSL = 0 percent, and 12b-1 fee ≤ 0.25 percent.
Note: Components may not add to the totals because of rounding. Data exclude mutual funds that invest primarily in other mutual funds.
Sources: Investment Company Institute and Lipper
FIGURE 17
Totl Net Assets of Long-Term Funds Were Concentrted in No-Lod Shres
Billions of dollars, 2001–2011
2001 2002 2003 2004 2005 2006 2007 2008 2009 2010 2011
All long-term funds
Load
Front-endload
Back-endload
Levelload
Otherload
No-load
5
Retailorgeneralpurpose
Institutional
Variable annuities
1
Front-end load > 1 percent. Primarily includes A shares; includes sales where front-end loads are waived.
2
Front-end load = 0 percent and CDSL > 2 percent. Primarily includes B shares.
3
Front-end load ≤ 1 percent, CDSL ≤ 2 percent, and 12b-1 fee > 0.25 percent. Primarily includes C shares; excludes institutional share classes.
4
All other load share classes not classified as front-end load, back-end load, or level load. Primarily includes retirement share classes known as
R shares.
5
Front-end load = 0 percent, CDSL = 0 percent, and 12b-1 fee ≤ 0.25 percent.
Note: Components may not add to the totals because of rounding. Data exclude mutual funds that invest primarily in other mutual funds.
Sources: Investment Company Institute and Lipper
18 ICI RESEARCH PERSPECTIVE, VOL. 18, NO. 2 | APRIL 2012
Conclusion
This study examines recent trends in the expenses and fees
of mutual funds. Expense ratios of equity, bond, and hybrid
funds declined in 2011 owing to declines in the expense
ratios of individual funds, an increase in the demand for
index funds, and a continuing shift by investors in both
actively managed and index funds toward lower cost funds.
Expense ratios of money market funds declined sharply as
money market funds increased expense waivers in order
to help offset the effects of the current low interest rate
environment.
Additional Reading
»
“The Economics of Providing 401(k) Plans:
Services, Fees, and Expenses, 2010.”
Investment Company Institute.
www.ici.org/pdf/per17-04.pdf
»
Defined Contribution/401(k) Fee Study.
Investment Company Institute.
www.ici.org/pdf/rpt_09_dc_401k_fee_study.pdf
»
“The U.S. Retirement Market, Fourth Quarter
2011.” Investment Company Institute.
www.ici.org/research/stats/retirement/ret_11_q4
»
ICI Resources on 401(k) Plans. Investment
Company Institute.
www.ici.org/401k
»
ICI Resources on 12b-1 Fees. Investment Company
Institute.
www.ici.org/12b-1fees
ICI RESEARCH PERSPECTIVE, VOL. 18, NO. 2 | APRIL 2012 19
Notes
1
ICI uses asset-weighted averages to summarize the expenses
and fees that shareholders pay through mutual funds. In this
context, asset-weighted averages are preferable to simple
averages, which would overstate the expenses and fees of
funds in which investors hold few dollars. Note that in this
study, fees and expenses shown for years prior to 2010 have
been revised slightly because of a change in asset-weighting
methodology. Previously, ICI created asset-weighted fee and
expense ratio measures by averaging a fund’s assets over all
months in that fund’s fiscal year. Beginning in 2010, to simplify
calculations and exposition, as well as to enhance consistency
with other ICI publications, ICI began weighting each fund’s
expense ratio by its end-of-year assets.
2
Funds that invest primarily in other funds are not included in
this section but are analyzed separately.
3
To assess the expenses and fees incurred by individual
shareholders in long-term funds, the analysis throughout this
paper includes both retail and institutional share classes of
long-term mutual funds. Including institutional share classes
is appropriate because the vast majority of the assets in
the institutional share classes of long-term funds represent
investments made on behalf of retail investors, such as
through defined contribution (DC) plans, individual retirement
accounts (IRAs), broker-dealers investing on behalf of retail
clients, 529 plans, and other accounts such as “omnibus
accounts” (for a definition of omnibus accounts see next note).
4
When an investor purchases shares of a mutual fund through
a brokerage firm, the broker often registers the purchase
with the mutual fund under the brokers name in a pooled
(“omnibus”) account, which is known as registering in “street
name.” Brokers do this for operational convenience to help
reduce costs.
5
While many market indexes can be invested in through
exchange-traded funds (ETFs), these are excluded from
this analysis.
6
Investors generally do not pay sales loads for investing
in money market funds.
7
Some funds of funds also invest in ETFs.
8
As of September 2011, 43 percent of lifestyle mutual fund
assets and 91 percent of target date mutual fund assets
were held in IRAs and DC retirement plans. See Investment
Company Institute, 2012, “The U.S. Retirement Market,
Fourth Quarter 2011.”
9
An SEC rule addressing funds of funds, adopted in 2006,
requires a fund of funds to report a total expense ratio in its
prospectus fee table that accounts for both direct and indirect
expenses. The total expense ratios shown in Figure 13 account
for both the expenses that a fund pays directly out of its assets
(sometimes called direct expenses), as well as the expense
ratios of the underlying funds in which it invests (often called
acquired fund fees or indirect expenses).
10
See, for example, Damato and Pessin 2010.
1401 H Street, NW
Washington, DC 20005
202-326-5800
www.ici.org
Copyright © 2012 by the Investment Company Institute
The Investment Company Institute (ICI) is the national association of U.S. investment companies. ICI seeks to encourage adherence to high ethical
standards, promote public understanding, and otherwise advance the interests of funds, their shareholders, directors, and advisers.
References
Damato, Karen, and Jaime Levy Pessin. 2010. “Shift from
Commissions to Fees Has Benefits for Fund Investors.”
Wall Street Journal, February 1.
Investment Company Institute. 2012. “The U.S. Retirement
Market, Fourth Quarter 2011” (April). Text available
at www.ici.org/research/stats/retirement/ret_11_q4.
Data available at www.ici.org/info/ret_11_q4_data.xls.
Rea, John D., and Brian K. Reid. 1998. “Trends in the
Ownership Cost of Equity Mutual Funds.” Investment
Company Institute Perspective 4, no. 3 (November).
Available at www.ici.org/pdf/per04-03.pdf.