Tài liệu Báo cáo khoa học: Altered expression of CD1d molecules and lipid accumulation in the human hepatoma cell line HepG2 after iron loading pptx
Bạn đang xem bản rút gọn của tài liệu. Xem và tải ngay bản đầy đủ của tài liệu tại đây (689.91 KB, 14 trang )
Altered expression of CD1d molecules and lipid
accumulation in the human hepatoma cell line HepG2
after iron loading
Marisa Cabrita
1,
*, Carlos F. Pereira
1,
*, Pedro Rodrigues
1,3
, Elsa M. Cardoso
2
and
Fernando A. Arosa
1,3
1 Institute for Molecular and Cell Biology (IBMC), Porto, Portugal
2 Instituto Superior de Cie
ˆ
ncias da Sau
´
de – Norte (CESPU), Gandra, Portugal
3 Instituto de Cie
ˆ
ncias Biome
´
dicas Abel Salazar (ICBAS), Porto, Portugal
The protein mutated in hereditary hemochromatosis
(HFE) is an unconventional MHC class I molecule
involved in the regulation of intracellular iron metabo-
lism through poorly understood molecular mechanisms
[1,2]. Although HFE mutations are clearly associated
with iron overload both in humans and mice [1,3,4],
the marked clinical heterogeneity among affected
individuals with the same mutations indicates that
other molecules, environmental factors, and cells of
the immunological system probably modify disease
severity [5–11]. Recently, it has been demonstrated that
in addition to their role as peptide presenting struc-
tures, classical MHC class I molecules are involved in
the regulation of liver iron metabolism [12].
Keywords
liver, iron, CD1d, MHC, lipids
Correspondence
F. A. Arosa, Institute for Molecular and Cell
Biology, Rua do Campo Alegre, 823,
4150–180 Porto, Portugal
Fax: +351 226092404
Tel: +351 226074900
E-mail:
*These authors contributed equally to the
paper
(Received 8 July 2004, revised 13 September
2004, accepted 18 September 2004)
doi:10.1111/j.1432-1033.2004.04387.x
Iron overload in the liver may occur in clinical conditions such as hemo-
chromatosis and nonalcoholic steatohepatitis, and may lead to the deterior-
ation of the normal liver architecture by mechanisms not well understood.
Although a relationship between the expression of ICAM-1, and classical
major histocompatibility complex (MHC) class I molecules, and iron over-
load has been reported, no relationship has been identified between iron
overload and the expression of unconventional MHC class I molecules.
Herein, we report that parameters of iron metabolism were regulated in a
coordinated-fashion in a human hepatoma cell line (HepG2 cells) after iron
loading, leading to increased cellular oxidative stress and growth retarda-
tion. Iron loading of HepG2 cells resulted in increased expression of
Nor3.2-reactive CD1d molecules at the plasma membrane. Expression of
classical MHC class I and II molecules, ICAM-1 and the epithelial CD8
ligand, gp180 was not significantly affected by iron. Considering that intra-
cellular lipids regulate expression of CD1d at the cell surface, we examined
parameters of lipid metabolism in iron-loaded HepG2 cells. Interestingly,
increased expression of CD1d molecules by iron-loaded HepG2 cells was
associated with increased phosphatidylserine expression in the outer leaflet
of the plasma membrane and the presence of many intracellular lipid drop-
lets. These data describe a new relationship between iron loading, lipid
accumulation and altered expression of CD1d, an unconventional MHC
class I molecule reported to monitor intracellular and plasma membrane
lipid metabolism, in the human hepatoma cell line HepG2.
Abbreviations
DCFH-DA, 2¢,7¢-dichlorodihydrofluorescein-diacetate; APAAP, alkaline phosphatase-antialkaline phosphatase; MHC, major histocompatibility
complex; MFI, mean fluorescence intensity; ROS, reactive oxygen species.
152 FEBS Journal 272 (2005) 152–165 ª 2004 FEBS
The study of the influence that environmental and
genetic factors have on liver iron metabolism, has
received great attention over the past years using
knockout and transfection technologies. In marked
contrast, studies addressing the effect that iron loading
of hepatic cells has on the expression of immune recog-
nition molecules have been scarce. In vivo studies by
Hultcrantz and collaborators showed that iron accu-
mulation in the liver of hemochromatosis patients is
associated with oxidative stress and increased expres-
sion of ICAM-1 [13]. On the other hand, a recent
in vitro study examining the effect of iron loading on
gene expression in HepG2 cells by differential display
revealed that iron can affect mRNA levels of proteins
unrelated with iron metabolism, but none was associ-
ated with immune recognition molecules [14]. Interest-
ingly, in this study, iron-treated cells showed a marked
decrease in Apo B100; a protein essential for maintain-
ing normal lipid metabolism. Hepatic iron overload
has been reported in nonalcoholic steatohepatitis
[15,16], and an association of hepatic iron stores with
steatosis was reported in patients with insulin-resist-
ance syndrome [17]. However, the nature of the rela-
tionship between hepatic steatosis and iron overload
remains obscure.
CD1d is an unconventional MHC class I molecule
specialized in binding and presenting lipids to selected
subsets of T cells [2,18,19]. Earlier studies on human
CD1d expression showed that this unconventional
MHC class I molecule localizes in the cytoplasm of
human epithelial cells of the gastrointestinal tract and
liver, two central organs in the regulation of iron
metabolism [20,21]. After their synthesis in the endo-
plasmic reticulum, CD1d molecules are continuously
recycled between the surface and endolysosomal com-
partments [22]. Cell surface expression seems to be dic-
tated by the presence of a tyrosine motif in the
cytoplasmic tail of CD1d that allows association with
several chaperones and adaptors that direct the mole-
cule to endolysosomes, and by its capacity to bind
lipid compounds within the different endolysosomal
compartments [23].
In this study, we examined whether iron loading of
the liver epithelial cell line HepG2 influenced the
expression of immune regulatory molecules known to
function as ligands of selected subsets of T cells, such
as MHC class I and II, CD1d, ICAM-1 and the novel
CD8 ligand gp180. We also characterized parameters
of oxidative stress, cell growth and lipid metabolism in
the iron loaded HepG2. The results of the study
revealed a new link between iron loading and lipid
accumulation, leading to upregulation of CD1d mole-
cules at the cell surface in HepG2 cells.
Results
Development of iron accumulation in HepG2 cells
cultured in iron-rich media
To examine changes in iron metabolism parameters we
examined expression of the transferrin receptor, ferritin
and storage iron in HepG2 cells grown in media sup-
plemented with 100 lm of ferric citrate (iron-rich
media), the most common form of nontransferrin
bound iron found in iron overload conditions such as
hemochromatosis [
1
24]. The transferrin receptor, CD71,
was expressed at moderate levels by HepG2 cells, and
culture in iron-rich media decreased its expression
(Fig. 1A). Permeabilization with saponin allowed us to
determine that HepG2 cells contained high levels of
intracellular ferritin, with some ferritin being expressed
at the cell surface and culture in iron-rich media
increased by two- to threefold the ferritin content as
determined by the increase in mean fluorescence inten-
sity (MFI) (Fig. 1C). As shown in Fig. 1B, permeabili-
zation with saponin did not increase background
staining when rabbit immunoglobulins were used as
first step antibody. The opposite changes in CD71 and
intracellular ferritin in HepG2 cells grown in iron-rich
media were observed regardless of the time in culture.
Under these conditions HepG2 cells showed intracellu-
lar iron accumulation as determined by Perls’ staining
(Fig. 1D). Kinetic experiments showed that iron depos-
ition was detectable after 1 week of culture ( 20% of
cells positive for iron) and reached a plateau after
8 weeks of culture ( 60% of cells positive, Fig. 2A).
In all subsequent experiments, HepG2 cells were cul-
tured in iron-rich media for at least 3–4 weeks before
any determination unless indicated.
Growth in iron-rich media induces oxidative
stress in HepG2 cells
Given that HepG2 cells grown in iron-rich media
developed iron overload (Figs 1D and 2A) and excess
iron is known to catalyze oxidative reactions harmful
to the cell, we examined parameters of oxidative stress,
namely the intracellular production of reactive oxygen
species (ROS) by using the probe 2¢,7¢-dichlorodi-
hydrofluorescein (DCFH)
2
. In preliminary experiments,
it was observed that the basal levels of fluorescence in
HepG2 cells labeled with DCFH-diacetate (DA)
3
and
cultured for 1–24 h were very high when compared to
other cell types such as resting T cells (data not
shown). In subsequent experiments, ROS production
was determined after the short incubation period with
DCFH-DA. As shown in Fig. 2B (thin line), HepG2
M. Cabrita et al. CD1d upregulation in iron-loaded HepG2 cells
FEBS Journal 272 (2005) 152–165 ª 2004 FEBS 153
HepG2 HepG2+Iron
TfR
Negative
Ferritin
1500
Counts
1500
0 20 40 60 80 100
Counts
Counts
0 20 40 60 80 100
Counts
020406080100
Counts
020406080100
Counts
10
0
10
1
10
2
10
3
10
4
10
0
10
1
10
2
10
3
10
4
10
0
10
1
10
2
10
3
10
4
10
0
10
1
10
2
10
3
10
4
10
0
10
1
10
2
10
3
10
4
10
0
10
1
10
2
10
3
10
4
None
+saponin
+saponin
– saponin
+saponin
– saponin
Rabbit Igs
None
+saponin
Rabbit Igs
A
B
C
D
CD1d upregulation in iron-loaded HepG2 cells M. Cabrita et al.
154 FEBS Journal 272 (2005) 152–165 ª 2004 FEBS
cells cultured in normal media naturally produced
ROS at high levels as indicated by the high mean
fluorescence intensity when compared to background
staining in unlabeled cells or resting T cells (data not
shown). Yet, HepG2 cells grown in iron-rich media
showed a further increase in ROS production as deter-
mined by an increase in DCFH mean fluorescence
intensity (Fig. 2B, thick line). In addition, determin-
ation of acrolein adducts, a marker of oxidative stress
in biological systems [25], on the cell surface of HepG2
cells by flow cytometry revealed that HepG2 cells have
low but detectable levels of acrolein adducts and that
culture in iron-rich media induces a marked increase
(Fig. 2C).
HepG2 cells grown in iron-rich media show
growth retardation but not increased cell death
To ascertain whether the increase in oxidative stress
parameters observed in HepG2 cells cultured in iron-
rich media had any impact on viability and ⁄ or cell
growth, cell recovery at the end of the weekly culture
periods was determined. Recovery of viable HepG2
cells cultured with iron-rich media was significantly
reduced when compared with cells cultured in normal
media (Fig. 3A). However, quantification of nonviable
cells (trypan blue positive) demonstrated that the
decrease in cell recovery was not due to an increase in
cell death (Fig. 3A). Quantification of DNA content
by flow cytometry revealed that the inhibition of cell
growth was due to a decrease in the percentage of cells
in the S and G2 ⁄ M phases of the cell cycle (Fig. 3B).
In a total of seven separate determinations, a statisti-
cally significant decrease in the percentage of dividing
HepG2 cells (S + G2 ⁄ M) was observed in the iron-
rich cultures (P ¼ 0.017, Fig. 3B). In accordance with
the cell viability studies, growth retardation in HepG2
cells cultured in iron-rich media was not associated
with an increase in the percentage of apoptotic cells
100
A
80
60
40
20
0
123456
Time (weeks)
% Perls’ positive cells
78910
DCFH
Neg
–Fe
+Fe
B
C
10080
60
40
Counts
20
0
10080
60
40
Counts
20
0
10
0
Acrolein FITC
Neg
–Fe
+Fe
10
1
10
2
10
3
10
4
10
0
10
1
10
2
10
3
10
4
Fig. 2. Kinetics of iron-loading and oxidative stress parameters in iron-loaded HepG2 cells. HepG2 cells were cultured for 1–10 weeks in the
absence or presence of 100 l
M of ferric citrate. (A) Kinetic study showing the percentage of Perls’ positive HepG2 cells with time of culture
in iron-rich media. A total of 200 cells were counted in each time point. (B) For ROS determination growing cells were first incubated with
10 l
M of DCFH-DA, harvested and acquired immediately in a FACSCalibur and analyzed using the CELLQUEST software. Histogram shows
DCFH fluorescence in HepG2 cells grown without (thin line, – Fe) or with (thick line, + Fe) iron in one representative of five separate experi-
ments. Dotted line represents background staining in HepG2 cells not loaded with DCFH-DA. (C) For determination of oxidatively modified
proteins, cells were harvested and stained with 5F6 (anti-acrolein) followed by FITC-conjugated rabbit anti-(mouse Igs). Cells were acquired
immediately in a FACSCalibur and analyzed using
CELLQUEST. Histogram shows cell surface expression of acrolein adducts in HepG2 cells cul-
tured without (thin line, – Fe) or with (thick line, + Fe) iron. Dotted line represents background staining with mouse Igs as the first-step anti-
body. One representative of seven separate experiments is shown.
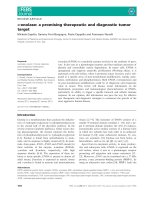
Fig. 1. Regulation of iron related parameters by iron loading in
HepG2 cells. HepG2 cells were cultured in normal media or media
supplemented with 100 l
M of ferric citrate for 4–8 weeks. Cells
were stained with Ber-T9 monoclonal antibodies (anti-CD71) and
rabbit anti-ferritin Igs, followed by FITC-conjugated rabbit anti-
mouse and FITC-conjugated swine anti-rabbit Igs, respectively.
Mouse and rabbit Igs were used as control to define background
staining. For intracellular staining, cells were first permeabilized
with 0.2% saponin. Labeled cells were acquired in a FACSCalibur
and analyzed using the
CELLQUEST software. (A) Histograms show
cell surface expression of the transferrin receptor (thick lines) in
nonpermeabilized cells cultured without and with iron. Thin lines
represent background staining with mouse Igs. (B) Histograms
show background staining with no antibody (thin lines) or with rab-
bit Igs (thick lines) as first step in permeabilized cells. (C) Histo-
grams show ferritin expression in nonpermeabilized (thin lines,
– saponin) and permeabilized cells (thick lines, + saponin) cells cul-
tured without and with iron as indicated. (D) Perls’ staining of cyto-
spins of HepG2 cells grown in media supplemented with 100 l
M of
ferric citrate for 8 weeks showing iron accumulation (blue) in
HepG2 cells at ·100 original magnification. Inset shows a ·400 ori-
ginal magnification. One representative of at least three separate
experiments is shown
22
.
M. Cabrita et al. CD1d upregulation in iron-loaded HepG2 cells
FEBS Journal 272 (2005) 152–165 ª 2004 FEBS 155
(subG0 ⁄ G1), but with an increase of cells in G1 phase,
i.e. an increase in cell arrest (Fig. 3B).
Expression of immunoregulatory molecules
by HepG2 cells
Next, we examined the expression of cell surface mole-
cules involved in immune activation and recognition.
HepG2 cells grown in normal media displayed moder-
ate to high levels of ICAM-1, gp180 and MHC class I
molecules on the cell surface. CD1d, as recognized by
Nor3.2 antibodies, was expressed at very low levels
and MHC class II molecules barely detectable
(Fig. 4A). Culture of HepG2 cells in iron-rich media
induced a significant increase in the percentage of
HepG2 cells expressing Nor-3.2-reactive CD1d, while
the expression of ICAM-1, gp180 and MHC molecules
was not affected significantly (Fig. 4A). On average, a
twofold increase in the percentage of CD1d+ cells was
observed in HepG2 cells grown in iron-rich media
(P<0.001, n ¼ 9). As Nor3.2 was generated by
immunizing mice against a recombinant denatured
CD1d protein the capacity of this antibody to recog-
nize native CD1d molecules is limited [26]. Accord-
ingly, further studies were performed using CD1d42
antibodies, which recognize native CD1d. In contrast
to Nor3.2-reactive molecules, CD1d42-reactive mole-
cules were absent from the cell surface of HepG2 cells
and culture in iron-rich media did not influence their
expression (Fig. 4B).
CD1d protein and mRNA are upregulated
in iron-loaded HepG2 cells
Immunocytochemistry and immunofluorescence stud-
ies confirmed that Nor3.2-reactive CD1d is expressed
by a low percentage of HepG2 cells, mainly in the
cytoplasm, while CD1d expression by HepG2 cells
grown in iron-rich media showed a preferential local-
ization into proximal regions of the plasma mem-
brane (Fig. 5A). The increase in CD1d expression at
the cell surface was confirmed by immunoprecipita-
tion studies. Nor3.2 immunoprecipitates from lysates
of cell surface biotinylated HepG2 cells, grown in
iron-rich media, showed a major band of 90–95 kDa
that corresponded to the expected molecular mass of
dimers of mature glycosylated CD1d molecules; this
was about threefold higher than the band immuno-
precipitated from lysates of HepG2 cells cultured in
normal media (Fig. 5B). Western blotting analysis of
immunoprecipitates from nonbiotinylated lysates and
mRNA measurements by RT-PCR revealed that the
Viable
15
A
B
10
5
Number of cells (×10
6
)
Counts
600480360
240
120
0
0 200 400
S+G2 /M (63%)
Apoptotic
Apoptotic
Gl (35%)
2%
S+G2 /M (35%)
Gl (60%)
5%
600 800 1000
DNA content DNA content
0
–Fe
–Fe
Counts
600480
360
240
120
0
0 200 400 600 800 1000
+Fe
+Fe
–Fe
+Fe
Non-Viable
P<0.02
Fig. 3. Iron-rich media inhibits growth of
HepG2 cells. HepG2 cells were cultured in
normal media or media supplemented with
100 l
M of ferric citrate for 4–8 weeks. After
harvesting, total viable and nonviable cells,
as determined by trypan blue exclusion and
inclusion, respectively, were counted using
a hematocytometer. After extensive wash-
ing, cells were evaluated for DNA content in
a FACSCalibur as indicated in the Methods.
(A) Bars show the number of viable and
nonviable HepG2 cells (mean ± SD, n ¼ 8)
after culture in media without (– Fe) and
with (+ Fe) iron. Statistically significant
differences (Student¢s t-test) are indicated.
(B). Histograms show the percentage of
apoptotic cells (subG0 ⁄ G1), and cells into
the G1 and S + G2 ⁄ M phases in the two
culture conditions. One representative of at
least five separate experiments is shown.
CD1d upregulation in iron-loaded HepG2 cells M. Cabrita et al.
156 FEBS Journal 272 (2005) 152–165 ª 2004 FEBS
marked increase in CD1d at the cell surface of iron-
loaded HepG2 cells was paralleled by an increase on
the total CD1d protein and mRNA, although not of
the same magnitude (Fig. 5B,C). Although HepG2
cells cultured in the presence of ferric citrate showed
features of iron accumulation (Fig. 1) and oxidative
stress (Fig. 2) concomitant with an increase in the
percentage of CD1d+ positive cells [Fig. 4], the lat-
ter effect could not be attributed to oxidative stress
per se. Indeed, oxidants such as H
2
O
2
and diamide
applied exogenously were incapable of reproducing
the results obtained with ferric citrate. Rather, these
oxidants induced cell death of HepG2 cells (data not
shown).
Upregulated CD1d expression and alterations
in lipid parameters
Considering that CD1d is an unconventional MHC
class I molecule specialized in binding lipids and is
proposed to monitor lipid membrane integrity [27], we
studied changes in membrane lipid composition and
intracellular lipid content in HepG2 cells by exam-
ining phosphatidylserine expression and lipid droplet
accumulation, respectively. Phosphatidylserine is a
lipid that is enriched in the inner face of the plasma
membrane and that is translocated into the outer face
under certain cellular states. Double-labeling with
Annexin V and CD1d revealed that a large number of
HepG2 cells growing in normal media already
expressed phosphatidylserine in the plasma membrane
with a third of these cells also expressing CD1d
(Fig. 6A, left dot-plot). Interestingly, the increase in
phosphatidylserine expression by HepG2 cells grown
in iron-rich media was of the same order of magnitude
as the upregulation of CD1d expression (Fig. 6A, right
dot-plot). Immunofluorescence experiments indicated
that phosphatidylserine and Nor3.2-reactive CD1d
molecules colocalize in the plasma membrane of
HepG2 cells (data not shown). To ascertain whether
phosphatidylserine translocation was associated with
changes in intracellular lipid metabolism, we examined
lipid content in iron-loaded HepG2 cells by Oil Red
staining. Faint lipid accumulation was observed in
HepG2 cells grown in normal media (Fig. 6B). In
marked contrast, culture in iron rich-media induced a
manifest increase in lipid accumulation in HepG2 cells
(Fig. 6B). Electron microscopy studies confirmed that
iron-loaded HepG2 cells showed many lipid droplets
(Fig. 6C).
020
Counts
40 60 80 100
020
Counts
40 60 80 100
020
Counts
40 60 80 100
020
Counts
40 60 80 100
020
Counts
40 60 80 100020
Counts
40 60 80 100
020
Counts
40 60 80 100
020
Counts
40 60 80100
020
Counts
40 60 80100
020
Counts
40 60 80100
020
Counts
40 60 80 100
020
Counts
40 60 80 100
020
Counts
40 60 80 100
020
Counts
40 60 80 100
10
0
10
1
10
2
10
3
10
4
10
0
10
1
10
2
10
3
10
4
10
0
10
1
10
2
10
3
10
4
10
0
10
1
10
2
10
3
10
4
10
0
10
1
10
2
10
3
10
4
10
0
10
1
10
2
10
3
10
4
10
0
10
1
10
2
10
3
10
4
10
0
10
1
10
2
10
3
10
4
10
0
10
1
10
2
10
3
10
4
10
0
10
1
10
2
10
3
10
4
10
0
10
1
10
2
10
3
10
4
10
0
10
1
10
2
10
3
10
4
10
0
10
1
10
2
10
3
10
4
10
0
10
1
10
2
10
3
10
4
9%
CD1d
–Fe
+Fe
MHC-I
gp180
ICAM-1
MHC-II
24%
+Fe
–Fe
+Fe
–Fe
2.3%
3.2%
12.2%
25.3%
A
B
CD1d42 Nor3.2
Fig. 4. Upregulation of CD1d molecules at the cell surface of iron-loaded HepG2 cells. HepG2 cells were cultured in normal media or media
supplemented with 100 l
M of ferric citrate for 4–8 weeks. After harvesting, cells were stained with mouse monoclonal antibodies against
CD1d (Nor3.2 and CD1d42), MHC class I (W6 ⁄ 32), gp180 (B9), ICAM-1 (MCA534), and MHC class II (CR3 ⁄ 43), followed by FITC-conjugated
rabbit anti-(mouse Igs) (thick lines). Mouse Igs were used to define background staining (thin lines). Cells were then acquired in a FACScali-
bur and analyzed using
CELLQUEST. (A) Histograms show the expression of the molecules studied in HepG2 cells cultured in the absence
(– Fe) or presence (+ Fe) of iron in a representative experiment of at least nine different determinations, with the exception of CR3 ⁄ 43 (n ¼
3). (B) Histograms compare the levels of expression of Nor3.2-reactive and CDd142-reactive CD1d molecules in HepG2 cells cultured in the
absence (– Fe) or presence (+ Fe) of iron in a representative experiment out of three different determinations.
M. Cabrita et al. CD1d upregulation in iron-loaded HepG2 cells
FEBS Journal 272 (2005) 152–165 ª 2004 FEBS 157
AC
Densitometry
Densitometry
Cell Surface
Biotinylation
Cell Lysate
Ip: Nor3.2
90-95 kDa
20000
15000
10000
Band Intensity (a.u.)
5000
0
45-50 kDa
CD1d
Blotting: Nor3.2
Fe:
97
66
46
46
–Fe
+Fe
CD1d
GAPDH
–+
–+
–
+
Ip: Nor3.2
Fe:
–
+
10000
7500
5000
Band Intensity (a.u.)
2500
0
B
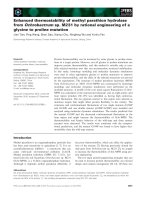
Fig. 5. Iron-induced upregulation of cell surface CD1d is accompanied by an increase in total protein and mRNA transcripts. HepG2
cells were cultured as indicated in legend of Fig. 1 and cells processed for immunocytochemistry, immunoprecipitation and mRNA studies.
(A) Cytospins of HepG2 cells were incubated with Nor3.2 followed by rabbit anti-(mouse Igs) and the alkaline phosphatase-antialkaline phos-
phatase (APAAP) conjugate, as described in Methods. Color was developed with Fast-Red substrate. Images showing CD1d expression in
HepG2 cells grown in media without (– Fe) and with (+ Fe) iron were taken in an Axioskop microscope equipped with a SPOT II camera.
(B) Lysates corresponding to 5 · 10
6
biotinylated (upper panel) and nonbiotinylated (lower panel) HepG2 cells grown in media without (–)
and with (+) iron were immunoprecipitated with Nor3.2 antibodies. Biotinylated and nonbiotinylated samples were boiled in 1% SDS and
separated on a 10% SDS ⁄ PAGE under nonreducing and reducing conditions, respectively, and proteins transferred to nitrocellulose filters.
Cell surface biotinylated CD1d molecules were visualized by using Super-Signal West Femto (Perbio). CD1d dimers (90–95 kDa) and mono-
mers (45–50 kDa) are indicated. Non-biotinylated total CD1d molecules were visualized after immunodetection with Nor3.2 followed by HRP-
conjugated rabbit anti-(mouse Igs) and Super-Signal West Femto (Perbio). Densitometry quantification of the CD1d protein bands indicated
was performed using a Kodak Digital Science DC40 camera and its associated software. Band intensities are shown on the right and are
expressed as the sum of all pixel intensity values in the band rectangle. (C) RT-PCR of total RNA isolated from HepG2 cells grown in normal
media (–) or media supplemented with 100 l
M of ferric citrate (+). Primers specific for CD1d and GAPDH were used as described.
CD1d upregulation in iron-loaded HepG2 cells M. Cabrita et al.
158 FEBS Journal 272 (2005) 152–165 ª 2004 FEBS
Discussion
In the human liver CD1d molecules are expressed
mainly in the cytoplasm [21]. Herein we have shown that
iron loading of HepG2 cells, a hepatocytic cell line,
resulted in increased cell surface expression of CD1d
molecules recognized by Nor3.2 but not by CD1d42
antibodies. Interestingly, CD1d42 antibodies recognize
the native ‘folded’ CD1d molecule, while Nor3.2 anti-
bodies recognize non-native CD1d molecules [26]. How-
ever, CD1d upregulation was not paralleled by a
significant increase in gp180, a heavy glycosylated pro-
tein that associates with CD1d in epithelial cells [28], or
in other immune recognition ligands such as classical
MHC class I and II molecules and ICAM-1. Studies by
Hultcrantz and colleagues reported that upregulation of
ICAM-1 expression by hepatocytes in hereditary hemo-
chromatosis only takes place in patients with Kupffer
cell iron overload [13]. Thus, it is probable that hepatic
iron loading, as the reported in this study using HepG2
cells, is unable per se of regulating the expression of
ICAM-1, and other immune recognition molecules
other than Nor3.2-reactive CD1d.
To our knowledge, iron loading does not regulate
members of the MHC class I family. For instance,
conflicting results have been reported regarding the
expression of HFE by human intestinal cells. While
Han et al. reported that expression of HFE was regu-
lated by iron load, in another study, Tallkvist et al.
found that iron overload had no effect on HFE
[29,30]. Probably, changes in the expression of HFE
protein under iron overload conditions are secondary
to changes in proteins known to interact with mole-
cules of the MHC family. In this context, it is import-
ant to draw attention to the fact that HepG2 cells
grown in iron rich media: (a) induced coordinated
changes in the expression of the transferrin receptor
and ferritin; (b) developed iron accumulation and
(c) increased the prooxidant state and the level of
oxidatively modified proteins. These results are in
accordance with previous in vitro and in vivo studies of
hepatic iron loading [31–35]. Evidence for toxicity
–Fe
–Fe
+Fe
+Fe
–Fe
+Fe
10.0
19.7
22.7
19.8
Nor3.2
Annexin-V
A
B
C
Fig. 6. Alterations in lipid metabolism para-
meters in iron-loaded HepG2 cells. HepG2
cells were cultured for 4 weeks as indicated
in legend of Fig. 1 and processed for flow
cytometry, immunocytochemistry and trans-
mission electron microscopy as indicated in
the Methods. (A) Four-log dot-plots show
double-labeling of CD1d (FL-2) and phos-
phatidylserine (FL-1) in HepG2 cells cultured
without (– Fe) or with (+ Fe) iron. The per-
centage of HepG2 cells positive for phos-
phatidylserine (lower right quadrant) and
phosphatidylserine plus CD1d (upper right
quadrant) in each culture condition is indica-
ted. (B) Pictures show Oil Red O staining of
cryostat sections of HepG2 cells cultured
without (– Fe) or with (+ Fe) iron and count-
erstained with hematoxylin at ·200 original
magnification. (C) Pictures show TEM ima-
ges of sections of HepG2 cells cultured
without (– Fe) or with (+ Fe) iron at ·16 000
original magnification.
M. Cabrita et al. CD1d upregulation in iron-loaded HepG2 cells
FEBS Journal 272 (2005) 152–165 ª 2004 FEBS 159
caused by excess of iron in the liver is now well estab-
lished and there is evidence that the harmful effect of
iron accumulation is due to the prooxidant state cre-
ated that is preceded by an increase in the labile iron
pool [34–37]. By using the ROS detector probe DCFH
we have shown that basal level of oxidative stress in
HepG2 cells is already high and that is exacerbated by
growth in iron-rich media. We have also shown that
the increase in the prooxidant state caused by iron
loading has an impact in protein integrity, as indicated
by an increase in protein-bound acrolein adducts at
the cell surface, which point to acrolein-adducts as a
reliable marker of lipid peroxidation also in iron over-
load disorders [25]. Most importantly, the changes in
parameters of oxidative stress caused by iron in
HepG2 cells were associated with growth retardation
due to a decrease in the percentage of cells in the cycle
4
with concomitant cell arrest in the G1 phase. Overall,
and considering that in clinical situations of iron over-
load fibrosis is associated with proliferation of stelleate
cells and synthesis of collagen [36,37], the in vitro data
presented here may be relevant for understand some of
the complex mechanisms responsible for the develop-
ment of fibrosis and cirrhosis in vivo.
A number of intracellular pathways activated in
iron-loaded HepG2 cells as a result of the undergoing
metabolic changes observed might have resulted in the
activation of CD1d gene expression and a subsequent
increased expression. Indeed, RT-PCR experiments
showed an increase in CD1d mRNA levels in iron-
loaded HepG2 cells. Yet, the combination of the flow
cytometry and immunoprecipitation data suggests that
the increase in CD1d molecules at the cell surface
could not be solely the result of increased transcription
but also from intracellular redistribution. In this scen-
ario, it is tempting to speculate that the appearance of
Nor3.2-reactive CD1d molecules at the cell surface
of iron-loaded HepG2 cells could be a consequence of
CD1d misfolding in intracellular compartments with a
subsequent release of the bound lipid; thus altering the
intracellular lipid content. A number of previous stud-
ies tend to support this view. First, CD1d has a con-
served tyrosine motif within its cytoplasmic tail that
permits the association with molecules that facilitate
trafficking between the plasma membrane and endo-
lysosomal compartments [38–40]. Second, earlier stud-
ies showed that in situations of hepatic iron loading,
iron accumulates primarily in lysosomes leading to
alterations in membrane composition and vesicular pH
[41–43]. Third, CD1d has the capacity to bind a
variety of intracellular lipids in the endolysosomal
compartment and changes in the pH of these compart-
ments may alter lipid binding by CD1d molecules and,
consequently, trafficking between the plasma mem-
brane and endolysosomes [44].
Taking into consideration these studies, upregulation
of CD1d in iron-loaded HepG2 cells could be largely
due to biochemical and molecular changes that take
place within the endolysosomal compartment and that
result in a redistribution of endolysosomal CD1d mole-
cules to the plasma membrane. Interestingly, in the
present study we demonstrated that iron-loading of
HepG2 cells led to marked changes in lipid metabo-
lism. Thus, expression of phosphatidylserine at the
outer part of iron-loaded HepG2 cells was increased,
and double-labeling revealed that the increase in phos-
phatidylserine expression was of the same order of
magnitude as the upregulation of CD1d expression. In
other words, the same HepG2 cells expressed CD1d
and phosphatidylserine. Although phosphatidylserine
externalization is regarded as a hallmark of apoptosis,
recent studies suggest that phosphatidylserine expres-
sion, and membrane lipid redistribution in general, is a
normal event in viable cells that marks a process rela-
ted with the cell cycle status [45]. In this context, it is
important to stress that DNA content studies did not
show significant differences in apoptosis (subG0 ⁄ G1)
between normal and iron-loaded HepG2 cells. Further
examination of lipid metabolism parameters led to the
finding of overt lipid accumulation and lipid droplet
formation in iron-loaded HepG2 cells, as verified by
Oil Red O staining and transmission electron micros-
copy. These data reinforce the view that changes in
lipid metabolism take place in iron loaded HepG2 cells
which may underlie the redistribution of CD1d and its
expression at the cell surface. A study showing that
CD1d expression augments in lipid-laden macrophages
from atherosclerotic tissue supports this view [46].
Apart from the present study, Nor3.2-reactive CD1d
has been found altered in keratinocytes from psoriatic
lesions [47], in the gastrointestinal tract of certain
inflammatory diseases [48,49], and in primary biliary
cirrhosis [50]. Whether iron and ⁄ or lipid metabolism
are altered in any of these conditions is not known. In
our view, upregulation of CD1d molecules at the cell
surface of iron-loaded HepG2 cells in a non-native
form may have implications at two different levels; at
the level of the hepatic cell itself and at the level of the
relationship with neighboring cells. At the level of the
hepatocyte, CD1d redistribution may influence quanti-
tatively and qualitatively the intracellular lipid pool by
either intracellular release and ⁄ or extracellular uptake.
At the level of the relationship with adjacent cells
in vivo, upregulation of CD1d by hepatocytes may
function as a signaling device that activates selected
subsets of resident NK CD8+ T cells (reviewed in
CD1d upregulation in iron-loaded HepG2 cells M. Cabrita et al.
160 FEBS Journal 272 (2005) 152–165 ª 2004 FEBS
[51]). Recent studies in humans during hepatitis C viral
infections showing that hepatic CD1d is upregulated
and recognized by CD1d-specific T cells tend to sup-
port this assumption [52]. Activation of CD1d-restric-
ted T cells may induce the secretion of cytokines
capable of regulating hepatic iron metabolism [53].
Alternatively, phosphatidylserine expression, concomit-
ant with CD1d, by iron-loaded hepatocytes may facili-
tate phagocytosis and removal of the purportedly
apoptotic cells by resident macrophages through the
phosphatidylserine receptor [54]. Removal of apoptotic
cells may avoid local inflammation by a number of dif-
ferent mechanisms, such as production of TGF-b1as
seen in iron-overloaded hemochromatosis patients [33].
TGF-b1 production under iron overload could be
the result of the phosphatidylserine ⁄ CD1d-dependent
ingestion of apoptotic hepatocytes by resident Kupffer
cells and may contribute to reduce local inflammation,
as demonstrated in a recent report [55].
The present in vitro model may be used to study
mechanisms of hepatic cell function under a number of
stressful conditions associated with iron-overload, such
as viral infections or heavy alcohol consumption and
to examine the possible role played by cells and mole-
cules of the immunological system in hepatic injury
and repair. Understanding the interdependence between
the metabolism of iron and lipids [14,56,57] may be
relevant in a variety of liver diseases. It is anticipated
that iron overload in hepatic cells in clinical situations
in vivo might cause changes in lipid metabolism
and consequently in lipid binding molecules such as
CD1d.
Materials and methods
Cells and culture conditions
The hepatocellular carcinoma cell line HepG2 was pur-
chased from the European Collection of Cell Cultures
(ECACC, Wiltshire, UK) and maintained in Minimum
Essential Medium, MEM (Gibco, Invitrogen, Merelbeke,
Belgium) supplemented with 1% (w ⁄ v) antibiotic ⁄ anti-
miotic solution (Sigma-Aldrich, Barcelona, Spain), 1%
(w ⁄ v) glutamine, 1% (w ⁄ v) nonessential amino acids and
2% (w ⁄ v) fetal bovine serum (Biochrom KG, Berlin, Ger-
many). Paired cultures of cells growing in normal media or
in iron-rich media were set up and maintained for different
periods of time as indicated. Iron-rich media consisted of
MEM supplemented with 100 lm of ferric citrate (Sigma-
Aldrich). Ferric citrate was prepared freshly from a stock
solution of 25 mm made in distilled H
2
O by gentle agitation
at 65 °C and stored at 4 °C. Unless otherwise indica-
ted, cells were seeded at 2 · 10
6
per 75-cm
2
flask (TPP,
Trasadingen, Switzerland) and stored for a week in an incu-
bator at 37 °C, 5% (v ⁄ v) CO
2
and 99% humidity. After
this period, cells were treated with a solution of 1% (w ⁄ v)
trypsin ⁄ EDTA (Gibco), washed with Hanks’ balanced salt
solution (HBSS), counted and replated as described above.
HepG2 cells cultured in MEM-2% usually reached conflu-
ence with a viable cell recovery between 7 and 9 · 10
6
cells
per flask during the 1-week period. To analyze the effect of
direct oxidative stress, HepG2 cells were grown in the pres-
ence of H
2
O
2
and diamide (Sigma-Aldrich). Seven days
after, phenotypic and morphological parameters of cell
growth and survival were determined.
Flow cytometry
Approximately 0.3 · 10
6
cells were cell surface stained with
the appropriate
5
antibodies in staining solution [NaCl ⁄ P
i
,
0.2% (w ⁄ v) BSA, 0.1% (w ⁄ v) sodium azide
6
] and analyzed
in a FACScalibur (Becton Dickinson, Mountain View, CA,
USA). For intracellular staining, fixed cells in 2% (v ⁄ v) for-
maldehyde were first permeabilized by incubation in
NaCl ⁄ P
i
⁄ 0.2% (w ⁄ v) saponin for 10 min. The following
primary antibodies were used: W6 ⁄ 32, a monoclonal anti-
body to human b2m-associated MHC class I molecules
(DAKO, Glostrup, Denmark); CR3 ⁄ 43, a monoclonal anti-
body to human MHC class II molecules (DAKO); Nor3.2
a monoclonal antibody to non-native human CD1d (BIO-
DESIGN, Saco, ME, USA [26]); CD1d42, a monoclonal
antibody to native human CD1d (Pharmingen, San Diego,
CA, USA); 1B9, a monoclonal antibody to the human
intestinal epithelial molecule gp180 (a gift from L. Mayer,
Mount Sinai School of Medicine, New York
7
, USA);
MCA534, a monoclonal antibody to human ICAM-1
(SEROTEC, Oxford, UK); Ber-T9, a monoclonal antibody
to the human transferrin receptor (DAKO); rabbit Igs to
human ferritin (DAKO); 5F6, a monoclonal antibody to
oxidatively modified proteins containing the aldehyde
adduct acrolein (a gift from K. Uchida
8
, Nagoya University,
Nagoya, Japan). Rabbit anti-mouse and goat anti-rabbit
Igs, fluorescein isothiocyanate (FITC)
9,10
or R-phycoerythrin
9,10
-
conjugated, were from DAKO. Mouse and rabbit Igs
(DAKO) were used as negative controls. Annexin V-FITC
was from BD Biosciences (San Diego, CA, USA).
Determination of intracellular iron
Intracellular ferric iron was detected by the Perls’ Prussian
blue. Briefly, cytospins
11
(centrifugations of cell suspensions
on glass slides) of HepG2 cells were fixed and incubated for
1 h in a 1 : 1 solution of 2% potassium ferrocyanide ⁄ 2%
HCl (w ⁄ v ⁄ v). Afterwards, cytospins were rinsed in distilled
water, counterstained with erytrosin, dehydrated in 70%
(v ⁄ v) alcohol, then in 100% (v ⁄ v) alcohol and xylol
12
, and
finally mounted in Entellan (Merck, Barcelona, Spain).
M. Cabrita et al. CD1d upregulation in iron-loaded HepG2 cells
FEBS Journal 272 (2005) 152–165 ª 2004 FEBS 161
Determination of phosphatidylserine expression
and cell death
Phosphatidylserine expression on the outer part of the
plasma membrane was examined by Annexin V binding.
Briefly, cells were washed twice with binding buffer (10 mm
Hepes, 140 mm NaCl and 2.5 mm CaCl
2
, pH 7.4) and incu-
bated with Annexin V-FITC for 15 min at room tempera-
ture. Cells were analyzed immediately by flow cytometry.
In immunofluorescence studies, cells were fixed in acetone
prior to analysis. Cell death was determined by trypan blue
staining. Aliquots of HepG2 cells were resuspended in
NaCl ⁄ P
i
containing trypan blue. Dead and alive cells were
counted in a NEUBAUER chamber under a light micro-
scope.
Measurement of oxidative stress and DNA
content
Oxidative stress was measured through the detection of
ROS and of protein-bound acrolein. ROS produced within
HepG2 cells were detected with the membrane permeant
probe 2¢,7¢-dichlorodihydrofluorescein-diacetate (DCFH-
DA). ROS produced by the cell oxidize DCFH to DCF,
which after excitation at 488 nm, emits fluorescence at
530 nm (FL-1 channel). Growing HepG2 cells were incuba-
ted with 10 lm of DCFH-DA in culture media for 30 min
at 37 °C and washed three times with the same media. Cells
were then harvested and analyzed immediately by flow
cytometry. Protein-bound acrolein was detected by flow
cytometry after labeling with the mouse monoclonal anti-
body 5F6, followed by the appropriate
13
fluorochrome-conju-
gated rabbit anti-mouse Igs. To evaluate DNA content,
HepG2 cells were permeabilized with ice-cold 70% (v ⁄ v)
ethanol for 10 min. Then, cells were washed three times
with NaCl ⁄ P
i
and stained for 30 min at 37 °C with
50 lgÆmL
)1
of propidium iodide in NaCl ⁄ P
i
. Labeled cells
were acquired immediately in a FACScalibur and apoptotic
(subG0 ⁄ G1), resting (G1) and dividing (S + G2 ⁄ M) cells
determined by DNA content (PI fluorescence) monitored
on the FL-3 channel.
Cell labeling, immunoprecipitation and
immunoblotting
For immunoprecipitation of cell surface CD1d, HepG2
cells were incubated with 0.5 lgÆmL
)1
of NHS-sulfo-biotin
(Perbio Science, Cheshire, UK) in NaCl ⁄ P
i
for 10 min at
room temperature (20–25 °C)
14
followed by four washes in
NaCl ⁄ P
i
. After washing, labeled cells were lysed in lysis
buffer [20 mm Tris pH 7.6, 150 mm NaCl, 1 mm phenyl-
methanesulfonyl fluoride and 1% (v ⁄ v) Triton X-100] for
30 min on ice. The lysates were centrifuged at 10 000 g to
remove cell debris and precleared for 1 h with protein-A
Sepharose beads (Amersham Pharmacia Biotech, Bucking-
hamshire, UK). Precleared detergent lysates were boiled
for 10 min in 0.1% (v ⁄ v) SDS and then immunoprecipi-
tated with Nor3.2 and protein A-Sepharose beads for 2 h
at 4 °C. Washed immunoprecipitates were boiled for 5 min
and resolved by SDS ⁄ PAGE. Proteins were blotted onto
nitrocellulose membranes (Amersham Pharmacia Biotech)
and the filters blocked with 5% (w ⁄ v) nonfat dry milk in
TBS-T. Washed filters were incubated for 1 h with a
1 : 7500 dilution of streptavidin-conjugated horseradish
peroxidase (Sigma) in TBS-T, and proteins visualized using
Super Signal (Perbio Science). For detection of total
CD1d molecules, cell lysates of nonbiotinylated cells were
immunoprecipitated, resolved by SDS ⁄ PAGE and trans-
ferred onto nitrocellulose membranes as above. After-
wards, filters were incubated with Nor3.2 antibodies for
1 h in TBS-T, followed by incubation with HRP-conju-
gated goat anti-(mouse Ig) Igs (Molecular Probes, Leiden,
the Netherlands). After extensive washing, CD1d was visu-
alized with Super Signal (Perbio Science).
RT-PCR
HepG2 cells were collected into cryotubes vials (Nunc,
VWR International, Lisbon, Portugal), snap frozen in
liquid nitrogen and stored at )70 °C for further analysis.
From each sample, total RNA was isolated and DNAse
treated using the RNeasy kit according to the manufacture
specifications (Qiagen, Victoria, Australia). The total RNA
concentration was measured by spectrophotometer and its
quality assessed by agarose gel electrophoresis. Subse-
quently, 5 lg of total RNA was converted into cDNA by
using the termoscript RT-PCR system (Gibco) according to
the recommended protocol. The CD1d gene was amplified
by PCR using the following primers: 5¢-GGGCACTC
AGCCAGGGGACATCCTGCCCAA-3¢ as forward and
5¢-GATACAAGTTTGCACACCTTTGCACTTCTG-3¢ as
reverse [58]. The PCR amplification was performed in a
total volume of 50 lL reaction mix containing 1 l Lof
cDNA, 10 pmol of each primer, 10· reaction buffer,
0.5 mm dNTPs and 2 units of Taq polymerase (Promega,
Madison, WI, USA). For the CD1d amplification, we used
the following PCR program: an initial denaturing step of
3 min at 92 °C, followed by 35 cycles (92 °C for 30 s,
55 °C for 1 min and 72 °C for 3 min) and a final extension
step for 10 min at 72 °C. Subsequently, 10 lL of the PCR
products were loaded into a 1.5% agarose gel with 1· ethi-
dium bromide
15
, the electrophoresis performed and the
547 bp fragment visualized under UV light. To ensure that
the cDNA samples were of similar concentration and qual-
ity, the GAPDH gene was also amplified by using a similar
protocol with the housekeeping gene specific primers:
5¢-CCATGGAGAAGGCTGGGG-3¢ as forward and 5¢-CA
AAGTTGTCATGGATGACC-3¢ as reverse.
CD1d upregulation in iron-loaded HepG2 cells M. Cabrita et al.
162 FEBS Journal 272 (2005) 152–165 ª 2004 FEBS
Immunocytochemistry and immunofluorescence
Cytospins of HepG2 cells in poly(l-lysine)
16
-coated slides
(Sigma) were air-dried and fixed with 100% (v ⁄ v) acetone.
Immunocytochemistry was performed by using the alkaline
phosphatase-antialkaline phosphatase (APAAP)
17
method.
Briefly, cytospins were incubated with normal rabbit serum
diluted 1 : 10 for 10 min. Then, cells were incubated with
Nor3.2 or with DAK-GO1 a monoclonal antibody of the
same isotype but specific for Aspergillus niger glucose oxi-
dase (negative control). After washing, cytopins were incu-
bated with rabbit anti-mouse Igs for 30 min, followed by a
further 30 min with the APAAP conjugate. These steps were
repeated for 10 min each to increase the intensity of the sig-
nal. After three additional washes
18
, color was developed with
Fast-Red substrate. Reagents were from DAKO. Prepara-
tions were analyzed on an Axioskop microscope (Zeiss,
Go
¨
ttingen, Germany) equipped with a SPOT II camera
(Diagnostic Instruments, Sterling, Michigan, USA). For
immunofluorescence studies, the tyramide signal amplifica-
tion TSA kit containing a HRP-conjugated secondary anti-
body and Alexa 568-labeled tyramide was used (Molecular
Probes, Leiden). Briefly, cells were first stained in suspension
with Nor3.2 followed by HRP-goat anti-(mouse IgG). For
phosphatidylserine determination, cells were washed with
binding buffer and incubated with Annexin V-FITC for
15 min at room temperature. Cells were deposited immedi-
ately in poly(l-lysine)
19
coated slides and incubated with
Alexa Fluor 568 tyramide following manufacturer instruc-
tions. Preparations were fixed in 100% acetone at )20 °C
for 5 min, mounted in Vectashield with 4¢,6-diamidino-
2-phenylindole (DAPI)
20
(Vector Laboratories, Inc., Burlin-
game, CA) and analyzed in an Axioskop microscope (Zeiss).
Electron microscopy
The ultrastructure of HepG2 cells was examined by trans-
mission electron microscopy following established routine
protocols. Briefly, HepG2 cells were harvested after trypsin
treatment, washed extensively and fixed in 2.5% (v ⁄ v) glu-
taraldehyde in cacodylate buffer (0.1 m, pH 7.2) and post-
fixed in 1% (w ⁄ v) osmium tetroxide in the same buffer.
The samples were then embedded in Epon resin (TAAB
Laboratories Equipment Ltd, Berkshire, UK) after dehy-
dration in a series of graded ethanol. Ultrathin sections
were cut with an RMC MT-7 microtome and contrasted
with uranyl acetate and lead citrate. Observations and
micrographs were performed under a Zeiss EM10 electron
microscope.
Microscopic evaluation of lipid droplets
Light microscopic examination of lipid droplet was per-
formed using Oil Red O. HepG2 cells were harvested after
trypsin treatment and washed extensively. Then, cryostat
sections from a cell pellet were fixed in a buffered isotonic
solution of 4% (v ⁄ v) formaldehyde for 5 min, and washed
in running tap water for 5 min. Then, sections were incuba-
ted in 85% (v ⁄ v) propyleneglycol for 2 min (the solution
was changed twice) and in Oil Red O [0.5% (v ⁄ v) in pro-
pyleneglycol] for 30 min. After rinsing in 85% (v ⁄ v) propyl-
eneglycol for 1 min (the solution was changed twice), slides
were washed twice in distilled water. Finally, sections were
counterstained in hematoxylin for 30 s and mounted in
AQUATEX
Ò
(Merck, Darmstadt, Germany).
Statistical analyses
The paired Student’s t-test (two-tailed) was used to test the
significance of the differences between group means. Statis-
tical significance was defined as P < 0.05.
Acknowledgements
This work was funded by the Inova Foundation for
Medical Research ⁄ The American Portuguese Biomedi-
cal Research Fund (APBRF, USA). The authors
would like to thank L. Mayer and K. Uchida for pro-
viding antibodies, A. do Vale, F. Pisarra and M.T. Sil-
va for help and comments on TEM, and M. Santos
and R. Hultcrantz for critical reading of the manu-
script. We also thank M. de Sousa for mentoring this
work. M.C. and C.F.P. were supported by a fellowship
from Inova ⁄ APBRF. E.M.C. was partially supported
by EU grant (QLG1-CT-1999–00665).
References
1 Feder JN, Gnirke A, Thomas W, Tsuchihashi Z, Ruddy
DA & Basava A (2003) The discovery of the new
haemochromatosis gene 1996. J Hepatol 38, 704–709.
21
2 Wilson IA & Bjorkman PJ (1998) Unusual MHC-like
molecules: CD1, Fc receptor, the hemochromatosis gene
product, and viral homologs. Curr Opin Immunol 10,
67–73.
3 Zhou XY, Tomatsu S, Fleming RE, Parkkila S, Waheed
A, Jiang J, Fei Y, Brunt EM, Ruddy DA, Prass CE
et al. (1998) HFE gene knockout produces mouse model
of hereditary hemochromatosis. Proc Natl Acad Sci
USA 95, 2492–2497.
4 Levy JE, Montross LK, Cohen DE, Fleming MD &
Andrews NC (1999) The C282Y mutation causing her-
editary hemochromatosis does not produce a null allele.
Blood 94, 9–11.
5 Santos M, Schilham MW, Rademakers LH, Marx JJ,
de Sousa M & Clevers H (1996) Defective iron homeo-
stasis in beta 2-microglobulin knockout mice recapitu-
lates hereditary hemochromatosis in man. J Exp Med
184, 1975–1985.
M. Cabrita et al. CD1d upregulation in iron-loaded HepG2 cells
FEBS Journal 272 (2005) 152–165 ª 2004 FEBS 163
6 Olynyk JK, Cullen DJ, Aquilia S, Rossi E, Summerville
L & Powell LW (1999) A population-based study of the
clinical expression of the hemochromatosis gene. New
Engl J Med 341, 718–724.
7 Levy JE, Montross LK & Andrews NC (2000) Genes
that modify the hemochromatosis phenotype in mice.
J Clin Invest 105, 1209–1216.
8 Beutler E (2003) The HFE Cys282Tyr mutation as a
necessary but not sufficient cause of clinical hereditary
hemochromatosis. Blood 101, 3347–3350.
9 Porto G, Vicente C, Teixeira MA, Martins O, Cabeda
JM, Lacerda R, Goncalves C, Fraga J, Macedo G, Silva
BM et al. (1997) Relative impact of HLA phenotype
and CD4-CD8 ratios on the clinical expression of hemo-
chromatosis. Hepatology 25, 397–402.
10 Arosa FA, Oliveira L, Porto G, da Silva BM, Kruijer
W, Veltman J & de Sousa M (1997) Anomalies of the
CD8+ T cell pool in haemochromatosis: HLA-A3-
linked expansions of CD8+CD28- T cells. Clin Exp
Immunol 107, 548–554.
11 Cardoso EM, Hagen K, de Sousa M & Hultcrantz R
(2001) Hepatic damage in C282Y homozygotes relates
to low numbers of CD8+ cells in the liver lobuli. Eur
J Clin Invest 31, 45–53.
12 Cardoso EM, Macedo MG, Rohrlich P, Ribeiro E,
Silva MT, Lemonnier FA & de Sousa M (2002)
Increased hepatic iron in mice lacking classical MHC
class I molecules. Blood 100 , 4239–4241.
13 Stal P, Broome U, Scheynius A, Befrits R & Hultcrantz
R (1995) Kupffer cell iron overload induces intercellular
adhesion molecule-1 expression on hepatocytes in
genetic hemochromatosis. Hepatology 21, 1308–1316.
14 Barisani D, Meneveri R, Ginelli E, Cassani C & Conte
D (2000) Iron overload and gene expression in HepG2
cells: analysis by differential display. FEBS Lett 469,
208–212.
15 George DK, Goldwurm S, MacDonald GA, Cowley
LL, Walker NI, Ward PJ, Jazwinska EC & Powell LW
(1998) Increased hepatic iron concentration in nonalco-
holic steatohepatitis is associated with increased fibrosis.
Gastroenterology 114, 311–318.
16 Bonkovsky HL, Jawaid Q, Tortorelli K, LeClair P,
Cobb J, Lambrecht RW & Banner BF (1999) Non-alco-
holic steatohepatitis and iron: increased prevalence of
mutations of the HFE gene in non-alcoholic steatohepa-
titis. J Hepatol 31, 421–429.
17 Mendler MH, Turlin B, Moirand R, Jouanolle AM,
Sapey T, Guyader D, Le Gall JY, Brissot P, David V &
Deugnier Y (1999) Insulin resistance-associated hepatic
iron overload. Gastroenterology 117, 1155–1163.
18 Naidenko OV, Maher JK, Ernst WA, Sakai T, Modlin
L & Kronenberg M (1999) Binding and antigen presen-
tation of ceramide-containing glycolipids by soluble
mouse and human CD1d molecules. J Exp Med 190,
1069–1080.
19 Porcelli SA & Modlin RL (1999) The CD1 system: anti-
gen-presenting molecules for T cell recognition of lipids
and glycolipids. Annu Rev Immunol 17, 297–329.
20 Blumberg RS, Terhorst C, Bleicher P, McDermott FV,
Allan CH, Landau SB, Trier JS & Balk SP (1991)
Expression of a nonpolymorphic MHC class I-like
molecule, CD1D, by human intestinal epithelial cells.
J Immunol 147, 2518–2524.
21 Canchis PW, Bhan AK, Landau SB, Yang L, Balk SP
& Blumberg RS (1993) Tissue distribution of the non-
polymorphic major histocompatibility complex class
I-like molecule, CD1d. Immunology 80, 561–565.
22 Briken V, Moody DB & Porcelli SA (2000) Diversifica-
tion of CD1 proteins: Sampling the lipid content of dif-
ferent cellular compartments. Sem Immunol 12, 517–525.
23 Sugita M, Cernadas M & Brenner MB (2004) New
insights into pathways for CD1-mediated antigen pre-
sentation. Curr Opin Immunol 16, 90–95.
24 Grootveld M, Bell JD, Halliwell B, Aruoma OI, Bom-
ford A & Sadler PJ (1999) Non-transferrin-bound iron
in plasma or serum from patients with idiopathic hemo-
chromatosis: characterization by high performance
liquid chromatography and nuclear magnetic resonance
spectroscopy. J Biol Chem 264, 4417–4422.
25 Uchida K (1999) Current status of acrolein as a lipid
peroxidation product. Trends Cardiovasc Med 9, 109–
113.
26 Bilsland CA & Milstein C (1991) The identification of
the beta 2-microglobulin binding antigen encoded by
the human CD1D gene. Eur J Immunol 21, 71–78.
27 Shinkai K & Locksley RM (2000) CD1, tuberculosis,
and the evolution of major histocompatibility complex
molecules. J Exp Med 191, 907–914.
28 Campbell NA, Kim HS, Blumberg RS & Mayer L
(1999) The nonclassical class I molecule CD1d associ-
ates with the novel CD8 ligand gp180 on intestinal
epithelial cells. J Biol Chem 274, 26259–26265.
29 Han O, Fleet JC & Wood RJ (1999) Reciprocal regula-
tion of HFE and NRamp2 gene expression by iron in
human intestinal cells. J Nutr 129, 98–104.
30 Tallkvist J, Bowlus CL & Lonnerdal B (2000) Functional
and molecular responses of human intestinal Caco-2 cells
to iron treatment. Am J Clin Nutr 72, 770–775.
31 Hubert N, Lescoat G, Sciot R, Moirand R, Jego P,
Leroyer P & Brissot P (1993) Regulation of ferritin and
transferrin receptor expression by iron in human hepa-
tocyte cultures. J Hepatol 18, 301–312.
32 Hagen K, Zhu C, Melefors O & Hultcrantz R (1999)
Susceptibility of cultured rat hepatocytes to oxidative
stress by peroxides and iron. The extracellular matrix
affects the toxicity of tert-butyl hydroperoxide. Int J
Biochem Cell Biol 31, 499–508.
33 Houglum K, Ramm GA, Crawford DH, Witztum JL,
Powell LW & Chojkier M (1997) Excess iron induces
hepatic oxidative stress and transforming growth factor
CD1d upregulation in iron-loaded HepG2 cells M. Cabrita et al.
164 FEBS Journal 272 (2005) 152–165 ª 2004 FEBS
beta1 in genetic hemochromatosis. Hepatology 26, 605–
610.
34 Staubli A & Boelsterli UA (1998) The labile iron pool
in hepatocytes: prooxidant-induced increase in free iron
precedes oxidative cell injury. Am J Physiol 274,
G1031–G1037.
35 Kapla
´
n P, Doval M, Majerova Z, Lehotsky J & Racay P
(2000) Iron-induced lipid peroxidation and protein mod-
ification in endoplasmic reticulum membranes. Protec-
tion by stobadine. Int J Biochem Cell Biol 32, 539–547.
36 Arezzini B, Lunghi B, Lungarella G & Gardi C (2003)
Iron overload enhances the development of experimen-
tal liver cirrhosis in mice. Int J Biochem Cell Biol 35,
486–495.
37 Britton RS, Ramm GA, Olynyk J, Singh R, O’Neill R
& Bacon BR (1994) Pathophysiology of iron toxicity.
Adv Exp Medical Biol 356 , 239–253.
38 Rodionov DG, Nordeng TW, Pedersen K, Balk SP &
Bakke, O (1999) A critical tyrosine residue in the cyto-
plasmic tail is important for CD1d internalization but
not for its basolateral sorting in MDCK cells. J Immu-
nol 162, 1488–1495.
39 Jayawardena-Wolf J, Benlagha K, Chiu YH, Mehr R &
Bendelac A (2001) CD1d endosomal trafficking is inde-
pendently regulated by an intrinsic CD1d-encoded tyro-
sine motif and by the invariant chain. Immunity 15,
897–908.
40 Kang SJ & Cresswell P (2002) Regulation of intracellu-
lar trafficking of human CD1d by association with
MHC class II molecules. EMBO J 21 , 1650–1660.
41 Cleton MI, de Bruijn WC, van Blokland WT, Marx JJ,
Roelofs JM & Rademakers LH (1988) Iron content and
acid phosphatase activity in hepatic parenchymal lyso-
somes of patients with hemochromatosis before and after
phlebotomy treatment. Ultrastruct Pathol 12, 161–174.
42 Stal P, Glaumann H & Hultcrantz R (1990) Liver cell
damage and lysosomal iron storage in patients with
idiopathic hemochromatosis. A light and electron micro-
scopic study. J Hepatol 11, 172–180.
43 Myers BM, Prendergast FG, Holman R, Kuntz SM &
LaRusso NF (1991) Alterations in the structure, physi-
cochemical properties, and pH of hepatocyte lysosomes
in experimental iron overload. J Clin Invest 88, 1207–
1215.
44 Roberts TJ, Sriram V, Spence PM, Gui M, Hayakawa
K, Bacik I, Bennink JR, Yewdell JW & Brutkiewicz RR
(2002) Recycling CD1d1 molecules present endogenous
antigens processed in an endocytic compartment to
NKT cells. J Immunol 168, 5409–5414.
45 Dillon SR, Constantinescu A & Schlissel MS (2001)
Annexin V binds to positively selected B cells. J Immu-
nol 166, 58–71.
46 Melia
´
n A, Geng Y-J, Sukhova GK, Libby P & Porcelli
SA (1999) CD1 expression in human atherosclerosis.
A potential mechanism for T cell activation by foam
cells. Am J Pathol 155, 775–786.
47 Bonish B, Jullien D, Dutronc Y, Huang BB, Modlin R,
Spada FM, Porcelli SA & Nickoloff BJ (2000) Over-
expression of CD1d by keratinocytes in psoriasis and
CD1d-dependent IFN-gamma production by NK-T
cells. J Immunol 165, 4076–4085.
48 Page MJ, Poritz LS, Tilberg AF, Zhang WJ, Chorney
MJ & Koltun WA (2000) CD1d-restricted cellular lysis
by peripheral blood lymphocytes: relevance to the
inflammatory bowel disease. J Surg Res 92 , 214–221.
49 Ulanova M, Torebring M, Porcelli SA, Bengtsson U,
Magnunson J, Magnunson O, Lin XP, Hanson LA &
Telemo E (2000) Expression of CD1d in the duodenum
of patients with cow’s milk hypersensitivity. Scand J
Immunol 52, 609–617.
50 Tsuneyama K, Yasoshima M, Harada K, Hiramatsu K,
Gershwin ME & Nakanuma Y (1998) Increased CD1d
expression on small bile duct epithelium and epithelioid
granuloma in livers in primary biliary cirrhosis. Hepato-
logy 28, 620–623.
51 Arosa FA (2002) CD8+CD28- T cells: Certainties and
uncertainties of a prevalent human T cell subset. Immu-
nol Cell Biol 80, 1–13.
52 Durante-Mangoni E, Wang R, Shaulov A, He Q,
Nasser I, Afdhal N, Koziel MJ & Exley MA (2004)
Hepatic CD1d expression in hepatitis C virus infection
and recognition by resident proinflammatory CD1d-
reactive T cells. J Immunol 173, 2159–2166.
53 Hirayama M, Kohgo Y, Kondo H, Shintani N,
Fujikawa K, Sasaki K, Kato J & Niitsu Y (1993) Regu-
lation of iron metabolism in HepG2 cells: a possible
role for cytokines in the hepatic deposition of iron.
Hepatology 18, 874–880.
54 Fadok VA, Bratton DL, Rose DM, Pearson A,
Ezekewitz RA & Henson PM (2000) A receptor for
phosphatidylserine-specific clearance of apoptotic cells.
Nature 405, 85–90.
55 Huynh ML, Fadok VA & Henson PM (2002) Phospha-
tidylserine-dependent ingestion of apoptotic cells pro-
motes TGF-beta1 secretion and the resolution of
inflammation. J Clin Invest 109, 41–50.
56 Van Lenten BJ, Prieve J, Navab M, Hama S, Lusis AJ
& Fogelman AM (1995) Lipid-induced changes in intra-
cellular iron homeostasis in vitro and in vivo. J Clin
Invest 95, 2104–2110.
57 Brunet S, Thibault L, Delvin E, Yotov W, Bendayan M
& Levy E (1999) Dietary iron overload and induced
lipid peroxidation are associated with impaired plasma
lipid transport and hepatic sterol metabolism in rats.
Hepatology 29, 1809–1817.
58 Woolfson A & Milstein C (1994) Alternative splicing
generates secretory isoforms of human CD1. Proc Natl
Acad Sci USA 91, 6683–6687.
M. Cabrita et al. CD1d upregulation in iron-loaded HepG2 cells
FEBS Journal 272 (2005) 152–165 ª 2004 FEBS 165