Tài liệu Báo cáo khoa học: Structural characterization of Ca2+/CaM in complex with the phosphorylase kinase PhK5 peptide pdf
Bạn đang xem bản rút gọn của tài liệu. Xem và tải ngay bản đầy đủ của tài liệu tại đây (596.17 KB, 12 trang )
Structural characterization of Ca
2+
/CaM in complex with
the phosphorylase kinase PhK5 peptide
Atlanta G. Cook*, Louise N. Johnson and James M. McDonnell
Laboratory of Molecular Biophysics, Department of Biochemistry, Oxford University, UK
Phosphorylase kinase (PhK) is a Ca
2+
-regulated pro-
tein kinase that controls the breakdown of glycogen
through phosphorylation of glycogen phosphorylase
(reviewed in [1]). The enzyme is a large, 1.3-MDa hexa-
decameric complex consisting of four copies of four
subunits, a, b, c and d. The a and b subunits are regu-
latory and are the sites of phosphorylation and meta-
bolite binding and are also regulated by the binding
of extrinsic calmodulin (CaM). The c subunit is the
catalytic subunit and the d subunit is an intrinsic mole-
cule of CaM that binds to the enzyme even in the
absence of Ca
2+
[2]. The regulation of PhK through
Ca
2+
⁄ CaM enables the coordination of muscle contrac-
tion with the production of glucose through the action
of Ca
2+
on calmodulin and troponin C [3].
PhK is related to other Ca
2+
⁄ CaM-dependent protein
kinases including myosin light chain kinase (MLCK),
CaM kinases I, II and IV (CaMKI, CaMKII and
CaMKIV, respectively), CaM kinase kinase (CaMKK),
titin kinase, and death associated kinase [4]. Structural
studies on CaMKI [5], titin kinase [6] and twitchin
kinase [7] have upheld the prediction that many
CaM-dependent protein kinases are regulated through
an autoinhibitory mechanism [8]. In these structures a
C-terminal extension to the protein kinase folds back
on the kinase domain and interferes with the substrate
binding sites. In the case of the titin and twitchin
kinases, the autoinhibitory sequence acts as a pseudo-
substrate, occluding ATP binding and preventing
protein substrates from binding (reviewed in [9]).
PhK shows typical traits associated with such an
autoinhibitory mechanism. The sequence of the PhKc
subunit encodes a C-terminal extension to the protein
kinase domain and treatment of the kinase with
Keywords
calmodulin; kinase regulation; protein–
protein interaction; NMR spectroscopy
Correspondence
J. M. McDonnell, Laboratory of Molecular
Biophysics, Department of Biochemistry,
Oxford University, South Parks Road,
Oxford OX1 3QU, UK
Fax: +44 1865 275182
Tel: +44 1865 275381
E-mail:
*Present address
EMBL, Meyerhofstrasse 1, D-69117
Heidelberg, Germany
(Received 7 December 2004, revised 23
January 2005, accepted 1 February 2005)
doi:10.1111/j.1742-4658.2005.04591.x
Phosphorylase kinase (PhK) is a large hexadecameric enzyme consisting of
four copies of four subunits: (abcd)
4
. An intrinsic calmodulin (CaM, the d
subunit) binds directly to the c protein kinase chain. The interaction site
of CaM on c has been localized to a C-terminal extension of the kinase
domain. Two 25-mer peptides derived from this region, PhK5 and PhK13,
were identified previously as potential CaM-binding sites. Complex forma-
tion between Ca
2+
⁄ CaM with these two peptides was characterized using
analytical gel filtration and NMR methods. NMR chemical shift perturba-
tion studies showed that while PhK5 forms a robust complex with
Ca
2+
⁄ CaM, no interactions with PhK13 were observed.
15
N relaxation
characteristics of Ca
2+
⁄ CaM and Ca
2+
⁄ CaM ⁄ PhK5 complexes were
compared with the experimentally determined structures of several
Ca
2+
⁄ CaM ⁄ peptide complexes. Good fits were observed between
Ca
2+
⁄ CaM ⁄ PhK5 and three structures: Ca
2+
⁄ CaM complexes with pep-
tides from endothelial nitric oxide synthase, with smooth muscle myosin
light chain kinase and CaM kinase I. We conclude that the PhK5 site is
likely to have a direct role in Ca
2+
-regulated control of PhK activity
through the formation of a classical ‘compact’ CaM complex.
Abbreviations
CaM, calmodulin; CaMK, CaM kinase; CaMKK, CaM kinase kinase; eNOS, endothelial nitric oxide synthase; MLCK, myosin light chain
kinase; PhK, phosphorylase kinase; TFA, trifluoracetic acid.
FEBS Journal 272 (2005) 1511–1522 ª 2005 FEBS 1511
proteases causes cleavage of this extension at residue
296 and 298 and loss of Ca
2+
-dependent activity [10]
(Fig. 1). However, PhK also differs significantly from
other CaM-dependent protein kinases in that it binds
to CaM even in the absence of Ca
2+
. Studies on the
disruption of the holoenzyme produced two functional
complexes, the acd complex and the cd complex dem-
onstrating that CaM interacts with the kinase chain of
PhK directly [11]. Furthermore, separation of these
two chains is only possible through denaturation [12].
CaM is a ubiquitous Ca
2+
sensor that is found in
all eukaryotes and shows little sequence variation in
metazoans [13]. CaM undergoes large conformational
changes both on binding to Ca
2+
ions and on interact-
ing with its targets [14,15]. The protein consists of two
domains each encoding two EF-hand motifs separated
by a linker region that imparts a high degree of
conformational flexibility. In the presence of Ca
2+
ions
the protein undergoes conformation changes that alter
the surface properties of the two domains allowing
CaM to recognize its targets.
A number of structures of CaM in complex with
peptides derived from CaM target proteins have been
solved. In the classical case, these CaM binding pep-
tides have been identified as basic motifs of approxi-
mately 20 amino acids that are able to bind to CaM as
amphipathic helices [16]. Binding causes CaM to wrap
around the peptide helix forming a hydrophobic chan-
nel and a number of acidic residues on the surface of
the CaM domains typically form salt bridges with the
basic residues that are found in the peptide (Fig. 1).
Despite an overall similarity, the closed Ca
2+
⁄ CaM ⁄
peptide complexes show a variety of conformations
with respect to domain orientation and conformation
of the EF hands. The CaM binding domains in the
different proteins have little sequence similarity. They
display a variable distance between the hydrophobic
‘anchor’ residues that bind into each domain of CaM
and are classified on the basis of the distance between
these two motifs [17].
Two 25-mer peptide regions from the C-terminal
extension of PhKc were previously identified as poten-
tial CaM binding sites using a series of overlapping
synthetic peptides. These two peptides, PhK5 (342–
367) and PhK13 (302–326), were able to inhibit CaM
activation of MLCK [18] and Ca
2+
-dependent phos-
phodiesterase [19] and were shown to have K
I
values
in the low nanomolar range. Both peptides were dem-
onstrated to have an inhibitory effect on PhK with
PhK13 demonstrating competitive inhibition and
PhK5 showing noncompetitive inhibition kinetics [20].
PhK13, which lies towards the N terminus of the
C-terminal extension (Fig. 2), contains a sequence that
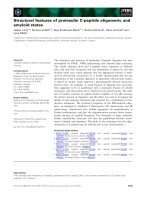
Fig. 1. The Ca
2+
⁄ CaM ⁄ smMLCK structure (PDBid 1cdl), demon-
strating the ‘compact’ structure of a Ca
2+
⁄ CaM ⁄ peptide complex.
The N-terminal domain is in blue and the C-terminal domain is in
pink. The peptide is shown as a green helix and the termini are
indicated with N and C. Two side chains are depicted correspond-
ing to the two anchor residues of the smMLCK peptide, Trp800
and Leu813. The individual helices are labelled with roman numer-
als starting from the N terminus. The Ca
2+
ions are shown as blue
spheres and are labelled 1–4. Figure prepared with
PYMOL [42]. The
alignment shows peptide sequences from various Ca
2+
⁄ CaM ⁄ pep-
tide structures in single amino acid code. The residues in yellow
are anchor residues and basic residues are shown in blue. In the
two PhK peptides large hydrophobic and aromatic residues are
shown in green that have been predicted as potential anchor resi-
dues for these two peptides. Both PhK peptides have previously
been assigned a ‘1–12 motif’, a structurally uncharacterized motif.
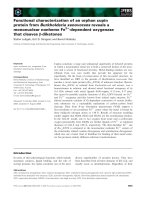
Fig. 2. An overview of the PhKc domain structure. The first 296
residues of the subunit encode a protein kinase domain. The struc-
ture of the constitutively active kinase domain has previously been
solved, coordinates are taken from PDBid 2phk [43,44]. Proteolytic
treatment cleaves between the kinase domain and the 90-residue
C-terminal extension of the kinase. Two 25-mer peptides in this
region, PhK13 and PhK5, were identified as potential CaM binding
domains.
Ca
2+
⁄ CaM in complex with the PhK5 peptide A. G. Cook et al.
1512 FEBS Journal 272 (2005) 1511–1522 ª 2005 FEBS
suggested it could act as a pseudosubstrate mimicking
the substrate phosphorylase. However, this role was
not supported by mutagenesis studies that converted a
potential pseudosubstrate cysteine residue to a serine
residue [21].
Comparative studies of the two peptides in complex
with Ca
2+
⁄ CaM with CD demonstrated that PhK5
was likely to form an a-helix when bound to CaM but
that PhK13 showed no changes in secondary structure
contributions on binding [22]. Further studies with
small angle X-ray scattering [23] demonstrated that
PhK5 induced a compact conformation of CaM, sim-
ilar to that observed with MLCK peptides, a result
that was further confirmed by fluorescence anisotropy
studies [24], but that the interactions of PhK13 were
anomalous and in the complex CaM adopted an exten-
ded conformation.
While these studies indicate that there are marked
differences in the Ca
2+
⁄ CaM ⁄ PhK5 complex vs. the
Ca
2+
⁄ CaM ⁄ PhK13 complexes, no direct structural
evidence for these two complexes is available. In this
paper we have used NMR methods to characterize
the structures. The NMR evidence shows that PhK5
does indeed form a classical collapsed complex with
CaM, but no interaction of CaM with PhK13 could
be detected. A method for identifying structural
similarity between Ca
2+
⁄ CaM ⁄ peptide complexes is
presented.
Results
The binding of PhK5 and PhK13 to Ca
2+
/CaM
High resolution analytical gel filtration was used to
identify the complexes of CaM with the two PhK pep-
tides. Because the previously reported K
I
values for the
peptides were in the low nanomolar range, the samples
were mixed together in a 1 : 1 molar ratio and gel fil-
tration was carried out in the presence of Ca
2+
.
Ca
2+
⁄ CaM, in the absence of peptides, elutes as a sin-
gle peak after a volume of 16.12 mL. As Ca
2+
⁄ CaM
does not contain any tryptophan residues the absorb-
ance at 280 nm is entirely contributed by tyrosine
residues and is therefore relatively low. When the
Ca
2+
⁄ CaM ⁄ PhK5 complex was loaded onto the col-
umn, the peak moved to 16.31 mL and showed a
higher absorbance at 280 nm. PhK5 has one trypto-
phan residue and two tyrosine residues that accounts
for the increase in absorbance. The formation of a
Ca
2+
⁄ CaM ⁄ PhK5 complex was confirmed by analysis
of the peak fractions by tris-tricine SDS ⁄ PAGE that
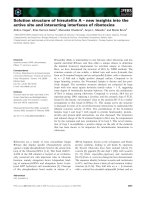
shows a smaller band, of % 3 kDa, that coelutes with
CaM. That the peak shows an increase in peak elution
volume indicates that complex Ca
2+
⁄ CaM ⁄ PhK5 has
a smaller radius of gyration than Ca
2+
⁄ CaM and
this is consistent with a more compact structure.
When a similar analysis was carried out with the
Ca
2+
⁄ CaM ⁄ PhK13 mixture no alteration in the peak
intensity or the peak volume was observed. Although
PhK13 has no tryptophan residues, it does contain sev-
eral tyrosine residues and the absence of an absorb-
ance increase suggests that PhK13 does not bind.
Furthermore, analysis of peak fractions by SDS ⁄
PAGE indicates that no peptide coelutes with
Ca
2+
⁄ CaM (Fig. 3 inset).
The lack of PhK13 binding was surprising, so we
sought a more definitive experiment to demonstrate
peptide binding. Using NMR spectroscopy, titrations
were carried out with unlabelled peptides into
15
N
labelled Ca
2+
⁄ CaM. Chemical shift changes in the
CaM backbone amides were monitored using
1
H-
15
N
HSQC. PhK5 causes a large number of chemical shift
changes in the Ca
2+
⁄ CaM HSQC spectrum indicative
of a large conformational change upon binding of
PhK5 (Fig. 4A). These changes are observed early in
the titration, at as little as 20% saturation changes are
readily apparent. Intermediate peaks between the
unbound and bound species are not observed indica-
ting that the binding of PhK5 to Ca
2+
⁄ CaM has slow
exchange kinetics and this is consistent with the nano-
molar K
I
values that had previously been reported.
Fig. 3. Gel filtration analysis of Ca
2+
⁄ CaM and its complexes with
PhK5 and PhK13. In all runs the same concentration of Ca
2+
⁄ CaM
was used and a 1 : 1 molar ratio of peptide was added. The inset
shows a Tris ⁄ tricine SDS ⁄ PAGE gel analysis of the peak fractions
from the gel filtration run. In all cases CaM is seen as a band of
% 17 kDa. Only when Ca
2+
⁄ CaM is mixed with PhK5 is a smaller
peptide band also observed.
A. G. Cook et al. Ca
2+
⁄ CaM in complex with the PhK5 peptide
FEBS Journal 272 (2005) 1511–1522 ª 2005 FEBS 1513
When PhK13 was titrated into Ca
2+
⁄ CaM no chemical
shift changes are observed (Fig. 4B. No binding inter-
actions are observed between PhK13 and CaM; at the
concentrations we performed this experiment the affin-
ity of this interaction would need to be 10 mm for us
not to detect it by this method.
The
1
H-
15
N HSQC for free Ca
2+
⁄ CaM are essen-
tially identical to previously described spectra [25], and
so peaks were assigned by comparison. Of the 92
peaks that could be assigned in this way, only 13 in
the PhK5 titration do not show any alteration in
chemical shift (summarized in Table 1). These include
residues that are found in solvent exposed regions
(Leu4, Glu6, Asn42 and Glu45) that are unlikely to
change on complex formation as they do not interact
with peptide ligands. In addition, four glycine residues,
found in the second position of the four distinct EF-
hand motifs (Gly23, Gly59, Gly96 and Gly132) also
show no changes in chemical shift. Three further resi-
dues that are found buried between the two EF-hand
motifs (Thr62, Ile100 and Val136) are also found not
to have any chemical shift changes. These residues
form part of the hydrophobic packing between EF-
hand motifs and this explains their unaltered chemical
environment. Lastly two further residues, Met72 and
Glu82 are also unchanged. These two residues are
found on the connecting helices between the two
domains of Ca
2+
⁄ CaM. While Glu82 is either solvent
exposed or disordered in Ca
2+
⁄ CaM peptides com-
plexes, Met72 is found to interact with peptide ligands
in some structures such as the complex with CaMKIIa
peptide [26], but not in others, for example the com-
plex with smMLCK [27].
T1 and T2 relaxation times for Ca
2+
/CaM and
Ca
2+
/CaM/PhK5
The large number of chemical shift changes that
occur on binding of PhK5 to Ca
2+
⁄ CaM suggest that
this binding event is not a localized phenomenon and
causes large changes in the structure throughout the
molecule. This is consistent with a large conforma-
tional change occurring on binding of the peptide
and could indicate that the binding of PhK5 to
Ca
2+
⁄ CaM is similar to that observed for Ca
2+
⁄ CaM
binding to isolated peptides from other protein kin-
ases. Previous studies using fluorescence anisotropy
have indicated that PhK5 binds to CaM as a col-
lapsed complex that has similar properties to other
CaM ⁄ peptide complexes [24]. To determine whether
the binding of PhK5 does cause a conformational
change in CaM, the T1 and T2 constants were meas-
ured for each residue to allow a better understanding
of the hydrodynamic behaviour of Ca
2+
⁄ CaM and
Ca
2+
⁄ CaM ⁄ PhK5.
HSQC spectra were taken after a series of increasing
relaxation delays to measure the T1 and T2 relaxation
times. For each residue identified in the spectrum, a
single exponential fit to the peak intensities over the
series of spectra was used to calculate R1 (1 ⁄ T1) and
R2 (1 ⁄ T2). The R1 and R2 values were plotted against
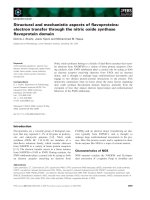
Fig. 4. (Top) Overlay of two spectra from the titration of Ca
2+
⁄ CaM
with PhK5 peptide. The red spectrum shows the position of peaks
prior to the addition of PhK5 peptide. The blue spectrum shows a
spectrum taken when a 1 : 1.2 molar ratio of Ca
2+
⁄ CaM to PhK5
had been reached. The inset shows an expanded view of the indi-
cated area of the spectrum. (Bottom) An overlay of spectra from
the titration of Ca
2+
⁄ CaM with PhK13 peptide showing in red the
spectrum prior to titration and in blue, the spectrum after a 1 : 0.8
molar ratio of Ca
2+
⁄ CaM to PhK13 had been reached. The inset
shows an expanded view of part of the spectrum equivalent to that
shown in (A). No chemical shift changes were observed on titration
with PhK13.
Table 1. CaM residues unaffected by PhK5 binding.
Residues that
remain unchanged Role in structure
Leu4, Glu6, Asn42, Glu45 Solvent exposed
Gly23, Gly59, Gly96, Gly132 Second glycine in EF-motif
Thr62, Ile100, Val136 Buried between EF-motifs
Glu82 Found in connecting helices
Met72 Found in connecting helices,
binds ligands in some
CaM structures
Ca
2+
⁄ CaM in complex with the PhK5 peptide A. G. Cook et al.
1514 FEBS Journal 272 (2005) 1511–1522 ª 2005 FEBS
residue number, and average values for R1 and R2
over each helix were calculated (Fig. 5). R1 and R2
are expected to have a reciprocal relationship for
movements on the nanosecond to picosecond time-
scale, i.e. the timescale for molecular reorientation.
The pattern of the average helical R1 and R2 values
clearly indicate that the complex of Ca
2+
⁄ CaM ⁄ PhK5
forms a more compact structure than Ca
2+
⁄ CaM, and
that PhK5 binding does induce conformational
change.
The R2 plot for Ca
2+
⁄ CaM ⁄ PhK5 shows unusual
periodic increases in R2 over the length of helix I that
are not reflected in the R1 values. The periodicity of
the changes follow approximately the periodicity of the
helix and the residues with higher R2 values are found
on one face of helix I that is found to interact with
peptide ligands in CaM ⁄ peptide complexes. This effect
could be caused by conformational exchange on the
millisecond timescale (R
ex
) that affects only one side of
the helix.
Fig. 5. The R1 and R2 relaxation rates were
plotted against residue number. At the base
of each plot the structural elements of CaM
are indicated by the single line plot with heli-
ces labelled in Roman numerals in the first
plot. The average relaxation rate of each helix
is plotted as a black bar. The first helix of the
Ca
2+
⁄ CaM ⁄ PhK5 R2 is highlighted by a box;
the periodicity of the R2 effects suggests R
ex
phenomena in this helix. Residues 21, 57, 94
and 130 (indicated), which occupy identical
positions in each EF-hand motif and are
involved in chelating the Ca
2+
ions, each
show markedly reduced R2 values.
A. G. Cook et al. Ca
2+
⁄ CaM in complex with the PhK5 peptide
FEBS Journal 272 (2005) 1511–1522 ª 2005 FEBS 1515
Comparison of relaxation data with other
CaM/peptide complexes
In anisotropic proteins,
15
N relaxation rates depend on
the orientation of the N–H bond vectors relative to
the principal axis frame of the rotational diffusion ten-
sor. For residues that are known to be structurally
rigid relaxation anisotropy can be used to derive orien-
tational constraints for structure calculations [28]. The
analysis of orientational information from the relaxa-
tion characteristics of amide bond vectors is made
more straightforward in the case of a-helical proteins.
Because the amide bond vectors of an a-helix all point
in the same direction, the average R1 ⁄ R2 ratio for resi-
dues in that helix provides information about its orien-
tation relative to the overall diffusion tensor of the
molecule. Upon binding of peptide ligands, calmodulin
undergoes a dramatic alteration in structure marked
by changes in the relative orientations of its eight
a-helical elements. Different peptide ligands result in
subtle differences in the CaM conformations.
We did not have an experimental model of
Ca
2+
⁄ CaM ⁄ PhK5 structure, but a number of struc-
tures of CaM ⁄ peptide complexes are available that
reflect wide conformational diversity of the CaM mole-
cule. Therefore we used the program rotdif [29,30] to
calculate the diffusion tensor of a PDB-derived CaM
structure, back-calculate the R1 and R2 values for the
helical elements of the PDB structure and then com-
pare these values to the experimentally derived relaxa-
tion parameters for Ca
2+
⁄ CaM ⁄ PhK5 and, as a
control, for Ca
2+
⁄ CaM. For these calculations each
helix was treated as a structural element; R1 and R2
values for each helix were averaged based on four con-
secutive residues in the middle of the helix. For the
Ca
2+
⁄ CaM ⁄ PhK5 data, helix IV had to be excluded
because of insufficient data due to spectral overlap and
in the case of helix I, only the lower R2 values were
used to exclude the R
ex
effects.
Isotropic, axially symmetric (z ¼ long axis, x ¼ y ¼
short axes) and fully anisotropic models (z > y > x
axis) were all considered for fitting the relaxation data.
The data fit much better to axially symmetric models
than to isotopic models (P<1 · 10
)4
, unless noted).
The improvement in fit going from an axially symmet-
ric model to the fully anisotropic model was generally
not statistically significant (the likelihood that the
improvements in fit occurred by chance showed a
range of P ¼ 4.58 · 10
)1
to P ¼ 2.12 · 10
)2
) and
therefore the data presented here are for an axially
symmetric model only. One case, CaMKK, was noted
to be borderline as the improvement in fit using an
axially symmetric model over an isotropic model gave
a poorer probability score (P ¼ 2.29 · 10
)2
for the
anisotropic vs. isotropic models) and this is reflected in
the D
para
⁄ D
perp
ratio that was calculated for this com-
plex (Table 2). However, this structure was included
and treated as axially symmetric for the purposes of
this study.
Table 2 shows the target functions calculated by
comparison of experimental relaxation data with data
back-calculated from the PDB files of the input models.
As expected, poor fits were generally observed between
the Ca
2+
⁄ CaM data, where CaM is in the extended
conformation, and the various peptide complex models,
where CaM is in the folded conformation. The
Ca
2+
⁄ CaM ⁄ PhK5 dataset showed betters fits in
general and several structures (Ca
2+
⁄ CaM ⁄ smMLCK,
Ca
2+
⁄ CaM ⁄ endothelial nitric oxide synthase (eNOS)
and Ca
2+
⁄ CaM ⁄ CaMKI) appeared to fit the relaxation
data better than others. A structural alignment of these
three models shows that they are indeed close structural
Table 2. The quality of fits (described by the chi-squared per degrees of freedom) for a series of Ca
2+
⁄ CaM ⁄ peptide complexes against the
relaxation data for Ca
2+
⁄ CaM ⁄ PhK5 and Ca
2+
⁄ CaM. While all structures show relatively poor fits with the unbound Ca
2+
⁄ CaM structure,
including the compact form of Ca
2+
⁄ CaM, much better fits are observed with the peptide bound structures, particularly the complexes with
smMLCK peptide, CaMKI peptide and eNOS peptide. The s
c
value, the molecular correlation time, is calculated from the fit and can be
defined as the time taken for the molecule to rotate through 1 radian or to translate through its own length. D
para
⁄ D
perp
is the ratio between
the length of the longs axis, z, and the length of the shorter, equal x and y axes.
CaM ⁄ peptide complex PDB file
v
2
Ca
2+
⁄ CaM ⁄ PhK5
v
2
Ca
2+
⁄ CaM s
c
(ns) D
para
⁄ D
perp
smMLCK 1cdl 0.178 2.46 9.41 1.18
CaMKII 1cdm 0.239 2.67 9.41 1.21
CaMKI 1mxe 0.144 2.53 9.41 1.18
CaMKK 1iq5 0.697 3.21 9.37 1.13
eNOS 1niw 0.170 2.15 9.45 1.23
MARCKS 1iwq 0.329 2.68 9.40 1.20
Ca
2+
⁄ CaM (compact) 1prw 0.449 3.31 9.41 1.18
Ca
2+
⁄ CaM in complex with the PhK5 peptide A. G. Cook et al.
1516 FEBS Journal 272 (2005) 1511–1522 ª 2005 FEBS
relatives. The remaining structures, which fit the relaxa-
tion data less well, show a variety of relative helix ori-
entations (Fig. 6).
Discussion
The binding of PhK5 and PhK13 to Ca
2+
/CaM
PhKc interacts with the CaM Ca
2+
sensor through a
C-terminal extension to the kinase domain of % 90 res-
idues. Previous studies on PhKc identified two regions
in this C-terminal extension, PhK5 and PhK13, that
were able to inhibit Ca
2+
⁄ CaM-mediated activation of
MLCK. Further studies also indicated that there may
be substantial differences in the binding of PhK5 and
PhK13 to CaM based on small angle X-ray scattering
studies and CD measurements. The present studies on
the PhK13 and PhK5 peptide complexes have substan-
tiated these significant differences in their interactions
with CaM. Analytical gel filtration and NMR chemical
shift perturbation studies indicated no detectable inter-
action between Ca
2+
⁄ CaM and PhK13. In contrast,
PhK5 formed a robust complex with Ca
2+
⁄ CaM under
conditions of gel filtration and the addition of PhK5
caused a large number of NMR chemical shift changes
in Ca
2+
⁄ CaM.
Taken together, these data demonstrate that the
region of PhKc that is delineated by the PhK13 pep-
tide does not interact directly with Ca
2+
⁄ CaM under
the conditions used in this study. The ability of
this peptide to inhibit the MLCK activity was well
established and it was demonstrated to bind to CaM
in a Ca
2+
-dependent manner in gel mobility assays
[18]. However the small angle X-ray and neutron
scattering data indicated that the PhK ⁄ Ca
2+
⁄ CaM
interaction is anomalous [23]. The CaM remained
extended on binding PhK13. PhK13 failed to protect
CaM against proteolysis while PhK5 did protect in a
manner similar to other CaM binding peptides [22].
Analysis of the PhKc C-terminal extension sequences
from a number of different organisms suggests that
the PhK5 region is likely to be the more important
in Ca
2+
signalling. The PhK5 region is conserved
(15 residues out of 25 identical) while the PhK13
region shows only two residues out of 25 identical
and does not exhibit a canonical CaM binding
sequence (Fig. 7). The differences observed under dif-
ferent experimental conditions for the PhK13 ⁄ CaM
interactions require further work and could best be
resolved by a crystal structure of full length PhKc
subunit with CaM, a structure that has so far been
elusive.
Does the PhK5 peptide cause conformational
changes in Ca
2+
/CaM?
Both X-ray scattering and fluorescence anisotropy
studies of the Ca
2+
⁄ CaM ⁄ PhK5 complex have indica-
ted that this complex has a similar structure to the
complexes of Ca
2+
⁄ CaM with peptides derived from
other CaM-dependent enzymes. Our analytical gel fil-
tration studies and NMR titration experiments are also
Fig. 6. (A) A comparison the three structures that show highest correlation with Ca
2+
⁄ CaM ⁄ PhK5, that includes Ca
2+
⁄ CaM ⁄ eNOS in blue
(PDBid 1niw), Ca
2+
⁄ CaM ⁄ smMLCK in pink (PDBid 1cdl) and Ca
2+
⁄ CaM ⁄ CaMKI in orange (PDBid 1mxe). The Ca
2+
ions are indicated as cyan
spheres and the smMLCK peptide is shown as a white helix. Structures are aligned using the C-terminal domain of CaM (residues 86–146).
The orientation presented here is similar to that shown in Fig. 1. (B) A similar alignment showing structures that show poorer correlations
with Ca
2+
⁄ CaM ⁄ PhK5. Ca
2+
⁄ CaM ⁄ smMLCK is shown in pink once again as a reference. Ca
2+
⁄ CaM ⁄ CaMKK is in red (PDBid 1iq5),
Ca
2+
⁄ CaM ⁄ CaMKIIa is shown in green (PDBid 1cdm) and the Ca
2+
⁄ CaM ⁄ MARCKS structure (PDBid 1iwq) is shown in yellow. Figure pre-
pared with
AESOP (MEM Noble, unpublished work).
A. G. Cook et al. Ca
2+
⁄ CaM in complex with the PhK5 peptide
FEBS Journal 272 (2005) 1511–1522 ª 2005 FEBS 1517
consistent with a compact structure of the Ca
2+
⁄
CaM ⁄ PhK5 complex. The spectrum of Ca
2+
⁄ CaM ⁄
PhK5 is dramatically different from that of the
unbound Ca
2+
⁄ CaM with only 13 peaks out of 146
that show no alteration in chemical shift, indicating
that a large conformational change occurs on binding
peptide. Comparison of the R1 values for Ca
2+
⁄ CaM
and Ca
2+
⁄ CaM ⁄ PhK5 show a significant decrease
upon PhK5 binding as well as a reduction in the vari-
ation of R1 in secondary structural elements, suggest-
ing that the two domains no longer tumble
independently and that CaM assumes a more compact
structure in the bound form.
Analysis of the R1 and R2 relaxation times for
each assigned peak in the Ca
2+
⁄ CaM and Ca
2+
⁄
CaM ⁄ PhK5 samples supported the notion of a
significant conformational change. The R1 and R2
relaxation times for a particular nucleus are depend-
ent on its reorientation in solution and can give
information about the conformational flexibility of
different protein regions. For relatively rigid residues
the relaxation times will reflect the overall motion
of the molecule as it tumbles in solution. These
motions, on the nanosecond to picosecond timescale,
will have reciprocal effects on the R1 and R2 relaxa-
tion times, although this relationship breaks down
when the residues are subject to conformational
exchange (R
ex
) [29,30]. Thus for residues in secon-
dary structure elements, such as a-helices, the R1
and R2 relaxation times can give information on the
rotation of the molecule in solution. When a mole-
cule tumbles anisotropically, the residues with N–H
bond vectors aligned with the long axis of the mole-
cule will reorient more slowly compared with N–H
bond vectors that are orientated along the shorter
axes. This causes differences in the average R1 and
R2 properties of a given helix depending on how it
is oriented with respect to the long axis of the mole-
cule. The differing patterns of average R1 and R2
values along each helix for Ca
2+
⁄ CaM and the
Ca
2+
⁄ CaM ⁄ PhK5 indicate that the orientations of
the helices that make up the structure are different
in the two species. As these data apply only to the
main chain nitrogen atoms of the CaM structures
this shows that PhK5 has indeed induced a conform-
ational change in Ca
2+
⁄ CaM.
Fig. 7. Sequence alignment of the C-terminal extension of PhKc. Sequences were obtained for both vertebrate and nonvertebrates by using
sequence from 296 to 386 of PhKc from rabbit muscle. Identities are shown by the blue boxes with white text, while blue text and green
boxes indicate regions of sequence similarity. Numbering is taken from the rabbit muscle sequence. The regions corresponding to the PhK5
and PhK13 peptides are indicated by pink boxes. This figure was prepared using
ESPRIPT [45].
Ca
2+
⁄ CaM in complex with the PhK5 peptide A. G. Cook et al.
1518 FEBS Journal 272 (2005) 1511–1522 ª 2005 FEBS
How similar is the Ca
2+
/CaM/PhK5 complex to
other Ca
2+
/CaM/peptide complexes?
Classical Ca
2+
⁄ CaM ⁄ peptide complexes are largely
similar in their formation of a closed, compact CaM
structure around a helical amphipathic peptide. How-
ever, many of these complexes also show distinct con-
formations, not only in the mode of ligand binding
but also in the relative orientation of the two CaM
domains. These differences are facilitated by the flexi-
bility of the linker between the two domains as well as
a certain degree of conformational flexibility in the
two EF hand motifs of each CaM domain. The pres-
ence of a relatively large number of Ca
2+
⁄ CaM ⁄ pep-
tide complexes in the PDB opens up the possibility of
using these structures to perform structural compari-
sons against unknown structures. Indeed, comparative
studies have previously been performed using NMR
NOE data or residual dipolar couplings [31,32] to
identify structural similarities between different CaM ⁄
peptide complexes.
The study presented here uses rotation anisotropy
of CaM and its effects on the relaxation rates of
N–H bond vectors of the CaM backbone. Each of
the Ca
2+
⁄ CaM ⁄ peptide structures was used as an
input model in lieu of a Ca
2+
⁄ CaM ⁄ PhK5 model,
for the program rotdif that calculates hydro-
dynamic parameters based on a structure and its
relaxation data [29,30]. The hydrodynamic data were
consistent with a monomeric structure of % 20 kDa.
Out of the seven PDB files that were used as input
models, three structures showed better fits than the
rest. These three structures are the complexes with
the eNOS peptide, the smMLCK peptide and the
CaMKI peptide. All three of these are structural rel-
atives and show rmsds of the Ca atoms of 1.705 A
˚
comparing CaMKI to smMLCK, 1.972 A
˚
comparing
CaMKI to eNOS and 2.633 A
˚
comparing smMLCK
to eNOS. In addition, all three peptides have been
identified as binding with a 1–14 motif of anchor
residues while the remaining structures in the study
show 1–16 binding (CaMKK) and 1–10 binding
(CaMKIIa) [17]. The MARCKS peptide structure
shows an unusual pattern of binding in that its
anchor residues are separated by only one residue. A
1–14 motif is compatible with the PhK5 sequence,
with L345 and V358 serving as anchor residues.
With this predicted motif a strong similarity between
the PhK5 and CaMKI peptide sequences becomes
more apparent (Fig. 1). Of the PDB files tested, the
CaM ⁄ CaMKI structure was the best fit to the
CaM ⁄ PhK5 relaxation data (Table 2). On the other
hand, PhK5 does contain one large hydrophobic
residue, Trp357, that is perhaps more likely to serve
as anchor reside than Val358. Interestingly, the three
peptides from MLCK, CaMKI and eNOS each have
a large aromatic residue in the N-terminal part of
the peptide that binds in the with the C-terminal
domain in CaM. However in PhK5 Trp357 is found
at the C-terminal end of the peptide. This suggests
that either PhK5 might bind with Trp357 in the
N-terminal site in CaM, or perhaps could bind in
the opposite orientation to incorporate the Trp into
the larger C-terminal domain binding site.
In summary, PhKc is known to bind to CaM via its
C-terminal extension. The data presented here demon-
strate that PhK5 interacts directly with Ca
2+
⁄ CaM
and that PhK13 does not. The PhK5 interaction causes
a large conformational change to occur in Ca
2+
⁄ CaM
that produces a classical compact Ca
2+
⁄ CaM ⁄ peptide
complex. Analysis of the NMR relaxation data sug-
gests that the Ca
2+
⁄ CaM ⁄ PhK5 complex is a close
structural relative of CaM complexes with eNOS,
smMLCK and CaMKI.
Experimental procedures
Preparation of CaM
The CaM cDNA from Xenopus leavis was a kind gift from
D. Owen (Oxford University, UK) and was cloned into the
pPROTet.E232 vector (Clontech, Oxford, UK). The plasmid
was transformed into BL21-PRO cells (Clontech) and
expressed at 37 ° C by induction with 100 ngÆmL
)1
anhydro-
tetracycline for 5 h. The cells were harvested by centrifuga-
tion and resuspended in 50 mm Tris ⁄ HCl pH 7.5, 2 mm
EDTA, 0.2 mm phenylmethanesulfonyl fluoride and were
stored at )20 °C. Purification of CaM was carried out using
the method of Hayashi et al. with minor modifications [33].
The cells were thawed and lysed by sonication and the sol-
uble fraction was collected by centrifugation at 100 000 g in
a Beckman L8-M ultracentrifuge for 1 h at 4 °C. CaCl
2
was
added to the supernatant to a final concentration of 5 mm
and the sample was then applied to a 50-mL phenyl seph-
arose column pre-equilibrated in 50 mm Tris ⁄ HCl pH 7.5,
5mm CaCl
2
, 100 mm NaCl. Two steps were carried out to
remove the majority of contaminants from the protein sam-
ple, a low Ca
2+
wash with 50 mm Tris ⁄ HCl pH 7.5, 0.1 mm
CaCl
2
, 100 mm NaCl and then a high salt wash with 50 mm
Tris ⁄ HCl pH 7.5, 0.1 mm CaCl
2
, 0.5 m NaCl. Finally, CaM
was eluted from the column using a Ca
2+
-free buffer con-
taining 0.2 mm EDTA and 50 mm Tris ⁄ HCl pH 7.5.
To produce
15
N labelled protein for NMR experiments,
the cells were grown on M9 medium instead of Luria–
Bertani broth and supplemented with 1.5 lm thiamine and
15
NH
4
Cl as sole nitrogen source. Purification was carried
out using the standard protocol and the pure protein was
A. G. Cook et al. Ca
2+
⁄ CaM in complex with the PhK5 peptide
FEBS Journal 272 (2005) 1511–1522 ª 2005 FEBS 1519
concentrated to % 1mm and buffer exchanged at least four
times into 20 mm deuterated Tris ⁄ HCl pH 6.5.
PhK5 and PhK13 peptides
The PhK5 peptide (amino acid sequence LRRLIDAYAFRI
YGHWVKKGQQQNR) and the PhK13 peptide (amino
acid sequence GKFKIVCLTVLASVRIYYQYRRVKP)
were custom synthesized using solid phase fmoc chemistry
by G. Bloomberg (Bristol University, UK). The peptides
were further purified by reverse phase chromatography
using a 250 · 10 mm C5 column (Phenomenex, Maccles-
field, UK). The peptides were loaded in 0.1% trifluoracetic
acid (TFA) and eluted using a gradient from 0.1% TFA to
0.1% TFA and 50% acetonitrile over five column volumes.
The peptides were then lyophilized and reconstituted into
double deionized H
2
O and dialysed against water at 4 °Cto
remove salt impurities. MS of these purified peptides was
performed on a Micromass Platform-II ESI mass spectro-
meter (Waters, Elstree, UK) and gave expected molecular
mass values (3118 ± 3 and 3004 ± 4 Da, for PhK5 and
PhK13, respectively), thus confirming the composition of
the peptides that were used in subsequent experiments.
Analytical gel filtration
Analytical gel filtration was carried out using an SD200
high resolution sepharose column (Amersham-Pharmacia,
Uppsala, Sweden). The column was pre-equilibrated with
50 mm Tris ⁄ HCl pH 7.0, 10 mm CaCl
2
, 100 mm KCl. The
concentration of CaM and the peptides was determined by
absorbance at 280 nm using calculated e-values. Peptides
were mixed with 30 nmol CaM in a 1 : 1 molar ratio and
then analysed by gel filtration chromatography. The peaks
were concentrated using 3 lL of Strataclean protein bind-
ing beads (Stratagene, Amsterdam, the Netherlands) and
then analysed on a 10–20% gradient Tris ⁄ tricine polyacryl-
amide gel (BioRad, Hercules, CA, USA).
CaM/peptide titrations
Samples for NMR titrations contained 5 mm CaCl
2
,20mm
deuterated Tris ⁄ HCl pH 6.5, 5% (v ⁄ v) D
2
Oina400lL vol-
ume. Titrations were carried out using a spectrometer with a
magnet (Oxford Instruments) operating with a
1
H frequency
of 500 MHz. The sample was maintained at a temperature
of 25 °C. Gradient enhanced HSQC spectra were collected
with a sweep width of 16 p.p.m. in the
1
H dimension
and 40 p.p.m. in the
15
N dimension with the
1
H carrier
frequency set to 4.74 p.p.m. and the
15
N carrier frequency
set to 120 p.p.m. For each experiment 32 scans were taken
with 128 increments in the nitrogen dimension. The
Ca
2+
⁄ CaM sample was at a concentration of 0.45 mm and
contained % 0.2 lmol protein. The PhK5 peptide was
reconstituted in NMR buffer to a concentration of 16 mm.
Successive additions of 0.02–0.04 lmol of peptide were
made to the CaM sample, to a final molar ratio of 1 : 1.4
CaM to peptide. The PhK13 peptide was treated in the same
way and spectra were taken over a similar range, up to a
ratio of 1 : 0.8 CaM to PhK13. Data were processed using
FELIX 2.3 (Biosym Inc.) and analysed with xeasy [34].
Analysis of
15
N relaxation data
NMR experiments were performed on spectrometers oper-
ating at
1
H frequencies of 600 MHz at 25 °C. Backbone
15
N relaxation parameters, comprising the rates of
15
N
transverse (R2) and longitudinal (R1) relaxation were
measured using previously described experimental protocols
[35].
15
N R1 and R2 relaxation data for Ca
2+
⁄ CaM and
for the Ca
2+
⁄ CaM ⁄ PhK5 complex were obtained by
recording a series of gradient enhanced two-dimensional
HSQC spectra with a series of T1 (20, 400, 600, 800, 1000,
1200 and 1400 ms) and T2 (8.6, 60.5, 86.4, 103.7, 129.6,
172.8 and 216 ms) delays. For the Ca
2+
⁄ CaM sample, a
1.4 mm sample of CaM was made up in 20 mm deuterated
Tris ⁄ HCl pH 6.5, 100 mm KCl, 10 mm CaCl
2
and 5%
(v ⁄ v) D
2
O. For the Ca
2+
⁄ CaM ⁄ PhK5 complex 350 lLof
1.4 mm CaM was diluted into 6 mL of the NMR buffer
and mixed with 0.5 lmol PhK5 peptide. The complex was
concentrated using a centricon filter unit with a 3 kDa
cut-off to a final concentration of 0.75 mm. Data were
processed with felix 2.3. The peaks were assigned by com-
parison with the previous assignments for CaM [25] using
the program sparky for assignment and measurement of
peak intensities.
The longitudinal and transverse relaxation rates (R1 ¼
1 ⁄ T1 and R2 ¼ 1 ⁄ T2, respectively), were calculated by fit-
ting a single exponential to the peak intensities for different
time points using matlab 6.5. Four residues from each helix
in the structure were used and their R1 and R2 values were
averaged to produce orientation vectors for each helix for
the rotational anisotropy analysis. Fitting of the hydro-
dynamic parameters was carried out using rotdif written
by D. Fushman (University of Maryland, USA) [29,30]. For
the Ca
2+
⁄ CaM data all eight helices from the CaM structure
were represented, however, in the Ca
2+
⁄ CaM ⁄ PhK5 data
the fourth helix was discarded as spectral overlap resulted in
too few data points for meaningful analysis. As no hetero-
nuclear NOE measurements were taken for either data set,
the NOE values assigned for each residue used in the analy-
sis was 0.80 ± 0.04, to reflect typical values for residues in
stable secondary structure elements and are consistent with
previous measurements made for CaM [25,36].
Six Ca
2+
⁄ CaM ⁄ peptide structures were selected from the
PDB along with the collapsed, peptide-free structure of
Ca
2+
⁄ CaM (PDBid 1prw) [37] as input models for the
calculations in rotdif. The structures included complexes
Ca
2+
⁄ CaM in complex with the PhK5 peptide A. G. Cook et al.
1520 FEBS Journal 272 (2005) 1511–1522 ª 2005 FEBS
with peptides derived from smooth muscle MLCK (PDBid
1cdl) [27], CaMKI (1mxe) [38], CaMKIIa (PDBid 1cdm)
[26], CaMKK (PDBid 1iq5) [39], eNOS (PDBid 1niw) [40]
and the MARCKS peptide (PDBid 1iwq) [41].
rotdif calculates q, a ratio of R2 and R1 that encodes
orientational information of the angle between a given
N–H bond vector and the long axis of the molecule. For all
of these calculations the molecule is assumed to be an
axially symmetric prolate spheroid with one long axis and
two equal short axes.
q ¼
2R
2
0
R
1
À 1
À1
Where R1¢ ¼ R1[1–1.249|cN ⁄ cH|(1–NOE)], R2¢ ¼ R2–
1.079|cN ⁄ cH |R1(1–NOE), and cN and cH are the gyro-
magnetic ratios for
1
H and
15
N. The calculation of R2¢ and
R1¢ subtracts contributions from the high frequency com-
ponents of local motions. The Levenberg–Marquardt algo-
rithm is used to minimize the target function:
v
2
¼
X
i
q
exp
i
À q
calc
i
r
qi
2
Where q
exp
i
is the ratio from the measured relaxation
parameters for each residue i, and q
calc
i
is the ratio calcula-
ted from the current model. The value r
i
is the error in q
i
for residue i. Isotropic, axially symmetric and fully aniso-
tropic models were all considered.
Acknowledgements
We are grateful to D. Fushman for the use of rotdif
and for helpful discussions. This work was supported
by the Medical Research Council, UK.
References
1 Brushia RJ & Walsh DA (1999) Phosphorylase kinase:
the complexity of its regulation is reflected in the
complexity of its structure. Front Biosci 4, D618–
D641.
2 Cohen P, Burchell A, Foulkes JG & Cohen PT (1978)
Identification of the Ca2+-dependent modulator pro-
tein as the fourth subunit of rabbit skeletal muscle
phosphorylase kinase. FEBS Lett 92, 287–293.
3 Cohen P, Klee CB, Picton C & Shenolikar S (1980) Cal-
cium control of muscle phosphorylase kinase through
the combined action of calmodulin and troponin. Ann
NY Acad Sci 356 , 151–161.
4 Manning G, Whyte DB, Martinez R, Hunter T &
Sudarsanam S (2002) The protein kinase complement of
the human genome. Science 298, 1912–1934.
5 Goldberg J, Nairn AC & Kuriyan J (1996) Structural
basis for the autoinhibition of calcium ⁄ calmodulin-
dependent protein kinase I. Cell 84, 875–887.
6 Mayans O, van der Ven PF, Wilm M, Mues A, Young
P, Furst DO, Wilmanns M & Gautel M (1998) Struc-
tural basis for activation of the titin kinase domain dur-
ing myofibrillogenesis. Nature 395, 863–869.
7 Kobe B, Heierhorst J, Feil SC, Parker MW, Benian
GM, Weiss KR & Kemp BE (1996) Giant protein
kinases: domain interactions and structural basis of
autoregulation. EMBO J 15 , 6810–6821.
8 Kemp BE & Pearson RB (1991) Intrasteric regulation
of protein kinases and phosphatases. Biochim Biophys
Acta 1094, 67–76.
9 Wilmanns M, Gautel M & Mayans O (2000) Activation
of calcium ⁄ calmodulin regulated kinases. Cell Mol Biol
(Noisy-le-Grand) 46, 883–894.
10 Harris WR, Malencik DA, Johnson CM, Carr SA,
Roberts GD, Byles CA, Anderson SR, Heilmeyer LM
Jr, Fischer EH & Crabb JW (1990) Purification and
characterization of catalytic fragments of phosphorylase
kinase gamma subunit missing a calmodulin-binding
domain. J Biol Chem 265, 11740–11745.
11 Chan KF & Graves DJ (1982) Isolation and physico-
chemical properties of active complexes of rabbit muscle
phosphorylase kinase. J Biol Chem 257, 5939–5947.
12 Crabb J & Heilmeyer L Jr (1984) High performance
liquid chromatography purification and structural char-
acterization of the subunits of rabbit muscle phosphory-
lase kinase. J Biol Chem 259, 6346–6350.
13 Chin D & Means A (2000) Calmodulin: a prototypical
calcium sensor. Trends Cell Biol 10, 322–328.
14 Finn BE & Forsen S (1995) The evolving model of cal-
modulin structure, function and activation. Structure 3,
7–11.
15 Vetter SW & Leclerc E (2003) Novel aspects of calmo-
dulin target recognition and activation. Eur J Biochem
270, 404–414.
16 Crivici A & Ikura M (1995) Molecular and structural
basis of target recognition by calmodulin. Annu Rev
Biophys Biomol Struct 24, 85–116.
17 Yap KL, Kim J, Truong K, Sherman M, Yuan T &
Ikura M (2000) Calmodulin target database. J Struct
Funct Genomics 1, 8–14.
18 Dasgupta M, Honeycutt T & Blumenthal DK (1989)
The gamma-subunit of skeletal muscle phosphorylase
kinase contains two noncontiguous domains that act in
concert to bind calmodulin. J Biol Chem 264, 17156–
17163.
19 Newsholme P, Angelos KL & Walsh DA (1992) High
and intermediate affinity calmodulin binding domains of
the alpha and beta subunits of phosphorylase kinase
and their potential role in phosphorylation-dependent
activation of the holoenzyme. J Biol Chem 267, 810–
818.
20 Dasgupta M & Blumenthal DK (1995) Characteriza-
tion of the regulatory domain of the gamma-subunit
of phosphorylase kinase. The two noncontiguous
A. G. Cook et al. Ca
2+
⁄ CaM in complex with the PhK5 peptide
FEBS Journal 272 (2005) 1511–1522 ª 2005 FEBS 1521
calmodulin-binding subdomains are also autoinhibi-
tory. J Biol Chem 270, 22283–22289.
21 Bartleson C & Graves DJ (2001) An inhibitory segment
of the catalytic subunit of phosphorylase kinase does
not act as a pseudosubstrate. J Biol Chem 276, 34560–
34566.
22 Juminaga D, Albaugh SA & Steiner RF (1994) The
interaction of calmodulin with regulatory peptides of
phosphorylase kinase. J Biol Chem 269, 1660–1667.
23 Trewhella J, Blumenthal DK, Rokop SE & Seeger PA
(1990) Small-angle scattering studies show distinct con-
formations of calmodulin in its complexes with two pep-
tides based on the regulatory domain of the catalytic
subunit of phosphorylase kinase. Biochemistry 29, 9316–
9324.
24 Yao Y & Squier TC (1996) Variable conformation and
dynamics of calmodulin complexed with peptides
derived from the autoinhibitory domains of target pro-
teins. Biochemistry 35, 6815–6827.
25 Ikura M, Kay LE & Bax A (1990) A novel approach
for sequential assignment of 1H, 13C, and 15N spectra
of proteins: heteronuclear triple-resonance three-dimen-
sional NMR spectroscopy. Application to calmodulin.
Biochemistry 29, 4659–4667.
26 Meador WE, Means AR & Quiocho FA (1993) Mod-
ulation of calmodulin plasticity in molecular recogni-
tion on the basis of x-ray structures. Science 262,
1718–1721.
27 Meador WE, Means AR & Quiocho FA (1992) Target
enzyme recognition by calmodulin: 2.4 A structure of a
calmodulin-peptide complex. Science 257, 1251–1255.
28 Tjandra N, Garrett DS, Gronenborn AM, Bax A &
Clore GM (1997) Defining long range order in NMR
structure determination from the dependence of hetero-
nuclear relaxation times on rotational diffusion aniso-
tropy. Nat Struct Biol 4, 443–449.
29 Fushman D, Varadan R, Assfalg A & Walker O (2004)
Determining domain orientation in macromolecules by
using spin-relaxation and residual dipolar coupling mea-
surements. Prog Nuclear Magnetic Resonance Spectro-
scopy 44, 189–214.
30 Walker O, Varadan R & Fushman D (2004) Efficient
and accurate determination of teh overall rotational dif-
fusion tensor of a molecule from 15N relaxation data
using computer program ROTDIF. J Magnetic Reso-
nance 168, 336–345.
31 Amodeo P, Castiglione Morelli MA, Strazzullo G,
Fucile P, Gautel M & Motta A (2001) Kinase recogni-
tion by calmodulin: modeling the interaction with the
autoinhibitory region of human cardiac titin kinase.
J Mol Biol 306, 81–95.
32 Mal TK, Skrynnikov NR, Yap KL, Kay LE & Ikura
M (2002) Detecting protein kinase recognition modes of
calmodulin by residual dipolar couplings in solution
NMR. Biochemistry 41, 12899–12906.
33 Hayashi N, Matsubara M, Takasaki A, Titani K &
Taniguchi H (1998) An expression system of rat calmo-
dulin using T7 phage promoter in Escherichia coli.
Protein Expr Purif 12, 25–28.
34 Bartels C, Xia T-H, Billeter M, Guntert P & Wuthrich
K (1995) The program XEASY for computer-supported
NMR spectral analysis of biological macromolecules.
J Biomol NMR 5, 1–10.
35 Fushman D, Cahill SM & Cowburn D (1997) The main
chain dynamics of the dynamin pleckstin homology (PH)
domain in solution: analysis of 15N relaxation with
monomer ⁄ dimer equilibrium. J Mol Biol 266, 173–194.
36 Ikura M, Kay LE, Krinks M & Bax A (1991) Triple-
resonance multidimensional NMR study of calmodulin
complexed with the binding domain of skeletal muscle
myosin light-chain kinase: indication of a conforma-
tional change in the central helix. Biochemistry 30 ,
5498–5504.
37 Fallon JL & Quiocho FA (2003) A closed compact
structure of native Ca
2+
-calmodulin. Structure (Camb)
11, 1303–1307.
38 Clapperton JA, Martin SR, Smerdon SJ, Gamblin SJ &
Bayley PM (2002) Structure of the complex of calmodu-
lin with the target sequence of calmodulin-dependent
protein kinase I: studies of the kinase activation
mechanism. Biochemistry 41, 14669–14679.
39 Kurokawa H, Osawa M, Kurihara H, Katayama N,
Tokumitsu H, Swindells MB, Kainosho M & Ikura M
(2001) Target-induced conformational adaptation of cal-
modulin revealed by the crystal structure of a complex
with nematode Ca
2+
⁄ calmodulin-dependent kinase kin-
ase peptide. J Mol Biol 312, 59–68.
40 Aoyagi M, Arvai AS, Tainer JA & Getzoff ED (2003)
Structural basis for endothelial nitric oxide synthase
binding to calmodulin. EMBO J 22, 766–775.
41 Yamauchi E, Nakatsu T, Matsubara M, Kato H &
Taniguchi H (2003) Crystal structure of a MARCKS
peptide containing the calmodulin-binding domain in
complex with Ca
2+
-calmodulin. Nat Struct Biol 10,
226–231.
42 DeLano WL (2002) The PyMOL Molecular Graphics
System. Delano Scientific, San Carlos, CA, USA.
43 Owen DJ, Noble ME, Garman EF, Papageorgiou AC
& Johnson LN (1995) Two structures of the catalytic
domain of phosphorylase kinase: an active protein
kinase complexed with substrate analogue and product.
Structure 3, 467–482.
44 Lowe ED, Noble ME, Skamnaki VT, Oikonomakos
NG, Owen DJ & Johnson LN (1997) The crystal
structure of a phosphorylase kinase peptide substrate
complex: kinase substrate recognition. EMBO J 16,
6646–6658.
45 Gouet P, Courcelle E, Stuart DI & Metoz F (1999)
ESPript: analysis of multiple sequence alignments in
PostScript. Bioinformatics 15, 305–308.
Ca
2+
⁄ CaM in complex with the PhK5 peptide A. G. Cook et al.
1522 FEBS Journal 272 (2005) 1511–1522 ª 2005 FEBS