Tài liệu SMALL-SCALE ENERGY HARVESTING pptx
Bạn đang xem bản rút gọn của tài liệu. Xem và tải ngay bản đầy đủ của tài liệu tại đây (14.3 MB, 356 trang )
SMALL-SCALE
ENERGY HARVESTING
Edited by
Mickaël Lallart
SMALL-SCALE
ENERGY HARVESTING
Edited by Mickaël Lallart
Small-Scale Energy Harvesting
Edited by Mickaël Lallart
Contributors
Kai Ren, Yong X. Gan, Chris Gould, Noel Shammas, Hongying Zhu, Sébastien Pruvost,
Pierre-Jean Cottinet, Daniel Guyomar, Igor L. Baginsky, Edward G. Kostsov, S. Boisseau,
G. Despesse, B. Ahmed Seddik, Wen Jong Wu, Bor Shiun Lee, Yu-Jen Wang, Sheng-Chih Shen,
Chung-De Chen, Mickaël Lallart, Pierre-Jean Cottinet, Jean-Fabien Capsal, Laurent Lebrun,
Daniel Guyomar, Adam Wickenheiser, B. Ahmed Seddik, G. Despesse, S. Boisseau, E. Defay,
Cuong Phu Le, Einar Halvorsen, Ji-Tzuoh Lin, Barclay Lee, Bruce William Alphenaar, Marcus
Neubauer, Jens Twiefel, Henrik Westermann, Jörg Wallaschek, Yuan-Ping Liu, Dejan Vasic
Published by InTech
Janeza Trdine 9, 51000 Rijeka, Croatia
Copyright © 2012 InTech
All chapters are Open Access distributed under the Creative Commons Attribution 3.0 license,
which allows users to download, copy and build upon published articles even for commercial
purposes, as long as the author and publisher are properly credited, which ensures maximum
dissemination and a wider impact of our publications. After this work has been published by
InTech, authors have the right to republish it, in whole or part, in any publication of which they
are the author, and to make other personal use of the work. Any republication, referencing or
personal use of the work must explicitly identify the original source.
Notice
Statements and opinions expressed in the chapters are these of the individual contributors and
not necessarily those of the editors or publisher. No responsibility is accepted for the accuracy
of information contained in the published chapters. The publisher assumes no responsibility for
any damage or injury to persons or property arising out of the use of any materials,
instructions, methods or ideas contained in the book.
Publishing Process Manager Sandra Bakic
Typesetting InTech Prepress, Novi Sad
Cover InTech Design Team
First published October, 2012
Printed in Croatia
A free online edition of this book is available at www.intechopen.com
Additional hard copies can be obtained from
Small-Scale Energy Harvesting, Edited by Mickaël Lallart
p. cm.
ISBN 978-953-51-0826-9
Contents
Preface IX
Section 1 Photonic 1
Chapter 1 Advances in Photoelectrochemical Fuel Cell Research 3
Kai Ren and Yong X. Gan
Section 2 Thermal 27
Chapter 2 Three Dimensional TCAD Simulation
of a Thermoelectric Module Suitable for Use
in a Thermoelectric Energy Harvesting System 29
Chris Gould and Noel Shammas
Chapter 3 Thermal Energy Harvesting
Using Fluorinated Terpolymers 43
Hongying Zhu, Sébastien Pruvost,
Pierre-Jean Cottinet and Daniel Guyomar
Section 3 Vibrations: Conversion Mechanisms 59
Chapter 4 High Energy Density Capacitance Microgenerators 61
Igor L. Baginsky and Edward G. Kostsov
Chapter 5 Electrostatic Conversion for
Vibration Energy Harvesting 91
S. Boisseau, G. Despesse and B. Ahmed Seddik
Chapter 6 Piezoelectric MEMS Power Generators
for Vibration Energy Harvesting 135
Wen Jong Wu and Bor Shiun Lee
Chapter 7 Wideband Electromagnetic Energy
Harvesting from a Rotating Wheel 161
Yu-Jen Wang, Sheng-Chih Shen and Chung-De Chen
VI Contents
Chapter 8 Electrostrictive Polymers
for Vibration Energy Harvesting 183
Mickaël Lallart, Pierre-Jean Cottinet, Jean-Fabien Capsal,
Laurent Lebrun and Daniel Guyomar
Section 4 Vibrations: Techniques 209
Chapter 9 Analysis of Energy Harvesting Using Frequency
Up-Conversion by Analytic Approximations 211
Adam Wickenheiser
Chapter 10 Strategies for Wideband Mechanical Energy Harvester 235
B. Ahmed Seddik, G. Despesse, S. Boisseau and E. Defay
Chapter 11 Microscale Energy Harvesters
with Nonlinearities Due to Internal Impacts 265
Cuong Phu Le and Einar Halvorsen
Chapter 12 Non-Linear Energy Harvesting with
Random Noise and Multiple Harmonics 283
Ji-Tzuoh Lin, Barclay Lee and Bruce William Alphenaar
Chapter 13 Modeling Aspects of Nonlinear Energy Harvesting
for Increased Bandwidth 303
Marcus Neubauer, Jens Twiefel,
Henrik Westermann and Jörg Wallaschek
Chapter 14 Self-Powered Electronics
for Piezoelectric Energy Harvesting Devices 327
Yuan-Ping Liu and Dejan Vasic
Preface
The proliferation of low-power and ultralow-power electronics has enabled a rapid
growth of autonomous devices that ranges from consumer electronics and nomad
devices to autonomous sensors and sensor networks used in industrial and military
environments. Hence, a wide range of application domains has been impacted by such
technologies (aeronautic, civil engineering, biomedical engineering, home automation,
etc.). Although batteries have initially promoted the spreading of these autonomous
devices thanks to their relatively high energy capacity, they have become a break in
the development of such systems especially when dealing with “left-behind” (or
“place and forget”) sensors or when these apparatus are deployed in large number
(e.g., autonomous electrical switches). The main issues raised by primary batteries lie
in the associated maintenance problems for replacement caused by their limited
lifespan as well as environmental concerns as their recycling process is quite delicate.
Therefore, an alternative solution has to be found.
Over the last decade, both the scientific and industrial communities have been
interested in using ambient energy sources for supplying these low-power electronic
systems, leading to the concept of “energy harvesting” or “energy scavenging”, where
the power is directly delivered by microgenerators that are able to convert ambient
energy into electrical energy. Many sources from the near environment of the device
can be found, for instance vibrations, electromagnetic radiations, photonic radiations,
temperature gradients, heat fluctuations, and so on, and many conversion effects can
be used with each of the above mentioned sources (piezoelectricity, electromagnetism,
electrostatic, electrostriction, pyroelectricity, Seebeck effect…). However, dimension
constraints are a challenging concern and the design of efficient microgenerators able
to efficiently convert available energy from their environment and to provide enough
power to the circuit is still an open issue.
Hence, the purpose of this book is to provide an up-to-date view of latest research
advances in the design of efficient small-scale energy harvesters through contributions
of internationally recognized researchers. The book covers the physics of the energy
conversion, the elaboration of electroactive materials and their application to the
conception of a complete microgenerator, and is organized according to the input
energy source. Therefore, Section 1 covers the principles and application of energy
harvesting from photonic through the use of fuel cells. Section 2 deals with thermal
X Preface
energy harvesting, using either thermoelectric materials (Chapter 2) or dielectric
approach featuring electroactive polymers (Chapter 3). Finally, Section 3 exposes the
use of vibrations as energy input of the harvester. This section is subdivided into two
subsections, the first one being devoted to the available conversion mechanisms for
converting mechanical energy into electricity, using electrostatic coupling (Chapters 4-
5), piezoelectricity (Chapter 6), electromagnetism (Chapter 7) or electrostriction
(Chapter 8). The second part of this section aims at presenting new techniques for
efficiently harvesting mechanical energy, either by enlarging and/or matching the
frequency band (Chapter 9-13) or by artificially increasing the coupling between the
mechanical and electrical domains (Chapter 14), through the use of nonlinear
approaches.
I sincerely hope you will find this book as enjoyable to read as it was to edit, and that
it will help your research and/or give new ideas in the wide field of energy harvesting.
Finally, I would like to take the opportunity of writing this preface to thank all the
authors for their high quality contributions, as well as the InTech publishing team (and
especially the book manager, Ms. Silvia Vlase) for their outstanding support.
Dr. Mickaël Lallart
Laboratoire de Génie Electrique et Ferroélectricité, LGEF,
INSA Lyon,
France
Section 1
Photonic
Chapter 1
Advances in Photoelectrochemical
Fuel Cell Research
Kai Ren and Yong X. Gan
Additional information is available at the end of the chapter
1. Introduction
Fuel cells are electrochemical devices which can convert chemical energy into electrical
power. They have the advantages of quiet in operation, high efficiency and low pollutant
emissions. Photoelectrochemical fuel cells (PEFCs or PECs) are special fuel cells. PEFCs are
used in organic waste degradation (Patsoura A et al., 2006), solar energy utilization (Bak T et
al., 2002), gaseous product decomposition (Ollis DF et al., 2000), aqueous pollutants removal
(Sakthivel S et al., 2004) and photocatalytic sterilization (Fujishima A et al., 1972). A PEFC or
PFC consumes fuels and utilizes luminous energy to generate electricity power when the
photoanode is excited by radiation. (Lianos P et al., 2010).
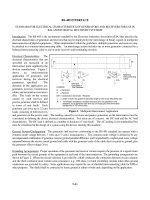
Fig. 1 shows a typical two-compartment photo fuel cell separated by a silica frit
(Antoniadou M et al., 2010). The electrolyte is NaOH. The anode is nanocrystalline titania.
The cathode is a carbon black deposited with Pt as the catalyst. This device works under UV
irradiation. The open circuit voltage was 0.88V without ethanol and 1.22 V with ethanol.
2. Mechanisms of Photoelectrochemical Fuel Cells (PEFCs)
PEFCs normally consist of a semiconductor photoanode, metal cathode and electrolyte
which could be an acid, base or just water. Light excites electrons at the photoanode if the
light energy is larger than the material energy band gap. The photoanode generates
electrons (e
-
) and holes (h
+
). At the anode, production of oxygen happens. Hydrogen
generates at the water/cathode interface. The reactions are shown as follows (Chang C et al.,
2012):
Light energy: 2hv→2h
+
+ 2 e
-
(1)
At anode: 2 h
+
+ H
2
O → 1/2 O
2
+ 2H
+
(2)
Small-Scale Energy Harvesting
4
At cathode: 2 e
-
+2 H
+
→ H
2
(3)
Overall reaction: 2 hv + H
2
O → 1/2 O
2
+ H
2
(4)
Figure 1. The sketch of a two-compartment PEFC. (Antoniadou M et al., 2010).
3. Photoanode materials
Fig. 2 shows light absorption and electron transport on a photo sensitive material. The light
energy is absorbed by the photo sensitive material. Electrons and holes generate. The
electrons flow to cathode. The holes decompose water to produce oxygen. Nanostructured
materials may be added to substrates such as Ti, glass, copper etc.
Figure 2. Schematic of a typical nanostructured photoanode. (Chakrapani V et al., 2009)
Advances in Photoelectrochemical Fuel Cell Research
5
Figure 3. Some types of photoelectrode (PE) commonly used. (Minggu L et al., 2010).
Semiconductor is widely used as photoelectrode which including n-type (TiO2), p-type (lnP)
and n-p type (n-GaAs/p-InP). They can be combined together to form multi-layered
structures to tune the band gaps (Minggu L et al., 2010). In Fig. 3, SC stands for a
semiconductor and M stands for a metal which is usually used as a substrate. Nanoporous
materials are widely used in fuel cells. There are a number of transparent conductive oxides
(TCOs) used as photoanode materials including indium-tin-oxide and fluorine-doped tin
oxide. Some non-transparent conductive oxides (NTCOs) including nanocrystalline titania
TiO
2, n-type semiconductor ZnO, Fe2O3, SrTiO3 etc. can also be used as photoanode
materials. Among them, TiO
2 is the most commonly used one due to its stability and high
photo activity.
Fig. 4 shows the design of photoelectrode (Miller EL et al., 2003). Fig. 4a shows the first stage
of design using p-type silicon. The catalyst layer is on the left side and the platinum catalyst
is deposited on the right side. The arrow indicates the direction of light illumination. In Fig.
4b, the right side is coated with a Shottky barrier metal. Fig. 4c illustrates a three-junction
structure consisting of Si-Ge-glass. The photo-hydrogen conversion efficiency is up to 7.8%.
This design needs an external connection. Fig. 4d has no external connection, as compared
with Fig. 4c. Fig. 4e is the latest integrated planar photoelectrode design. On the right side,
there is a highly transparent and corrosion-resistant film to keep the high efficiency. This
new design can connect single cells in series, which can generate large power.
Small-Scale Energy Harvesting
6
Figure 4. Photoelectrode designs. (Miller EL et al., 2003).
TiO
2
is an effective photocatalysis (PC). It is often used as the anode of PFC (Gratzel M et al.,
2001). The reaction of TiO
2
under UV illumination is follows (Park KW et al., 2007):
TiO
2
+ hv(UV) → TiO
2
+ e
-
+ h
+
(5)
This formula is applicable for any metal oxide as the anode in a photo fuel cell. When the
metal oxide absorbs photons from any light sources, electron-hole pairs are produced. The
photo-generated holes react with fuels.
4. Fuels
There are many types of fuels for PECs including pure water, alcohols (MeOH, EtOH,
PrOH), polyols (glycerol, xylitol, sorbito, glucose, fructose, lactose), organic pollutants (urea,
ammonia, triton X-100, SDS, CTAB). Alcohols have larger efficiencies than others do
(Antoniadou M et al., 2009). In polyols, glycerol has the highest current density. Pure water
has the lowest efficiency. Fuels are decomposed in the ways as described below.
Advances in Photoelectrochemical Fuel Cell Research
7
Methanol (Lianos P, 2010):
Anode electrode in acidic media:
CH
OH+2h
→CH
O
·
+2H
(6)
CH
O
·
→CH
O
·
+H
(7)
CH
O
·
→CH
O+e
(8)
Anode electrode in base media:
6OH
+6h
→6OH
·
(9)
CH
OH+6OH
·
→CO
+5H
O (10)
Under the photo illumination, PFC absorbs light energy and the TiO
2 is excited to release
electrons. By this method, higher electric potential can be generated compared with other
fuel cells. The completely reaction of TiO
2 with methanol’s shown as:
TiO
(
UV
)
+CH
OH+6H
O→TiO
+CO
+6e
+6H
(11)
Ethanol:
The completely reaction of TiO
2 with ethanol is as follows:
TiO
(
UV
)
+C
H
OH+3H
O→TiO
+2CO
+12e
+12H
(12)
Reber JF et al., (1984) stated that a common formula could be:
C
H
O
+
(
2x−z
)
H
O→xCO
+(2x−z+
)H
(13)
Several types of biomass used in fuel cells are reported by Kaneko M et al., (2006), and shown
in Table 1. The experimental condition is in acid solutions contain 0.1M Na2SO4. The anode of
PEC is TiO
2 nanoporous film and the cathode is Pt black on Pt foil. The light intensity is 503
mW/cm
2
and ambient temperature is 25 °C. The results of open circuit voltage show that
acetic acid is the best. Ammonia, glycine, phenylalanine and glutamic acid also show good
performances. The short circuit current of methanol has the highest value. The fill factor (FF)
as defined by the ratio of maximum obtainable power to the product of the open circuit
voltage and short circuit current was calculated. Ammonia has the maximum FF of 0.63.
Liu Y et al., (2011), did similar research on various fuels with a self-organized TiO
2 nanotube
array (STNA) as the photoanode of the photo fuel cell (Table 2). Multiply fuels were tested
but each fuel’s concentration was smaller than what Kaneko et al. used. By comparing the
data in these two tables, we can see that the open circuit voltage and short circuit current
obtained by Liu et al. are slightly larger, which means that they got higher efficiencies from
the PFC system they built. When they varied the concentration of Na
2SO4 from 0 to 0.5M, Voc
and J
sc reached the peak values at 0.1 M and the FF has the maximum value at 0.05 M. All
the experiments were done under solar light illumination.
Small-Scale Energy Harvesting
8
Fuel (conc./M) Solvent (pH) Voc/V
J
sc/ mA cm
-2
FF
Methanol
None 0.54 0.8 0.23
Methanol (50 vol.%)
Water (not controlled) 0.44 0.76 0.28
Ethanol
None 0.49 0.52 0.25
Glucose (0.5)
Water (5) 0.64 0.5 0.32
Urea (5)
Water (5) 0.6 0.3 0.26
Ammonia (10)
Water (12) 0.84 0.53 0.63
Acetic acid (2 wt.%)
Water (not controlled) 0.94 0.47 0.37
Glycine (0.5)
Water (5) 0.76 0.45 0.45
Glutamic acid (0.5)
Water (1) 0.9 0.64 0.42
Tyrosine (0.5)
Water (13) 0.86 0.43 0.36
Phenylalanine (0.5)
Water (13) 0.9 0.61 0.53
Agarose (0.2 wt.%)
Water (5) 0.6 0.12 0.26
Gelatin (2 wt.%)
Water (1) 0.64 0.23 0.32
Collagen (3 mg/ml)
Water (l) 0.62 0.16 0.34
Cellulose sulfate (2 wt.%)
Water (not controlled) 0.56 0.29 0.34
Lignosulfonic acid (0.5 wt.%)
Water (not controlled) 0.57 0.02 0.51
Polyethylene glycol (2 wt.%)
Water (5) 0.6 0.28 0.27
Poly(acrylamide) (2 wt.%)
Water (5) 0.6 0.23 0.24
Table 1. PFC performances by using different fuels in 0.1M Na2SO4 with a TiO2 photoanode and Pt/Pt
black cathode. (Kaneko M et al., 2006).
Organic compounds Voc (V)
J
sc
(mA cm
-2
)
J
vmax
(mW cm
-2
)
FF
Model
compound
Na2SO4 (0.1 mol/L) 1.13 0.35 0.12 0.31
Glucose (0.05 mol/L) 1.28 0.83 0.38 0.36
Glutamic acid (0.05 mol/L) 1.34 1.08 0.51 0.35
Nicotinic acid (0.05 mol/L) 1.39 0.61 0.3 0.35
Acetic acid (0.05 mol/L) 1.48 1.42 0.67 0.32
Urea (0.05 mol/L) 1.41 0.91 0.51 0.4
Ammonia (0.05 mol/L) 1.24 0.72 0.37 0.41
Actual
wastewater
Pharmaceutical wastewater
(COD =24572 mg/L)
0.88 1.36 0.43 0.36
Petroleum exploiting wastewater
(COD =19087 mg/L)
1.34 0.98 0.34 0.26
Dying wastewater
(COD =10842 mg/L)
1.53 1.21 0.5 0.27
Chemical plant wastewater
(COD =11700 mg/L)
1.11 0.99 0.3 0.27
Original urine solution
(COD =9642mg/L)
0.93 0.61 0.19 0.34
Table 2. PFC performances by using different fuels. (Liu Y et al., 2011).
Advances in Photoelectrochemical Fuel Cell Research
9
5. Cathode materials
As compared with multiple choices of photoanodes, the materials for the cathode of photo
fuel cells are limited. Normally a Pt wire or a Pt foil is used. Another option is to use Pt-
black. The Pt black powders can be cast, sprayed or hot-pressed on the surface of a Pt
(Kaneko M et al., 2006). The surface area becomes larger when the Pt-black powers were
deposited onto Pt wires or foils. In addition to platinum cathodes including platinum wire,
non-platinized platinum foil, platinized platinum foil, platinized SnO
2
with F, metal
nanoparticles deposited on a TiO
2
/SnO
2
with F doping are made into electrodes.
Pt/TiO
2
/SnO
2
, Pd/TiO
2
/SnO
2
, Au/TiO
2
/SnO
2
, Ag/TiO
2
/SnO
2
, and Ni/TiO
2
/SnO
2
) are some of
the examples. A platinum-loaded carbon cloth has also been used as a cathode material. The
platinized SnO
2
with F electrode has better performance than others. It speaks current,
voltage and efficiency are 1.15 mA/cm
2
, 1340 mV and 12.3%, respectively. The platinum-
loaded carbon cloth has the maximum efficiency of 32.3%. Thin layer of Si-H film photo
cathode can be made by plasma assisted chemical vapor deposition (PECVD). A Si-H
cathode deposited organic or inorganic protective layer or coating with catalytic platinum
can enhance the stability for long time use. The best thickness of the polymer protective
layer is 5 nm. The optimized thickness of Pt coating is 2 nm.
CuO is a cheap material. CuO nanoparticles and films prepared by flame spray pyrolysis
(FSP) were used as photocathodes by Chiang C et al., (2011). The optical band gap was
decreased from 1.68 eV to 1.44 eV with the annealing temperature increasing from room
temperature to 600°C. The nanoparticle size is from 50 nm to 150 nm, as shown in Fig. 5. The
best photocurrent density is 1.2 mA/cm
2
obtained from CuO particles which were annealed
at 600 °C for 3 hour. The bias voltage is 0.55 V in 1M KOH. The total conversion efficiency is
1.48% and the hydrogen generation efficiency is 0.91%.
Figure 5. SEM images of CuO photo cathodes prepared under different conditions: (a) 450 °C, 1 h, (b)
450 °C, 3 h, (c) 600 °C, 1 h, (d) 600 °C, 3 h. (Chang C et al., 2011).
Small-Scale Energy Harvesting
10
6. Terminologies associated with the photo fuel cells
6.1. Optical absorption coefficient for band gap determination
The optical absorption coefficient, α, is related to the wavelength, transmittance, reflectance
of the light illuminating on a material. Low absorption coefficient means low photo
absorption ability. The following equation holds (Pihosh Y et al., 2009)
(
ℎ
)
=
ln(
) (14)
where T is the transmittance, R the reflectance, and d the thickness of the material. The term
h refers to the photon energy.
The optical coefficient is used to obtain the band gap E
g following
×(ℎ−
)
=
(
ℎ
)
×
(
ℎ
)
(15)
6.2. Roughness factor
Roughness factor is related to the surface area of an electrode. For nanotubes, the geometry
roughness is calculated as (Shankar K et al., 2007)
=
()
()
(16)
where D is the inner diameter, W the wall thickness and L the tube length of the nanotubes.
From the experiment on titania nanotubes by Isimjan TT et al., (2012), a higher surface area
(roughness) was obtained at higher processing voltages. At a constant voltage, the pore size
of nanotubes is dependent of distance between anode and cathode in the electrochemical
process.
6.3. Photo conversion efficiency
The photo conversion efficiency is the overall efficiency of a PEC which can be defined by
the following equation
(
%
)
=
(
)
×100 (17)
7. Nanostructures photoanode materials processing
7.1. TiO2 nanotube (TNT) photoanode
TiO2 nanotubes on the surface of Ti as shown in Fig. 6 demonstrate a self-organized
nanostructure. The advantage of the nanobutes is the high surface/volume ratio. TiO
2
nanotubes have active photo catalysis characteristic, good corrosion resistance, thermal
stability and good operation stability as described by Mahajan V et al., (2008). TiO
2
nanotubes can be made by various ways including hydro/solvothermal method (Kasuga T et
Advances in Photoelectrochemical Fuel Cell Research
11
al., 1998), template-assisted approach (carbon nanotube, alumina or monocrystal as the
template), sol–gel method (Kasuga T et al., 1998), microwave irradiation (Zhao Q et al.,
2009), and direct electrochemical anodization. The advantage of the hydro/solvothermal
method is easy to operate. The disadvantage is that only disordered and twisted TiO
2
nanotubes can be obtained. For the template-assisted method, the size of the nanobutes is
uniform. For the electrochemical anodic oxidation method, it has the advantage of easy to
operate and the obtained nanotubes are highly ordered. Therefore, many researchers prefer
the electrochemical method.
Figure 6. Self-organized TiO
2
nanotubes via anodization. (Shankar K et al., 2007).
7.1.1. Hydrothermal treatment
Hydrothermal method is one of the popular approaches to prepare TNTs. The first group
having successfully fabricated TiO
2
nanotubes by hydrothermal method is Kasuga T et al.,
in 1998. During the process, titania nanopowders are placed in alkaline aqueous solutions
held in high pressure steel vessels. The temperate should be between 50-180 °C. The process
Small-Scale Energy Harvesting
12
continues for 10 to 20 hours. Some post treatment can be applied, for example, washing with
acid or alkaline solutions for 10 hours, drying at 80 °C and annealing at 500 °C. The reaction
process is divided into four steps (Hafez H et al., 2009) i.e. (1) synthesis of TiO
2
nanotubes in
alkaline aqueous solutions, (2) protons replacing alkali ions in the reaction, (3) drying, (4)
acid washing (post treatment). There is controversy about the necessity of the acid washing.
Some researchers (Liu S et al., 2009) think acid washing is a necessary procedure to form
TNTs, but other researchers (Chen X et al., 2007) think hydrothermal is more important than
the acid washing step as sketched in Fig. 7. The step of washing by acid is not even
necessary to form TNTs.
Figure 7. Hydrothermal method for fabricating TiO
2
nanotubes (Chen XB et al., 2007).
7.1.2. The effects factors of material and solution
With different raw materials and reaction solutions, the different morphology of TiO
2
was
obtained by hydrothermal method (Yuan ZY et al., 2004). When crystalline TiO
2
react with
NaOH under 100-160 °C, the TiO
2
nanotubes was obtained. When amorphous TiO
2
be used
under same conditions, the TiO
2
nanofibers are fabricated. Either crystalline or amorphous
TiO
2
can be used reaction with NaOH can result TiO
2
nanoribbons when temperature rise to
180 °C. If the solution used by KOH, the nanowires morphology is formed. The pH value of
solution also plays an important role in morphology of TiO
2
nanomaterials (Xu YM et al.,
2010). Fen LB et al., (2011) used anatase TiO
2
nanopowders (Aldrich 637254-50G, 99.7%)
with NaOH solution fabricated TNTs. The inner diameter is 3-6 nm and wall thickness is 1.9
nm. Lan Y et al., (2005) used rutile nanopowders with 10 M NaOH solution obtained TNTs
which inner diameter 2-3 nm and wall thickness is 7-8 nm, besides the length is 200-300 nm.
The inner diameter is smaller but the wall thickness is larger than the TNTs made by Fen LB
et al., (2011).
Hydrothermal treatment temperature and time are significant factors during the formation
of TNTs. The temperature range should be from 100 °C to 180 °C and the time range should
be from 1 to 24 hours. Sreekantan S et al., (2010), selected the temperatures at 90, 110, 130,
150 °C and time for 3, 6, 9, 15, 18, 24 hours. The NaOH/TiO
2
solution was used. At 90 °C, the
TiO
2
particles form sheets. When the temperature was set at 110 °C, the sheets were
transformed into nanotubes because the thermal energy increases with temperature (Seo HK
Advances in Photoelectrochemical Fuel Cell Research
13
et al., 2008). With the temperature increasing to 130, 150 °C, there is no change of the outer
diameter (10 nm) of nanotubes but the TNTs transform to anatase phase. For the effect of
reaction time, particles begin to form sheet at 3 hours. Sreekantan S et al., (2010) indicated
that Ti-O-Ti bond is replaced by Ti–O–Na and Ti–OH bonds at this time. After 6 and 9
hours, more and more sheets form nanotubes (10 nm). After 15 hours, TNTs form
completely. They found that 150 °C is the best temperature for making TNTs with the
highest photocatalytic activity.
Seo HK et al., (2008), studied the phase transformation of TNTs at different hydrothermal
temperatures. They used a 10 M NaOH solution and the temperature range was from 70 °C
to 150 °C. A 0.1 M HCl solution was used for washing the TNTs. They founded that at 70 °C,
the particles begun forming nanosheets. Nanosheets and nanofibers co-existed at 90 °C. At
110 °C, the nanosheets were transformed into nanotubes. This conclusion is also reported by
Sreekantan S et al., (2009). Hydrothermal processing can also produce nanoribbons instead
of nanotubes if the reaction temperature is higher than 180 °C.
7.2. Synthesis of self-organized TiO2 nanotubes via electrochemical anodization
In 1999, Zwilling V et al. first used electrochemical anodization method for synthesis of TiO
2
nanotubes in the solution containing chromic acid and hydrofluoric acid. Later many
researchers (e.g. Macak JM et al., 2005) showed that using different applied potentials,
electrolytes, pH values (much longer nanotubes at neutral pH electrolytes) and anodization
time can control the lengths, thickness, diameters and morphology of TiO
2
nanotubes. Zeng
X et al., (2011), reported electrochemical oxidation of Ti in a 1.0 M H
3
PO
4
and 0.25 M NaF
solution. With the increasing in the potential, TiO
2
experienced three forms. When the
potential was very low, Ti dissolved into the solution. With the increasing of potential, Ti
was oxidized to form TiO
2
. When the potential was less than 2.5 V, TiO
2
film was obtained.
Between 2.5 V and 6.0 V, the TiO
2
porous structure formed. When potential was higher than
6, the self-organized TiO
2
nanotubes were obtained (Fig. 9b).
Figure 8. Morphology of self-organized anodic TiO
2
nanotubes formed at different temperature and
voltage levels. (Liu H et al., 2011).
Small-Scale Energy Harvesting
14
Figure 9. (a) Sketches for electrochemical oxidation of Ti. (b) effectof voltage level on the morphology of
TiO
2
. (Zeng X et al., 2011).
Before 2005, all of these researches were exclusively using inorganic solutions as
electrolytes, such as HF (Varghese OK et al., 2003), KF, NaF (Cai QY et al., 2005). Macak JM
et al., (2005), investigated TiO
2
nanotube formation in Na
2
SO
4
electrolytes with NaF. The
maximum length of nanotubes was up to 2.4 µm. It takes about 6 hours. But longer than this
time, the irregular morphology showed up. As compared with HF, NaF can thicker the
porous layers. The use of organic electrolytes is a milestone for the TiO
2
nanotubes
fabrication. Liu H et al., (2011), studied the temperature effect on morphology of TiO
2
nanotubes. The specified temperatures are -5, 0, 5, 10, 15 °C and the applied potentials are
10, 30, 50V. It helped control the nanotube size and structure under the complex condition
as show in Fig. 8. In summary, there are two types of electrolytes in TiO
2
andoization, one is
aqueous-based electrolytes, and the other is organics-based electrolytes. Aqueous
electrolytes allow the nanotubes to form more quickly because of the low electrical
resistance. Besides, lower voltage is enough. However, it is hard to form longer nanotubes
because of the dissolution of the nanotubes in the solutions. The organic electrolytes, for
example, ethylene glycol and glycerol, have higher electrical resistances. They can slow
down the ion transfer. Therefore, higher voltages and longer times are needed. In organic
electrolytes, it is easier to form long nanotubes.
7.2.1. Anodization mechanisms
During anodization, a constant voltage in the range from 1V to 150V is applied. The
electrolytes containing fluorides have the concentration range from 0.05 to 0.5M. The
processing time ranges from a few minutes to a couple of days.
There are two main reactions with the anodization of Ti (Macak JM et al., 2005):
Ti
+2H
O→TiO
+4H
(18)
Advances in Photoelectrochemical Fuel Cell Research
15
TiO
+6F
+4H
→TiF
+2H
O(19)
Figure 10. Sketches of Ti anodization (a) without F
-
, (b) with F
-
. (Macak JM et al., 2007).
First, titanium in the electrolyte produces Ti
4+
. Then Ti
4+
reacts with water to form TiO
2
and
hydrogen ion (Eq. 18). TiO
2
becomes oxide film on the surface of the titanium as a barrier
layer. Meantime, TiO
2
is etched by F
-
and many holes form in the film (Eq. 19). With the
processing time increasing, the holes become deeper and form nanotubes. When the
anodization rate of Ti is equal to the etching rate of TiO
2
, the process reaches to a steady-
state. The length of nanotubes keeps unchanged.
F ion plays an important role in synthesizing TiO
2
nanotubes. Fig. 10 shows the results of
NTs obtained from different solutions with and without F
-
. Without F
-
the TiO
2
is flat
without porous structure. With F
-
, reaction (Eq.19) occurs. F ion generates TiF
6
2-
which is the
driving force of etching TiO
2
. H
+
can enhance the etching ability of F
-
. TiF
6
2-
ions owing the
small diameter can easily move through TiO
2
crystal lattice. Comparing the electrolytes
containing Cl
-
and Br
-
(Chen X et al., 2007), TiO
2
nanotubes arrays fabricated in electrolytes
containing F
-
have better quality. Fluoride concentration can affect the electrochemical
characteristics (Beranek R et al., 2003). If the fluoride concentration is low (less than 0.05 wt.
%), there are almost no fluoride ions. If the fluoride concentration is high (1 wt. %), no oxide
formation can be observed.Ti
4+
reacts with F
-
immediately to form TiF
6
2-
. The maximum
nanotube length is about 500 nm synthesized in HF electrolytes. The maximum length is
several micron meters using NaF and NH
4
F electrolytes.
Figure 11. Self-organization of TiO
2
nanotubes in F
-
containing solutions. (Gan Y et al., 2011).