Thermal methods in petroleum analysis
Bạn đang xem bản rút gọn của tài liệu. Xem và tải ngay bản đầy đủ của tài liệu tại đây (18.39 MB, 524 trang )
www.pdfgrip.com
Thermal Methods in Petroleum Analysis
by. Heinz Kopsch
CopyrightoVCH Verlagsgesellschaft mbH, 1995
Heinz Kopsch
Thermal Methods
in Petroleum Analysis
www.pdfgrip.com
0VCH VerlagsgesellschaftmbH, D-69451 Weinheim, Federal Republic of Germany, 1995
Distribution:
VCH, PO. Box 10 1161, D-69451 Weinheim,Federal Republic of Germany
Switzerland:VCH, PO. Box, CH-4020 Basel, Switzerland
United Kingdom and Ireland: VCH, 8 Wellington Court, Cambridge CB1 lHZ, United Kingdom
USA and Canada: VCH, 220 East 23rd Street, New York, NY 10010-4606,USA
Japan: VCH, E k o w Building, 10-9 Hongo 1-chome,Bunkyo-ku,Tokyo 113,Japan
ISBN 3-527-28740-X
www.pdfgrip.com
Heinz Kopsch
Thermal Methods
in Petroleum Analysis
4b
VCH
Weinheim . New York . Base1 - Cambridge - Tokyo
www.pdfgrip.com
Dr. rer. nat. Heinz Kopsch
Institut fur Technische Chemie
T.U. Clausthal
ErzstraBe 18
D-38678 Clausthal-Zellerfeld
Germany
This book was carefully produced. Nevertheless, the author and publisher do not warrant the information
contained therein to be free of errors. Readers are advised to keep in mind that statements, data,
illustrations,procedural details or other items may inadvertently be inaccurate.
Published jointly by
VCH Verlagsgesellschaft mbH, Weinheim (Federal Republic of Germany)
VCH Publishers, Inc., New York, NY (USA)
Editorial Director: Dr. Barbara Bijck
Production Manager: Peter J. Biel
The cover photo shows a view of part of the BASF steamcracker in Antwerp.
(Courtesy of BASF Aktiengesellschaft Ludwigshafen,Germany)
Library of Congress Card No. applied for
British Library Cataloguing-in-PublicationData:
A catalogue record for this book is available from the British Library
Die Deutsche Bibliothek - CIP-Einheitsaufnahme
Kopsch, He&
Thermal methods in petroleum analysis / Heinz Kopsch. Weinheim ; New York ; Base1 ; Cambridge ;Tokyo : VCH, 1995
ISBN 3-527-28740-X
0VCH Verlagsgesellschaft mbH, D-69451 Weinheim, Federal Republic of Germany, 1995
Printed on acid-free and low-chlorine paper
All rights reserved (including those of translation into other languages). No part of this book may be reproduced
in any form - by photoprinting, microfilm, or any other means - nor transmitted or translated into a machine
language without written permission from the publishers. Registered names, trademarks, etc. used in this book,
even when not specifically marked as such, are not to be considered unprotected by law.
Composition:Graph. Werkstatten Lehne GmbH, D-41516 Grevenbroich
Printing and Bookbinding: Paderborner Druck Centrum. D-33100 Paderborn
Printed in the Federal Republic of Germany
www.pdfgrip.com
Preface
The monograph Thermal Methods in Petroleum Analysis is based mainly on results of
more than twelve years research work on the application of thermoanalytical methods to
petroleum and its products during the activities of the author at the German Institute for
Petroleum Research. It was very interesting to research the application of well defined
physical methods, such as thermogravimetry and differential scanning calorimetry, to the
multicomponent systems of petroleum and its products, and to understand the limits of
those methods on the one hand and the excellent transferability of the results to technical
processes on the other. The diversity of possible applications of thermoanalytical methods
to various problems in the petroleum laboratory can only be indicated in this monograph.
Many people supported my work, either by active or by indirect help. Thanks are
expressed to Mrs. Elvira Falkenhagen, who has been a skilful and reliable assistant for
many years, as well as to Dr.-Ing. Maria Nagel, Dr.-Ing. Ulrike Tietz, Mrs. Liliane
Varoscic, Mrs. Regina Bosse, Mrs. Gerda Sopalla, and the late Mrs. Heidi Gottschalck. An
acknowledgement should be made to the directors of the German Institute for Petroleum
Research: Professor Dr. H. H. Oelert, Professor Dr. H.-J. Neumann, and Professor Dr. D.
Kessel who granted me maximum independent research capacity. Some parts of the
research work were carried out with financial support from the German Association for
Research CD (Deutsche Forschungsgemeinschaft). For several years successful and pleasant cooperation was established with colleagues of the University of Belgrade, especially
with Professor Dr. D. Skala, Professor Dr. M. Sokic, and Professor Dr. J. A. Jovanovic.
Thanks are also expressed to those whose names do not appear in this list. All the
companies which supplied me with information as well as with illustrations are likewise
acknowledged; their names may be found in the appendix.
I hope that this monograph will be of some help to colleagues in both academic and
industrial research establishments and will encourage them towards further attempts in the
application of thermal methods of analysis, even to chemically non-defined multicomponent systems. The examples presented might represent a stimulation for further experimental work.
Heinz Kopsch
Oktober 1995
www.pdfgrip.com
Contents
1
1
Introduction
2
Methods and instrumentation 3
3
3.1
3.1.1
3.1.2
3.1.3
3.1.4
3.1.5
3.2
3.2.1
3.2.2
3.3
3.3.1
3.3.1.1
3.3.1.2
3.3.1.3
3.3.1.4
3.3.2
3.3.2.1
3.3.2.2
3.3.3
3.3.4
3.3.5
3.3.6
Thermal analysis on model substances 15
Thermogravimetry (TGA) 15
Thermogravimetry in an inert atmosphere 15
Simulated distillation 28
Thermogravimetry in an oxidizing atmosphere 38
Isothermal thermogravimetry 45
Experiments using the simultaneous thermal analyzer 47
Differential scanning calorimetry on model substances 54
DSC in an inert atmosphere 54
DSC in an oxidizing atmosphere 63
Reaction kinetics 68
Theoretical basis 68
Method according to ASTM E 698-79 69
Method according to Borchardt and Daniels 70
Method according to Flynn and Wall 72
Method according to McCarthy and Green 74
Kinetic investigations on model substances 75
DSC experiments according to ASTM E 698-79 heat of vaporization of n-alkanes 75
Pyrolysis kinetics according to ASTM E 698-79 82
DSC oxidation kinetics according to ASTM E 698-79 84
Kinetics according to Borchardt and Daniels 89
TGA kinetics according to Flynn and Wall 90
TGA kinetics according to McCarty and Green 94
4
4.1
4.2
4.2.1
4.2.2
4.2.2.1
Thermoanalytical investigations on petroleum und petroleumproducts 97
Crude oils (degasified crudes) 99
Refinery residues 111
Description and characterization of the samples 112
Implementation and evaluation of tests 118
Deviations in thermogravimetry 119
www.pdfgrip.com
VIII
Contents
Thermogravimetry in an inert atmosphere 123
Directly measured index numbers 131
Derived index numbers 136
Simulated distillation 137
Directly measured index numbers in comparison with the simulated distillation 143
4.2.3.5 Derived index numbers for pracital application 144
4.2.4
Thermogravimetry in air 147
4.2.4.1 Directly measured index numbers 155
4.2.5
Correlations of analytical data with index numbers from thermogravimetry 160
4.2.6
Simulated thermal cracking by TGA 162
4.2.6.1 Index numbers from simulated cracking 164
4.2.6.2 Correlation of index numbers from simulated cracking with analytical data 165
4.2.7
Start temperature of the cracking process in an inert atmosphere 166
4.2.8
Differental scanning calorimetry (DSC) 167
4.2.8.1 Experiments in argon at atmospheric pressure 167
4.2.8.2 Experiments in methane at 10 bar pressure 171
4.2.8.2.1 Reaction enthalpy from tests at 10 bar pressure 174
4.2.8.3 Start temperatures of the cracking process at different pressures 175
4.2.8.4 Correlation of kinetic parameters with analytical data 176
4.2.9
Conclusions from experiments on refinery residues 181
4.2.9.1 Thermogravimetry 181
4.2.9.2 Reaction kinetics 184
4.2.9.3 Correlation of data from thermoanalysis with analytical data 186
4.3
Investigations on bitumen 187
4.3.1
Description and characterization of the samples 189
4.3.2
Thermoanalytical investigations 195
4.3.2.1 Thermogravirnetry in inert gas 195
4.3.2.1.1 Correlation of index number from thermogravimetry with consistency data 202
4.3.2.1.2 Correlation index numbers with analysis data 21 1
4.3.2.2
Thermogravimetry in air 217
4.3.3
Isothermal aging tests by thermogravimetry 225
4.3.4
Differential scanning calorimetry (DSC) 233
4.3.4.1 Test in argon at atmospheric pressure 233
4.3.4.2 Tests in methane at 10 bar pressure 237
4.3.4.3 Tempratures of the cracking process 243
4.3.4.4 Oxidation in air 247
4.3.5
Low temperature behavior of bitumen 258
4.3.6
Conclusions from experiments on bitumen 258
4.3.6.1 Thermogravimetry 258
4.3.6.2 Reaction kinetics 261
4.2.3
4.2.3.1
4.2.3.2
4.2.3.3
4.2.3.4
www.pdfgrip.com
Contents
IX
Investigations on polymer modified bitumens (PMB) 265
Description and characterization of the samples 265
Thermogravimetry 269
Dynamic (temperature-programed) thermogravimetry 269
Isothermal gravimetq 275
Reaction kinetics using DSC 283
Low temperature behaviour of PMB using DSC 285
Aging properties of polymers for the modification of bitumen 287
Investigation on the hydrocracking reaction of heavy residues 296
Investigation on a vacuum residue from Kirkuk 297
Investigation on residues of different origins 304
Oil shale and shale oil 321
Investigation using TGA and DSC 322
Modelling and simulation of oil shale pyrolysis 331
Fingerprinting of oil shale by oxidation 345
Lubricants 348
Evaporation behavior of lubrication oils 349
Oxidation behavior of lubrication oils 358
Comparison of the oxidation stability of virgin oils, reclaimed oils, and synthetic lubrication oils 365
4.8
Silicone oils 376
4.9
Relation of the kinetics of pyrolysis and oxidation reactions to the system
pressure: Investigations on tertiary oil recovery by in situ combustion 400
4.9.1
Pyrolysis tests 405
4.9.2
Oxidation tests 410
4.9.2.1
Range of low temperature oxidation (LTO) 412
4.9.2.2 Range of fuel deposition 415
4.9.2.3 Range of fuel combustion 421
4.9.3
Discussion 424
4.10
Comparison of commercial computer programs for investigation of kinetics of
pyrolysis and oxidation reactions of heavy petroleum products 427
4.10.1
Pyrolysis reaction 429
4.10.1.1 Kinetics according to ASTM E 698-79 429
4.10.1.1.1 DSC (DTA) experiments 429
4.10.1.1.2 Kinetics according to ASTM E 698-79 from simultaneous TGA/DTA experiments 439
4.10.1.2 Kinetics according to Borchardt and Daniels 440
4.10.1.3 Kinetics according to Flynn and Wall 442
4.10.1.4 Kinetics according to McCarty and Green 453
4.10.2
Oxidation reaction 458
4.10.2.1 Kinetics according to ASTM E 698-79 460
4.10.2.1.1 DSC (DTA) experiments 460
4.10.2.1.2 Experiments using Simultaneous Thermal Analyzer 467
4.10.2.2 Kinetics according to Borchardt and Daniels 468
4.4
4.4.1
4.4.2
4.4.2.1
4.4.2.2
4.4.3
4.4.4
4.4.5
4.5
4.5.1
4.5.2
4.6
4.6.1
4.6.2
4.6.3
4.7
4.7.1
4.7.2
4.7.3
www.pdfgrip.com
X
Contents
4.10.2.3 Kinetics according to Flynn and Wall 469
4.10.2.4 Kinetics according to McCarty and Green 473
4.10.3
Conclusions 477
5
5.1
5.2
Final consideration 485
Other applications 485
Summary on progress of instrumentation (hard and software) and advice 487
6
Appendix: Manufacturers of thermoanalytical instrumention 495
References 499
References Chapter 1
References Chapter 2
References Chapter 3
References Chapter 4
References Chapter 5
499
500
500
502
506
www.pdfgrip.com
List of Symbols
A
AR
ASTM
Frequency or Pre-exponential Factor (min ')
Atmospheric residue
American Society for Testing and Materials
BP
Boiling Point ("C)
CCR
CR
Conradson Carbon Residue (%)
Crackable part of the sample (%)
DDK
DIN
Dynamic Difference Calorimetry (see DSC)
Deutsches Institut k r Normung e. V.
(German Institute for Standardization)
Differential Scanning Calorimetry
Differential Thermal Analysis
Differential Thermogravimetry (First differential quotient of weight loss
with respect to time) (% min ')
DSC
DTA
DTG
Activation Energy (J . Mol-l)
Base of natural logarithm
Exponent with base e
Residual weight at the point of inflexion of the TGA curve (%)
Energy flow (pW)
Enthalpy of pyrolysis (J . g-1)
Heat of fusion (J . g-1)
Heat of vaporization (J . g-1)
Infrared Spectroscopy
Reaction (Rate) Constant (min-')
Natural logarithm
Decimal logarithm
Mean relative particle mass (Mean molecular weight)
Melting Point ("C)
Non-distillable part of the sample (%)
Nuclear Magnetic Resonance Spectroscopy
Reaction order (dimensionless)
www.pdfgrip.com
XI1
List of Symbols
P
PCR
Pen
PMB
Pressure (bar)
Practical thermal crackable part of the sample (%)
Needle penetration at 25 "C (0.1 mmj
Polymer modified Bitumen
Q
Quotient of weight loss in air divided by weight loss in inert gas (Isothermal Gravimetry)
Universal Gas Constant (J Mol-' K-')
Residue (%) at 600 "C experimental temperature
Residue (%) at 800 "C experimental temperature
Coefficient of correlation (dimensionless)
R
R600
R800
r
SAR
Simulated atmospheric residue (%)
S.P.R&B Softening Point Ring and Ball ("C)
Simultaneous Thermal Analysis (or Analyzer)
STA
(TGA+DTA or TGA+DSC)
Simulated vacuum residue (%)
SVR
Standard deviation
S
512
Temperature (Generally OC, except kinetics with absolute temperature K)
Thermal Analysis
Start temperature of the thermal crack reaction ("C)
Thermogravimetry
Temperature of peak maximum ("C)
Onset temperature ("C)
Temperature of the point of inflexion of the TGA curve ("C)
Temperature ("C) at 1 % weight loss
Temperature ("C) at 5 % weight loss
Time (min)
Half life time (minj
U
Conversion (%)
V
VR
VVR
Coefficient of variation (%j
Vacuum residue
Visbreaker residue
x
Arithmetic mean
01
Fractional conversion (dimensionless)
Heating rate (K min-')
Solubility parameter according to Hildebrandt
( ~ M m-3)
J
Difference
Weight loss up to 100 "C (%)
Weight loss up to 200 "C (%)
Weight loss up to 300 "C (%)
Weight loss up to 400 "C (%)
T
TA
Tcrack
TGA
Tm
Tonset
Tw
T1 %
T5 %
t
P
6
A
AGlOO
AG200
AG300
AG400
www.pdfgrip.com
Thermal Methods in Petroleum Analysis
by. Heinz Kopsch
CopyrightoVCH Verlagsgesellschaft mbH, 1995
1 Introduction
Analytical methods describing the thermal behavior of substances during programmed
temperature changes, like thermogravimetry, differential thermoanalysis, or differential
scanning calorimetry are old methods, which were applied at first to problems of inorganic
chemistry, mainly to minerals. The analysis of petroleum and petroleum products has been
mentioned relatively late. In the literature survey by Weselowski [ 1-11 the first citation
dates from 1958. Also, the oldest citation in the research report by Kettrup and Ohrbach
[1-21 dates from 1965.
Petroleum, especially heavy crudes, is recovered sometimes by the use of thermal
processes like steam flooding or by in situ combustion. The processing of the recovered
crudes in the refineries is usually done by thermal methods at very different temperatures.
A review of the temperatures applied in refinery operations is given in Table 1-1. These
thermal processes are performed partly by sequential heating until the desired products are
obtained. The operating parameters for the different processes have been obtained to a
large extent by empirical experience or partly by simulation of the processes in laboratory
installations or in pilot plants. For that reason thermoanalytical methods are considered to
be very useful in obtaining data concerning the thermal behavior i. e. data describing the
Table 1-1: Temperature Ranges in Petroleum Processing
Process
Atmospheric Distillation
Vacuum Distillation
Thermal Cracking
Catalytic Cracking
Steam Cracking
High Temperature Pyrolysis
Hydrocracking (Gas Phase)
Hydrocracking (Liquid Phase)
Visbreaking
Reforming (Thermal Treating)
Reforming (Catalytic Treating)
Isomerization
Alkylation (Catalytic)
Polymerization
Hydrotreating
Steam Reforming
Bitumen Blowing
Temperature Range ("C)
350 . . . 380
350 . . . 380
400 . . . 650
450 . . . 540
650 . . . 1000
1000
340 . . . 430
340 . . . 470
460 . . . 480
510 . . . 580
500 . . . 550
60 . . . 200
0 . . . 200
170 . . . 215
250 . . . 430
700 . . . 800
230 . . . 300
www.pdfgrip.com
2
1 Introduction
thermal and oxidation stability of petroleum and its products; data predicting the manner
and quantity of products gained in the processes; and data concerning reaction kinetics
which can be used to optimize the refinery processes.
Thermogravimetry (TGA), differential thermoanalysis (DTA), and differential scanning
calorimetry (DSC) are the main methods which can be used in the analysis of petroleum
and its products. DSC is preferred to DTA, because DSC supplies values of energies
directly, whereas the DTA supplies only temperature differences.
These thermal methods of analysis have been described in several basic books
[l-3 to 1-17]. The application to polymers is described likewise [l-18, 1-19]. So far no
compilation on the application to petroleum and its products exists. The situation in the
field of standards is similar. The NormenausschuB Materialpriifung im Deutschen Institut
fur Normung (Committee for Testing and Materials of the German Institute for Standardization e. V., DIN) has approved only two standards (one of them contains terms of thermal
analysis [ 1-20], the other is the standard for thermogravimetry [l-211). Furthermore there
are three proposals (principles of differential thermal analysis [1-22], determination of
melting temperatures of crystalline material by DTA [l-231, and testing of plastics and
elastomers by DSC [ 1-24]). The American Society for Testing and Materials (ASTM) has
to date approved forty standards for the application of thermal methods of analysis. Among
them, seven standards are concerned with the testing of petroleum and its products [l-251
to [l-321, six standards are general methods [l-321 to [l-381, and four standards concerning
the testings of polymers are applicable to petroleum and its products too [l-391 to
11-42].
www.pdfgrip.com
Thermal Methods in Petroleum Analysis
by. Heinz Kopsch
CopyrightoVCH Verlagsgesellschaft mbH, 1995
2 Methods and instrumentation
Using thermogravimetry (TGA), the dependence of the change in sample weight (mass)
on the temperature during programmed temperature changes in a chosen gas atmosphere
can be measured. The first derivative of the weight (mass) signal with respect to time is
called derivative thermogravimetry (DTG) and is a criterion for the reaction rate. It is usual
to record both the slope of the weight (mass) versus the time or temperature (TGA), and the
differentiatoed curve versus the time or temperature (DTG). The heating rate dictates the
actual position of the TGA and DTG graphs; it is therefore advisable always to use the
same heating rate ( p ) so that different tests may be compared. For small sample weights
(masses), up to approximately 10 rng, a standard heating rate of 10 K/min is practicable.
This heating rate is slow enough to avoid any temperature gradient inside the sample while
permitting a reasonable utilization of the available workmg time. The shift to higher
temperatures of the TGA and DTG curves as a consequence of faster heating rates permits
calculation of the Arrhenius kinetic parameters and hence investigation of the reaction
kinetics (see chapter 3.3). Furthermore, the position of the TGA and DTG curves will be
influenced by the shape of the sample pan, especially by the ratio of surface to volume of
the sample, and lastly by the quantity of gas flowing through the oven (gas flow rate).
Therefore it is important that variations in sample quantity are minimized and that the gas
flow rate is maintained as constant as possible. However, the gas flow rate must not fall
below a certain minimum value in order to avoid condensation of evaporated sample
fractions on the hangdown of the sample holder or in the gas outlet tubes. The minimum
gas flow rate depends on the geometric shape of the oven and the position of the gas inlet
and outlet tubes and therefore differs for different instruments. If the gas flow rate is
sufficient, the evaporated portions of the sample will be discharged immediately and
therefore no equilibrium between liquid and vapor will be attained. As a consequence the
boiling (evaporation)temperature of the sample will decrease adequately.That can be used
to perform a simulated distillation (see chapter 3.1.2). However, the application of thermoanalytic methods is limited to substances having a start temperature of evaporation at
atmospheric pressure not far below 200 "C.Otherwise there is the risk that evaporation in
the gas flow will begin at room temperature and thus the correct start temperature of
evaporation (zero point of the TGA curve) cannot be ascertained.
In principle all except very corrosive gases can be passed through a thermobalance; in
practice the inert gases nitrogen, helium, and argon and the reactive gases air, oxygen, and
hydrogen will be used.
The weight calibration of thermobalances is done using standard weights. The temperature calibration is more difficult. The method using the Curie point temperature, as
www.pdfgrip.com
4
2 Methods and Instrumentation
described in ASTM E 914-83, does not work if a magnetic field from outside the oven is
prevented from reciprocal action with the standard inside the oven, by the construction or
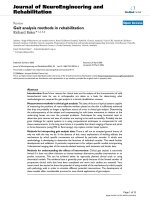
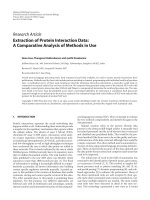
the material of the oven. Calibration using calcium oxalate monohydrate for standard is
very common, since it has exhibited three clearly-defined steps of weight loss during
heating (Fig. 2-1 to 2-3).:
Reaction
CaC,O,.H,O
CaC,04
CaCO,
-+ CaC,04 + H,O
+ CaCO, + C o t
t
CaO+CO,T
Temperature
Range at
p = 10 K/min
("C)
135.. . 175
4 6 3 . . ,502
660. . .740
Residue
DTG Maximum
Temperature
(%I
("C)
163
49 1
722
87.7
68.5
38.4
As can be seen from the figures, the DTG maximum is found at conversions which are
smaller than the maximum conversion of the reaction step concerned. The onset temperatures as well as the DTG maximum temperatures can be reproduced with coefficients of
variation < 2 % of the corresponding mean value.
The thermogravimetric experiments are run using open platinum sample pans. Pans
made from aluminium, platinum, quartz, glass, stainless steel etc. were also available. The
5
110
0
I00
-5
90
-10
U
:m:
0
no
>
U
L
-15
PI
a
r(
x
l l N T TABLE TGA
70
-20
60
-25
50
-30
TGA
-35
40
__.
100
too
300
I
500
4bO
Deg
Fig. 2-1: Thermogravimetry of CaC,O,. H,O
Plot of STA 780: TGA and DTA
Atmosphere: Argon 30 + 20 cm3/min
Heating Rate p: 10 K/min
c
I
600
I
700
I
800
<
www.pdfgrip.com
5
2 Methods and Instrumentation
110
-
100
-
90
-
80
-
U
c
m
-a
.
>
0
k
L
m
a
70
-
60
-
50
-
.3-
4
0
.2-
4l
m
.,
.i0.0
-
-.l
40
L.--y.r
0
100
200
-
--
----.
300
400
600
500
800
700
-.2
-
9
900
Deg C
Fig. 2-2: Thermogravimetry of CaC,O,. H,O
Plot of STA 780: TGA and DTG
Atmosphere: Argon 30 + 20 cm3
Heating Rate p: 10 K/min/min
110
-
100
-
90
-
80
-
70
-
60
-
50
-
40
-
U
;
136.13
c
171.08 C
463.21 C
0
L
m
a
0
601.36
100
200
I
300
1
400
I
500
C
661.26 C
600
I
700
800
I0
www.pdfgrip.com
6
2 Methods and Instrumentation
catalytic effect of the pan material on the pyrolysis reaction could not be ascertained when
comparing the reaction in platinum and quartz pans, however, it could not be completely
excluded. All thermogravimetric experiments carried out by the author were run in platinum pans. Argon was used as the inert atmosphere. Oxidation experiments were run in air
because the reactions are too fast in oxygen.
The first stage of experiments was carried out using a Stanton-Redcroft TG 750 thermobalance connected to a three-pen recorder, recording weight (mass) loss (TGA), derivative
thermogravimetry (DTG), and temperature (q.
For documentation the graphs of weight
(mass) versus temperature were drawn manually. Later on, the experiments were performed using a simultaneous thermal analyzer Stanton-Redcroft STA 780 (STA 1 000), which
is equipped with a personal computer for control, data sampling, and data evaluation (Table
2-1). Using this device the curves of TGA, DTG, and DTA (differential thermal analysis)
versus temperature can be plotted. Furthermore, the PC is equipped with extensive software to evaluate the results under varying conditions.
Table 2-1: Thermobalances
Instrument:
System:
Pressure Range:
Heating Rates:
Recording:
Evaluation:
TG 750 Stanton-Redcroft
TGA + DTG up to 1000°C
normal pressure and vacuum
0.5 . . . 100 K/min
3 pen recorder
manually
TGA empirical index numbers
evaporation
pyrolysis
oxidation
simulated distillation
DTG empirical index numbers
kinetics according to ASTM E 698-79
Instrument:
System:
Pressure Range
Heating Rates:
Recording:
Evaluation:
STA 780 Stanton-Redcroft (STA 1000)
TGA + DTG + DTA simultaneous up to 1000°C
normal pressure and vacuum
0.5 . 50 K/min
PC
PC
TGA empirical index numbers
evaporation
pyrolysis
oxidation
simulated distillation
kinetics according to Flynn & Wall
kinetics according to McCarty & Green
DTG empirical index numbers
kinetics according to ASTM E 698-79
DTA specific heat
conversion temperatures
kinetics according to Borchardt & Daniels
kinetics according to ASTM E 698-79
www.pdfgrip.com
2 Methods and Instrumentation
7
6‘
-5
i
1-
i
i
2a-
I
t4
2-
1
312-
GA S
..tN
WALE!
IN
B-‘
-7
-13
9-
WATER
OUT
10-
\
FURNACE LIFTING SYSTEM’
11
Fig. 2-4: Diagram of the Thermobalance Stanton-Redcroft TG 750
1 Balance glass housing
8 Cooling water flow meter
9 Furnace
2 Glass protection tube
2a Brackets
10 Furnace lifting system
3 Glass protection tube
11 Spirit level
4 Counter weight glass housing
12 Support for glass protection tube
5 Gas inlet
13 Lower cover
6 Protection lid
(Figure by Stanton-Redcroft Ltd.)
7 Gas flow meter
www.pdfgrip.com
8
2 Methods and Instrumentation
A schematic digaram of the TG 750 is shown in Fig. 2-4, of the STA 780 in Fig. 2-5.
The recorder script of an experiment with a hydrocarbon using the TG 750 is depicted
schematically in Fig. 2-6. Curve I represents the weight (mass) signal (TGA), curve I1 that
of the first derivative (DTG), and curve I11 the temperature (T> of the thermocouple directly
below the sample pan. Point A marks the start of the weight (mass) loss 1 % and the
corresponding temperature T1 %; point B is the weight (mass) loss 5 % and the corresponding temperature T5 %. Point C corresponds to the weight (mass) loss at 400°C (AG400).
This is the temperature limit of the thermal stability of most non-aromatic hydrocarbons
and of the heterocompounds. Point D marks the weight (mass) of the coked residue at
600 "C (R600) or at 800 "C (R800). Point E represents the maximum of the DTG curve
Fig. 2-5: Cross-Section of Water-cooled Furnance for STA 1 000 (STA780)
A Water cooled cold finger
B Ceranuc baffles
C Ceramic tube
D Micro-enviromental cup
E Ceramic stem gas inlet
F Furnace winding
G STA hangdown assembly
(Figure by Rheometnc Scientific, Polymer Laboratories GmbH)
www.pdfgrip.com
2 Methods and Instrumentation
E
9
D
Fig. 2-6: Schematic Diagram of Recorder Diagram of a Test in Protecting Gas by means of
TG 750.
I
TGA signal
II DTG signal
I11 Temperature signal
A
Start of weight loss (T1 %)
B
Start of weight loss (T5 %)
C
Weight loss up to 400 "C (AG400)
Residue at 600 "C (R600) or at 800 "C (R800)
D
E
Maximum of DTG curve (T-)
with the corresponding temperature T-. The amplitude of the DTG curve corresponds to
the reaction rate. The temperature of the DTG maximum shows whether the reaction
remains in the evaporation (distillation) range (Tmx< 400 "C) or if a pyrolysis (cracking)
reaction has occurred (T- > 400 "C).
An example of rescaling the plot of weight versus time to weight versus temperature is
shown in Fig. 2-7. Here, the point of intersection of the tangents (offset point) represents
the weight (mass) Gw of generated coke at the temperature Tw at the point of inflexion of
the TGA curve. This happens only during experiments in inert gas. Using ash-free substances in experiments in air, a TGA curve passing through zero weight is obtained, while
ash-containing substances give a constant residual weight.
The DTG graph of the experiment in air always shows more than one maximum, the first
of which can represent vaporization as well as oxidation. In this case the TGA graph in
protecting gas must be consulted for comparison.
Figs. 2-1 to 2-3 demonstrate possible evaluations using the STA 780 in an experiment
with calcium oxalate monohydrate. In Fig. 2-1 the TGA curve is evaluated with respect to
the weight (mass) losses of 1 %, 5 %, 10 %, and further in 10 % steps, whereas in the DTA
curve the peak maximum temperature and the corresponding residual weight (mass) are
plotted. Fig. 2-2 again shows the TGA and DTG curves with peak maximum temperatures
and corresponding residual weights. Fig. 2-3 demonstrates the onset and offset temperatu-
www.pdfgrip.com
10
2 Methods and Instrumentation
Residue ( % I
100..
80
60.
LO
- - - - - - -9___
(c-
z
20.
I
I
I Tw
I
*
100
300
1
500
7M
800
-
res of the three reaction steps. Theoretically all three evaluations could be drawn in one
plot, but that would be very difficult to interpret.
With the help of differential scanning calorimetry (DSC), events can be observed which
are created by energy transfer (take up or delivery) during programmed heating or cooling
of a sample, i.e. melting, crystallization, second order transitions, evaporation, pyrolysis,
oxidation etc. The energetic effect in the sample is compared to a thermally inert reference
substance which undergoes the same temperature programme. The differences between
sample and reference in uptake or delivery of energy will be recorded as energy flows
versus temperature or time. Using DSC it is likweise possible to differentiatethe resulting
data with respect to time (dimensions W/s) or to temperature (dimensionsW/O C). Neither
differential quotient has any meaning in the physical sense. They serve only to elucidate
effects of the graph of energy flows versus temperature or time. Therefore it is not
surprising, that only a very few literature references exist where differentiated curves are
described.
Using DSC, the position of the energy flows versus temperature curve as well as the rate
of an event were influeced by the heating rate, too. Therefore the DSC tests were run
likewise, using a standard heating rate p= 10 K/min with the exception of the investiga-
www.pdfgrip.com
2 Methods and Instrumentation
11
tion of reaction kinetics. There the shift of the maxima of the energy flow curve to higher
temperatures as a result of increasing heating rates permits the calculation of the Arrhenius
lanetic parameters (see Chapter 3.3). All the influences, such as oven geometry, shape of
the sample pan, position of gas inlet and gas outlet, on the results of DSC are the same as in
TGA. The gas purge with a minimum flow rate is also necessary in DSC to avoid
condensations,when petroleum and its products or generally volatile substances are tested.
As a consequence, the boiling (evaporation) temperature will decrease in a similar way to
that in TGA. The gases used in TGA can be used also in DSC. Some additional experiments have been carried out in methane to study the influence of a hydrocarbon atmosphere.
For calibration, the melting point of indium were measured, which has a temperature of
fusion (MP) = 156.4"C and a heat of fusion Hf= 28.46 J/g (Fig. 2-8). Because reactions at
higher temperatures occur in experiments with petroleum refinery residues, additional
calibration runs were performed using pewter (MP = 231.84"C, H,= 59.61 J/g) and lead
(MP = 327.40°C, Hf= 26.47 J/g). If a calibration at higher temperatures is necessary,
potassium perrhenate KReO, (MP = 550°C, H,= 294.8 J/g) can be used.
All DSC tests carried out by the author were run using open aluminium pans. For
reference an empty pan were used. Comparative tests with platinum pans gave no indica-
0
Temperature CoC)
Fig. 2-8: Indium Calibration Curve of DSC
MP : 156.4 "C
Hf : 28.46 J/g
www.pdfgrip.com
12
2 Methods and Instrumentation
tion that the pan material had any influence, neither for pyrolysis nor for oxidation
reactions. The first experiments were carried out with the help of a DuPont 990 Thermoanalysis System connected to a 910 DSC.This system used a two pen x-y recorder; the
resultant graphs were evaluated manually. Later, a DuPont 9900 Thermoanalysis System
was used, which is equipped with a PC for control, data sampling, and data evaluation
(Table 2-2). A cross-section of the DSC cell is shown in Fig. 2-9.
Table 2-2: Differential Scanning Calorimetry
Instrument:
System:
Heating Rates:
Cooling Rates:
Recording:
Evaluation:
Fig. 2-9: DSC Cell Cross-Section
1 Gas purge inlet
2 Lid
3 Reference pan
4 Silver ring
5 Furnace winding
6 Furnace block
7 Radiation shield
8 Sample platform
DuPont 9900 Thermal Analysis System
DuPont 910 DSC
Pressure DSC Cell
DSC -75 "C . . . +250 "C, normal pressure
DSC RT . . . +650 "C vacuum till
bar
pressure up to 70 bar
0.5 . . . 50K/min
0.5 . . . 5K/min
PC
PC
specific heat
conversion temperatures
reaction enthalpy
heat of conversions
kinetics according to ASTM E 698-79
9 Chromel disk
10 Chromel wire
11 Alumel wire
12 Thermocouple junction
13 Thermoelectric disk (Constantan)
14 Samplepan
15 Lid
(Figure by TA Instruments Inc.)
www.pdfgrip.com
2 Methods and Instrumentation
13
Petroleum and its products are multicomponent systems of varying chemical composition. They are predominantly a mixture of hydrocarbons, usually accompanied by a small
quantity of heterocompounds which contain in addition to carbon (C) and hydrogen (H)
other atoms such as sulfur (S), nitrogen (N), and/or oxygen (0).Metals are present in very
small concentrations, such as vanadium and nickel in organically bound forms. The
average elementary composition of petroleum in weight-% lies between the following
limits [2-11:
C 8 3 . . . 87%
H11
. . . 14%
S 0.01.. . 8 %
0 0
. . .2 %
N 0.01 . . . 1.7 %
Metals 0 . . . 0.1 %
Petroleum contains four groups of hydrocarbons:
- alkanes (unbranched n- and branched i-alkanes)
- cycloalkanes (naphthenes, unsubstituted and substituted)
- aromatics (unsubstituted and substituted)
- complex hydrocarbons (naphthenoaromatics)
Alkenes (olefins) and alkynes (acetylenes) are not found in petroleum (crude oils). However, they were formed during the processing of petroleum at high temperatures.
With regard to the boiling behavior, the full range of substances occur, from those which
evaporate early during the recovery, as a result of pressure decrease, through to substances
which cannot evaporate without decomposition. It is possible to separate individual cherncally-defined substances from the low boiling fractions. From medium and high boiling
fractions and from the non-distillable residues only multicomponent systems can be
obtained, which can be separated into groups characterized by a similar chemical and
physical behavior. Separation into individual compounds is almost impossible.
Under these circumstances, it seems reasonable to study the thermal reactions such as
boiling, pyrolysis, and the oxidation behavior of defined model substances first, in order to
understand the behavior of petroleum and its main products and to draw some analogous
conclusions.