Tài liệu Báo cáo khoa học: "Going Beyond AER: An Extensive Analysis of Word Alignments and Their Impact on MT" pdf
Bạn đang xem bản rút gọn của tài liệu. Xem và tải ngay bản đầy đủ của tài liệu tại đây (271.36 KB, 8 trang )
Proceedings of the 21st International Conference on Computational Linguistics and 44th Annual Meeting of the ACL, pages 9–16,
Sydney, July 2006.
c
2006 Association for Computational Linguistics
Going Beyond AER: An Extensive Analysis of Word Alignments and
Their Impact on MT
Necip Fazil Ayan and Bonnie J. Dorr
Institute of Advanced Computer Studies (UMIACS)
University of Maryland
College Park, MD 20742
{nfa,bonnie}@umiacs.umd.edu
Abstract
This paper presents an extensive evalua-
tion of five different alignments and in-
vestigates their impact on the correspond-
ing MT system output. We introduce
new measures for intrinsic evaluations and
examine the distribution of phrases and
untranslated words during decoding to
identify which characteristics of different
alignments affect translation. We show
that precision-oriented alignments yield
better MT output (translating more words
and using longer phrases) than recall-
oriented alignments.
1 Introduction
Word alignments are a by-product of statistical
machine translation (MT) and play a crucial role
in MT performance. In recent years, researchers
have proposed several algorithms to generate word
alignments. However, evaluating word alignments
is difficult because even humans have difficulty
performing this task.
The state-of-the art evaluation metric—
alignment error rate (AER)—attempts to balance
the precision and recall scores at the level of
alignment links (Och and Ney, 2000). Other met-
rics assess the impact of alignments externally,
e.g., different alignments are tested by comparing
the corresponding MT outputs using automated
evaluation metrics (e.g., BLEU (Papineni et al.,
2002) or METEOR (Banerjee and Lavie, 2005)).
However, these studies showed that AER and
BLEU do not correlate well (Callison-Burch et al.,
2004; Goutte et al., 2004; Ittycheriah and Roukos,
2005). Despite significant AER improvements
achieved by several researchers, the improvements
in BLEU scores are insignificant or, at best, small.
This paper demonstrates the difficulty in assess-
ing whether alignment quality makes a difference
in MT performance. We describe the impact of
certain alignment characteristics on MT perfor-
mance but also identify several alignment-related
factors that impact MT performance regardless of
the quality of the initial alignments. In so doing,
we begin to answer long-standing questions about
the value of alignment in the context of MT.
We first evaluate 5 different word alignments
intrinsically, using: (1) community-standard
metrics—precision, recall and AER; and (2) a
new measure called consistent phrase error rate
(CPER). Next, we observe the impact of differ-
ent alignments on MT performance. We present
BLEU scores on a phrase-based MT system,
Pharaoh (Koehn, 2004), using five different align-
ments to extract phrases. We investigate the im-
pact of different settings for phrase extraction, lex-
ical weighting, maximum phrase length and train-
ing data. Finally, we present a quantitative analy-
sis of which phrases are chosen during the actual
decoding process and show how the distribution of
the phrases differ from one alignment into another.
Our experiments show that precision-oriented
alignments yield better phrases for MT than recall-
oriented alignments. Specifically, they cover a
higher percentage of our test sets and result in
fewer untranslated words and selection of longer
phrases during decoding.
The next section describes work related to our
alignment evaluation approach. Following this
we outline different intrinsic evaluation measures
of alignment and we propose a new measure to
evaluate word alignments within phrase-based MT
framework. We then present several experiments
to measure the impact of different word align-
ments on a phrase-based MT system, and inves-
tigate how different alignments change the phrase
9
selection in the same MT system.
2 Related Work
Starting with the IBM models (Brown et al.,
1993), researchers have developed various statis-
tical word alignment systems based on different
models, such as hidden Markov models (HMM)
(Vogel et al., 1996), log-linear models (Och and
Ney, 2003), and similarity-based heuristic meth-
ods (Melamed, 2000). These methods are un-
supervised, i.e., the only input is large paral-
lel corpora. In recent years, researchers have
shown that even using a limited amount of manu-
ally aligned data improves word alignment signif-
icantly (Callison-Burch et al., 2004). Supervised
learning techniques, such as perceptron learn-
ing, maximum entropy modeling or maximum
weighted bipartite matching, have been shown to
provide further improvements on word alignments
(Ayan et al., 2005; Moore, 2005; Ittycheriah and
Roukos, 2005; Taskar et al., 2005).
The standard technique for evaluating word
alignments is to represent alignments as a set of
links (i.e., pairs of words) and to compare the gen-
erated alignment against manual alignment of the
same data at the level of links. Manual align-
ments are represented by two sets: Probable (P )
alignments and Sure (S) alignments, where S ⊆
P . Given A, P and S, the most commonly used
metrics—precision (Pr), recall (Rc) and alignment
error rate (AER)—are defined as follows:
P r =
|A ∩ P |
|A|
Rc =
|A ∩ S|
|S|
AER = 1 −
|A ∩ S| + |A ∩ P |
|A| + |S|
Another approach to evaluating alignments is to
measure their impact on an external application,
e.g., statistical MT. In recent years, phrase-based
systems (Koehn, 2004; Chiang, 2005) have been
shown to outperform word-based MT systems;
therefore, in this paper, we use a publicly-available
phrase-based MT system, Pharaoh (Koehn, 2004),
to investigate the impact of different alignments.
Although it is possible to estimate phrases di-
rectly from a training corpus (Marcu and Wong,
2002), most phrase-based MT systems (Koehn,
2004; Chiang, 2005) start with a word alignment
and extract phrases that are consistent with the
given alignment. Once the consistent phrases are
extracted, they are assigned multiple scores (such
Test
Lang # of # Words Source
Pair Sent’s (en/fl)
en-ch 491 14K/12K NIST MTEval’2002
en-ar 450 13K/11K NIST MTEval’2003
Training
en-ch 107K 4.1M/3.3M FBIS
en-ar 44K 1.4M/1.1M News + Treebank
Table 1: Test and Training Data Used for Experiments
as translation probabilities and lexical weights),
and the decoder’s job is to choose the correct
phrases based on those scores using a log-linear
model.
3 Intrinsic Evaluation of Alignments
Our goal is to compare different alignments and
to investigate how their characteristics affect the
MT systems. We evaluate alignments in terms of
precision, recall, alignment error rate (AER), and
a new measure called consistent phrase error rate
(CPER).
We focus on 5 different alignments obtained by
combining two uni-directional alignments. Each
uni-directional alignment is the result of running
GIZA++ (Och, 2000b) in one of two directions
(source-to-target and vice versa) with default con-
figurations. The combined alignments that are
used in this paper are as follows:
1. Union of both directions (S
U
),
2. Intersection of both directions (S
I
),
3. A heuristic based combination technique
called grow-diag-final (S
G
), which is the
default alignment combination heuristic
employed in Pharaoh (Koehn, 2004),
4-5. Two supervised alignment combination
techniques (S
A
and S
B
) using 2 and 4 in-
put alignments as described in (Ayan et
al., 2005).
This paper examines the impact of alignments
according to their orientation toward precision or
recall. Among the five alignments above, S
U
and
S
G
are recall-oriented while the other three are
precision-oriented. S
B
is an improved version of
S
A
which attempts to increase recall without a sig-
nificant sacrifice in precision.
Manually aligned data from two language pairs
are used in our intrinsic evaluations using the five
combinations above. A summary of the training
and test data is presented in Table 1.
Our gold standard for each language pair is
a manually aligned corpus. English-Chinese an-
10
notations distinguish between sure and probable
alignment links, but English-Arabic annotations
do not. The details of how the annotations are
done can be found in (Ayan et al., 2005) and (Itty-
cheriah and Roukos, 2005).
3.1 Precision, Recall and AER
Table 2 presents the precision, recall, and AER for
5 different alignments on 2 language pairs. For
each of these metrics, a different system achieves
the best score – respectively, these are S
I
, S
U
, and
S
B
. S
U
and S
G
yield low precision, high recall
alignments. In contrast, S
I
yields very high pre-
cision but very low recall. S
A
and S
B
attempt to
balance these two measures but their precision is
still higher than their recall. Both systems have
nearly the same precision but S
B
yields signifi-
cantly higher recall than S
A
.
Align. en-ch en-ar
Sys. Pr Rc AER Pr Rc AER
S
U
58.3 84.5 31.6 56.0 84.1 32.8
S
G
61.9 82.6 29.7 60.2 83.0 30.2
S
I
94.8 53.6 31.2 96.1 57.1 28.4
S
A
87.0 74.6 19.5 88.6 71.1 21.1
S
B
87.8 80.5 15.9 90.1 76.1 17.5
Table 2: Comparison of 5 Different Alignments using AER
(on English-Chinese and English-Arabic)
3.2 Consistent Phrase Error Rate
In this section, we present a new method, called
consistent phrase error rate (CPER), for evalu-
ating word alignments in the context of phrase-
based MT. The idea is to compare phrases con-
sistent with a given alignment against phrases that
would be consistent with human alignments.
CPER is similar to AER but operates at the
phrase level instead of at the word level. To com-
pute CPER, we define a link in terms of the posi-
tion of its start and end words in the phrases. For
instance, the phrase link (i
1
, i
2
, j
1
, j
2
) indicates
that the English phrase e
i
1
, . . . , e
i
2
and the FL
phrase f
j
1
, . . . , f
j
2
are consistent with the given
alignment. Once we generate the set of phrases
P
A
and P
G
that are consistent with a given align-
ment A and a manual alignment G, respectively,
we compute precision (Pr), recall (Rc), and CPER
as follows:
1
P r =
|P
A
∩ P
G
|
|P
A
|
Rc =
|P
A
∩ P
G
|
|P
G
|
CP ER = 1 −
2 × P r × Rc
P r + Rc
1
Note that CPER is equal to 1 - F-score.
Chinese Arabic
Align. CPER-3 CPER-7 CPER-3 CPER-7
S
U
63.2 73.3 55.6 67.1
S
G
59.5 69.4 52.0 62.6
S
I
50.8 69.8 50.7 67.6
S
A
40.8 51.6 42.0 54.1
S
B
36.8 45.1 36.1 46.6
Table 3: Consistent Phrase Error Rates with Maximum
Phrase Lengths of 3 and 7
CPER penalizes incorrect or missing alignment
links more severely than AER. While comput-
ing AER, an incorrect alignment link reduces the
number of correct alignment links by 1, affecting
precision and recall slightly. Similarly, if there is
a missing link, only the recall is reduced slightly.
However, when computing CPER, an incorrect or
missing alignment link might result in more than
one phrase pair being eliminated from or added to
the set of phrases. Thus, the impact is more severe
on both precision and recall.
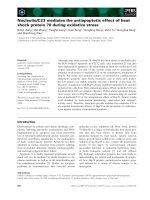
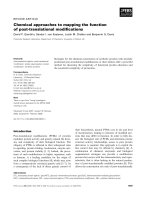
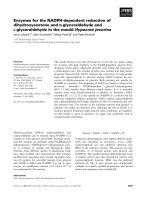
Figure 1: Sample phrases that are generated from a human
alignment and an automated alignment: Gray cells show the
alignment links, and rectangles show the possible phrases.
In Figure 1, the first box represents a manual
alignment and the other two represent automated
alignments A. In the case of a missing align-
ment link (Figure 1b), P
A
includes 9 valid phrases.
For this alignment, AER = 1 − (2 × 2/2 ×
2/3)/(2/2 + 2/3) = 0.2 and CP ER = 1 − (2 ×
5/9 × 5/6)/(5/9 + 5/6) = 0.33. In the case of an
incorrect alignment link (Figure 1c), P
A
includes
only 2 valid phrases, which results in a higher
CPER (1 − (2 × 2/2 × 2/6)/(2/2 + 2/6) = 0.49)
but a lower AER (1 − (2 × 3/4 × 3/3)/(3/4 +
3/3) = 0.14).
Table 3 presents the CPER values on two dif-
ferent language pairs, using 2 different maximum
phrase lengths. For both maximum phrase lengths,
S
A
and S
B
yield the lowest CPER. For all 5
alignments—in both languages—CPER increases
as the length of the phrase increases. For all
alignments except S
I
, this amount of increase is
nearly the same on both languages. Since S
I
con-
tains very few alignment points, the number of
generated phrases dramatically increases, yielding
11
poor precision and CPER as the maximum phrase
length increases.
4 Evaluating Alignments within MT
We now move from intrinsic measurement to ex-
trinsic measurement using an off-the-shelf phrase-
based MT system Pharaoh (Koehn, 2004). Our
goal is to identify the characteristics of alignments
that change MT behavior and the types of changes
induced by these characteristics.
All MT system components were kept the same
in our experiments except for the component that
generates a phrase table from a given alignment.
We used the corpora presented in Table 1 to train
the MT system. The phrases were scored using
translation probabilities and lexical weights in two
directions and a phrase penalty score. We also use
a language model, a distortion model and a word
penalty feature for MT.
We measure the impact of different alignments
on Pharaoh using three different settings:
1. Different maximum phrase length,
2. Different sizes of training data, and
3. Different lexical weighting.
For maximum phrase length, we used 3 (based
on what was suggested by (Koehn et al., 2003) and
7 (the default maximum phrase length in Pharaoh).
For lexical weighting, we used the original
weighting scheme employed in Pharaoh and a
modified version. We realized that the publicly-
available implementation of Pharaoh computes
the lexical weights only for non-NULL alignment
links. As a consequence, loose phrases contain-
ing NULL-aligned words along their edges receive
the same lexical weighting as tight phrases with-
out NULL-aligned words along the edges. We
therefore adopted a modified weighting scheme
following (Koehn et al., 2003), which incorporates
NULL alignments.
MT output was evaluated using the standard
evaluation metric BLEU (Papineni et al., 2002).
2
The parameters of the MT System were opti-
mized for BLEU metric on NIST MTEval’2002
test sets using minimum error rate training (Och,
2003), and the systems were tested on NIST
MTEval’2003 test sets for both languages.
2
We used the NIST script (version 11a) for BLEU with
its default settings: case-insensitive matching of n-grams up
to n = 4, and the shortest reference sentence for the brevity
penalty. The words that were not translated during decoding
were deleted from the MT output before running the BLEU
script.
The SRI Language Modeling Toolkit was used
to train a trigram model with modified Kneser-Ney
smoothing on 155M words of English newswire
text, mostly from the Xinhua portion of the Gi-
gaword corpus. During decoding, the number of
English phrases per FL phrase was limited to 100
and phrase distortion was limited to 4.
4.1 BLEU Score Comparison
Table 4 presents the BLEU scores for Pharaoh runs
on Chinese with five different alignments using
different settings for maximum phrase length (3
vs. 7), size of training data (107K vs. 241K), and
lexical weighting (original vs. modified).
3
The modified lexical weighting yields huge im-
provements when the alignment leaves several
words unaligned: the BLEU score for S
A
goes
from 24.26 to 25.31 and the BLEU score for S
B
goes from 23.91 to 25.38. In contrast, when the
alignments contain a high number of alignment
links (e.g., S
U
and S
G
), modifying lexical weight-
ing does not bring significant improvements be-
cause the number of phrases containing unaligned
words is relatively low. Increasing the phrase
length increases the BLEU scores for all systems
by nearly 0.7 points and increasing the size of the
training data increases the BLEU scores by 1.5-2
points for all systems. For all settings, S
U
yields
the lowest BLEU scores while S
B
clearly outper-
forms the others.
Table 5 presents BLEU scores for Pharaoh runs
on 5 different alignments on English-Arabic, using
different settings for lexical weighting and max-
imum phrase lengths.
4
Using the original lexi-
cal weighting, S
A
and S
B
perform better than the
others while S
U
and S
I
yield the worst results.
Modifying the lexical weighting leads to slight re-
ductions in BLEU scores for S
U
and S
G
, but im-
proves the scores for the other 3 alignments signif-
icantly. Finally, increasing the maximum phrase
length to 7 leads to additional improvements in
BLEU scores, where S
G
and S
U
benefit nearly 2
BLEU points. As in English-Chinese, the worst
BLEU scores are obtained by S
U
while the best
scores are produced by S
B
.
As we see from the tables, the relation between
intrinsic alignment measures (AER and CPER)
3
We could not run S
B
on the larger corpus because of the
lack of required inputs.
4
Due to lack of additional training data, we could not do
experiments using different sizes of training data on English-
Arabic.
12
Original Modified Modified Modified
Alignment Max Phr Len = 3 Max Phr Len=3 Max Phr Len=7 Max Phr Len=3
|Corpus| = 107K |Corpus| = 107K |Corpus| = 107K |Corpus| = 241K
S
U
22.56 22.66 23.30 24.40
S
G
23.65 23.79 24.48 25.54
S
I
23.60 23.97 24.76 26.06
S
A
24.26 25.31 25.99 26.92
S
B
23.91 25.38 26.14 N/A
Table 4: BLEU Scores on English-Chinese with Different Lexical Weightings, Maximum Phrase Lengths and Training Data
LW=Org LW=Mod LW=Mod
Alignment MPL=3 MPL=3 MPL=7
S
U
41.97 41.72 43.50
S
G
44.06 43.82 45.78
S
I
42.29 42.76 43.88
S
A
44.49 45.23 46.06
S
B
44.92 45.39 46.66
Table 5: BLEU Scores on English-Arabic with Different
Lexical Weightings and Maximum Phrase Lengths
and the corresponding BLEU scores varies, de-
pending on the language, lexical weighting, maxi-
mum phrase length, and training data size. For ex-
ample, using a modified lexical weighting, the sys-
tems are ranked according to their BLEU scores as
follows: S
B
, S
A
, S
G
, S
I
, S
U
—an ordering that dif-
fers from that of AER but is identical to that of
CPER (with a phrase length of 3) for Chinese. On
the other hand, in Arabic, both AER and CPER
provide a slightly different ranking from that of
BLEU, with S
G
and S
I
swapping places.
4.2 Tight vs. Loose Phrases
To demonstrate how alignment-related compo-
nents of the MT system might change the trans-
lation quality significantly, we did an additional
experiment to compare different techniques for ex-
tracting phrases from a given alignment. Specifi-
cally, we are comparing two techniques for phrase
extraction:
1. Loose phrases (the original ‘consistent
phrase extraction’ method)
2. Tight phrases (the set of phrases where
the first/last words on each side are forced
to align to some word in the phrase pair)
Using tight phrases penalizes alignments with
many unaligned words, whereas using loose
phrases rewards them. Our goal is to compare
the performance of precision-oriented vs. recall-
oriented alignments when we allow only tight
phrases in the phrase extraction step. To sim-
plify things, we used only 2 alignments: S
G
, the
best recall-oriented alignment, and S
B
, the best
precision-oriented alignment. For this experiment,
we used modified lexical weighting and a maxi-
mum phrase length of 7.
Chinese Arabic
Alignment Loose Tight Loose Tight
S
G
24.48 23.19 45.78 43.67
S
B
26.14 22.68 46.66 40.10
Table 6: BLEU Scores with Loose vs. Tight Phrases
Table 6 presents the BLEU scores for S
G
and S
B
using two different phrase extraction techniques
on English-Chinese and English-Arabic. In both
languages, S
B
outperforms S
G
significantly when
loose phrases are used. However, when we use
only tight phrases, the performance of S
B
gets sig-
nificantly worse (3.5 to 6.5 BLEU-score reduction
in comparison to loose phrases). The performance
of S
G
also gets worse but the degree of BLEU-
score reduction is less than that of S
B
. Overall
S
G
performs better than S
B
with tight phrases;
for English-Arabic, the difference between the two
systems is more than 3 BLEU points. Note that, as
before, the relation between the alignment mea-
sures and the BLEU scores varies, this time de-
pending on whether loose phrases or tight phrases
are used: both CPER and AER track the BLEU
rankings for loose (but not for tight) phrases.
This suggests that changing alignment-related
components of the system (i.e., phrase extraction
and phrase scoring) influences the overall trans-
lation quality significantly for a particular align-
ment. Therefore, when comparing two align-
ments in the context of a MT system, it is im-
portant to take the alignment characteristics into
account. For instance, alignments with many un-
aligned words are severely penalized when using
tight phrases.
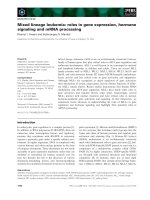
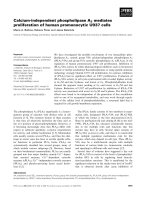
4.3 Untranslated Words
We analyzed the percentage of words left untrans-
lated during decoding. Figure 2 shows the per-
centage of untranslated words in the FL using the
Chinese and Arabic NIST MTEval’2003 test sets.
On English-Chinese data (using all four settings
given in Table 4) S
U
and S
G
yield the highest per-
centage of untranslated words while S
I
produces
the lowest percentage of untranslated words. S
A
and S
B
leave about 2% of the FL words phrases
13
Figure 2: Percentage of untranslated words out of the total
number of FL words
without translating them. Increasing the training
data size reduces the percentage of untranslated
words by nearly half with all five alignments. No
significant impact on untranslated words is ob-
served from modifying the lexical weights and
changing the phrase length.
On English-Arabic data, all alignments result
in higher percentages of untranslated words than
English-Chinese, most likely due to data spar-
sity. As in Chinese-to-English translation, S
U
is the worst and S
B
is the best. S
I
behaves
quite differently, leaving nearly 7% of the words
untranslated—an indicator of why it produces a
higher BLEU score on Chinese but a lower score
on Arabic compared to other alignments.
4.4 Analysis of Phrase Tables
This section presents several experiments to an-
alyze how different alignments affect the size of
the generated phrase tables, the distribution of the
phrases that are used in decoding, and the cover-
age of the test set with the generated phrase tables.
Size of Phrase Tables The major impact of
using different alignments in a phrase-based MT
system is that each one results in a different phrase
table. Table 7 presents the number of phrases
that are extracted from five alignments using two
different maximum phrase lengths (3 vs. 7) in
two languages, after filtering the phrase table for
MTEval’2003 test set. The size of the phrase table
increases dramatically as the number of links in
the initial alignment gets smaller. As a result, for
both languages, S
U
and S
G
yield a much smaller
Chinese Arabic
Alignment MPL=3 MPL=7 MPL=3 MPL=7
S
U
106 122 32 38
S
G
161 181 48 55
S
I
1331 3498 377 984
S
A
954 1856 297 594
S
B
876 1624 262 486
Table 7: Number of Phrases in the Phrase Table Filtered for
MTEval’2003 Test Sets (in thousands)
phrase table than the other three alignments. As
the maximum phrase length increases, the size of
the phrase table gets bigger for all alignments;
however, the growth of the table is more signifi-
cant for precision-oriented alignments due to the
high number of unaligned words.
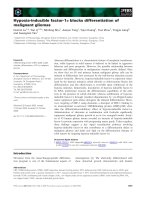
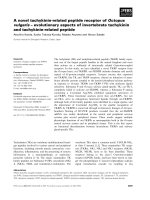
Distribution of Phrases To investigate how the
decoder chooses phrases of different lengths, we
analyzed the distribution of the phrases in the fil-
tered phrase table and the phrases that were used
to decode Chinese MTEval’2003 test set.
5
For the
remaining experiments in the paper, we use mod-
ified lexical weighting, a maximum phrase length
of 7, and 107K sentence pairs for training.
The top row in Figure 3 shows the distribution
of the phrases generated by the five alignments
(using a maximum phrase length of 7) according
to their length. The “j-i” designators correspond
to the phrase pairs with j FL words and i English
words. For S
U
and S
G
, the majority of the phrases
contain only one FL word, and the percentage of
the phrases with more than 2 FL words is less than
18%. For the other three alignments, however, the
distribution of the phrases is almost inverted. For
S
I
, nearly 62% of the phrases contain more than 3
words on either FL or English side; for S
A
and S
B
,
this percentage is around 45-50%.
Given the completely different phrase distribu-
tion, the most obvious question is whether the
longer phrases generated by S
I
, S
A
and S
B
are
actually used in decoding. In order to investigate
this, we did an analysis of the phrases used to de-
code the same test set.
The bottom row of Figure 3 shows the per-
centage of phrases used to decode the Chinese
MTEval’2003 test set. The distribution of the ac-
tual phrases used in decoding is completely the re-
verse of the distribution of the phrases in the en-
tire filtered table. For all five alignments, the ma-
jority of the used phrases is one-to-one (between
5
Due to lack of space, we will present results on Chinese-
English only in the rest of this paper but the Arabic-English
results show the same trends.
14
Figure 3: Distribution of the phrases in the phrase table
filtered for Chinese MTEval’2003 test set (top row) and the
phrases used in decoding the same test set (bottom row) ac-
cording to their lengths
50-65% of the total number of phrases used in de-
coding). S
I
, S
A
and S
B
use the other phrase pairs
(particularly 1-to-2 phrases) more than S
U
and S
G
.
Note that S
I
, S
A
and S
B
use only a small portion
of the phrases with more than 3 words although the
majority of the phrase table contains phrases with
more than 3 words on one side. It is surprising
that the inclusion of phrase pairs with more than
3 words in the search space increases the BLEU
score although the majority of the phrases used in
decoding is mostly one-to-one.
Length of the Phrases used in Decoding We
also investigated the number and length of phrases
that are used to decode the given test set for dif-
ferent alignments. Table 8 presents the average
number of English and FL words in the phrases
used in decoding Chinese MTEval’2003 test set.
The decoder uses fewer phrases with S
I
, S
A
and
S
B
than for the other two, thus yielding a higher
number of FL words per phrase. The number of
English words per phrase is also higher for these
three systems than the other two.
Coverage of the Test Set Finally, we examine
the coverage of a test set using phrases of a spe-
cific length in the phrase table. Table 9 presents
Alignment |Eng| |FL|
S
U
1.39 1.28
S
G
1.45 1.33
S
I
1.51 1.55
S
A
1.54 1.55
S
B
1.56 1.52
Table 8: The average length of the phrases that are used in
decoding Chinese MTEval’2003 test set
the coverage of the Chinese MTEval’2003 test set
(source side) using only phrases of a particular
length (from 1 to 7). For this experiment, we as-
sume that a word in the test set is covered if it is
part of a phrase pair that exists in the phrase table
(if a word is part of multiple phrases, it is counted
only once). Not surprisingly, using only phrases
with one FL word, more than 90% of the test set
can be covered for all 5 alignments. As the length
of the phrases increases, the coverage of the test
set decreases. For instance, using phrases with 5
FL words results in less than 5% coverage of the
test set.
Phrase Length (FL)
A 1 2 3 4 5 6 7
S
U
92.2 59.5 21.4 6.7 1.3 0.4 0.1
S
G
95.5 64.4 24.9 7.4 1.6 0.5 0.3
S
I
97.8 75.8 38.0 13.8 4.6 1.9 1.2
S
A
97.3 75.3 36.1 12.5 3.8 1.5 0.8
S
B
97.5 74.8 35.7 12.4 4.2 1.8 0.9
Table 9: Coverage of Chinese MTEval’2003 Test Set Using
Phrases with a Specific Length on FL side (in percentages)
Table 9 reveals that the coverage of the test set
is higher for precision-oriented alignments than
recall-oriented alignments for all different lengths
of the phrases. For instance, S
I
, S
A
, and S
B
cover
nearly 75% of the corpus using only phrases with
2 FL words, and nearly 36% of the corpus using
phrases with 3 FL words. This suggests that recall-
oriented alignments fail to catch a significant num-
ber of phrases that would be useful to decode this
test set, and precision-oriented alignments would
yield potentially more useful phrases.
Since precision-oriented alignments make a
higher number of longer phrases available to the
decoder (based on the coverage of phrases pre-
sented in Table 9), they are used more during
decoding. Consequently, the major difference
between the alignments is the coverage of the
phrases extracted from different alignments. The
more the phrase table covers the test set, the more
the longer phrases are used during decoding, and
precision-oriented alignments are better at gener-
ating high-coverage phrases than recall-oriented
alignments.
15
5 Conclusions and Future Work
This paper investigated how different alignments
change the behavior of phrase-based MT. We
showed that AER is a poor indicator of MT
performance because it penalizes incorrect links
less than is reflected in the corresponding phrase-
based MT. During phrase-based MT, an incorrect
alignment link might prevent extraction of several
phrases, but the number of phrases affected by that
link depends on the context.
We designed CPER, a new phrase-oriented met-
ric that is more informative than AER when the
alignments are used in a phrase-based MT system
because it is an indicator of how the set of phrases
differ from one alignment to the next according to
a pre-specified maximum phrase length.
Even with refined evaluation metrics (including
CPER), we found it difficult to assess the impact
of alignment on MT performance because word
alignment is not the only factor that affects the
choice of the correct words (or phrases) during
decoding. We empirically showed that different
phrase extraction techniques result in better MT
output for certain alignments but the MT perfor-
mance gets worse for other alignments. Simi-
larly, adjusting the scores assigned to the phrases
makes a significant difference for certain align-
ments while it has no impact on some others. Con-
sequently, when comparing two BLEU scores, it is
difficult to determine whether the alignments are
bad to start with or the set of extracted phrases is
bad or the phrases extracted from the alignments
are assigned bad scores. This suggests that finding
a direct correlation between AER (or even CPER)
and the automated MT metrics is infeasible.
We demonstrated that recall-oriented alignment
methods yield smaller phrase tables and a higher
number of untranslated words when compared to
precision-oriented methods. We also showed that
the phrases extracted from recall-oriented align-
ments cover a smaller portion of a given test set
when compared to precision-oriented alignments.
Finally, we showed that the decoder with recall-
oriented alignments uses shorter phrases more fre-
quently as a result of unavailability of longer
phrases that are extracted.
Future work will involve an investigation into
how the phrase extraction and scoring should be
adjusted to take the nature of the alignment into
account and how the phrase-table size might be re-
duced without sacrificing the MT output quality.
Acknowledgments This work has been supported, in
part, under ONR MURI Contract FCPO.810548265 and the
GALE program of the Defense Advanced Research Projects
Agency, Contract No. HR0011-06-2-0001. We also thank
Adam Lopez for his very helpful comments on earlier drafts
of this paper.
References
Necip F. Ayan, Bonnie J. Dorr, and Christof Monz. 2005.
Neuralign: Combining word alignments using neural net-
works. In Proceedings of EMNLP’2005, pages 65–72.
Stanjeev Banerjee and Alon Lavie. 2005. Meteor: An au-
tomatic metric for MT evaluation with improved corre-
lation with human judgments. In Proceedings of Work-
shop on Intrinsic and Extrinsic Evaluation Measures for
MT and/or Summarization at ACL-2005.
Peter F. Brown, Stephan A. Della Pietra, and Robert L. Mer-
cer. 1993. The mathematics of statistical machine trans-
lation: Parameter estimation. Computational Linguistics,
19(2):263–311.
Chris Callison-Burch, David Talbot, and Miles Osborne.
2004. Statistical machine translation with word- and
sentence-aligned parallel corpora. In Proceedings of
ACL’2004.
David Chiang. 2005. A hierarchical phrase-based model
for statistical machine translation. In Proceedings of
ACL’2005.
Cyril Goutte, Kenji Yamada, and Eric Gaussier. 2004. Align-
ing words using matrix factorisation. In Proceedings of
ACL’2004, pages 502–509.
Abraham Ittycheriah and Salim Roukos. 2005. A maximum
entropy word aligner for arabic-english machine transla-
tion. In Proceedings of EMNLP’2005.
Philipp Koehn, Franz J. Och, and Daniel Marcu. 2003. Sta-
tistical phrase-based translation. In Proceedings of HLT-
NAACL’2003.
Philipp Koehn. 2004. Pharaoh: A beam search decoder for
phrase-based statistical machine translation. In Proceed-
ings of AMTA’2004.
Daniel Marcu and William Wong. 2002. A phrase-based,
joint probability model for statistical machine translation.
In Proceedings of EMNLP’2002.
I. Dan Melamed. 2000. Models of translational equivalence
among words. Computational Linguistics, 26(2):221–
249.
Robert C. Moore. 2005. A discriminative frame-
work for bilingual word alignment. In Proceedings of
EMNLP’2005.
Franz J. Och and Hermann Ney. 2000. A comparison of
alignment models for statistical machine translation. In
Proceedings of COLING’2000.
Franz J. Och. 2000b. GIZA++: Training of statistical transla-
tion models. Technical report, RWTH Aachen, University
of Technology.
Franz J. Och and Hermann Ney. 2003. A systematic com-
parison of various statistical alignment models. Computa-
tional Linguistics, 29(1):9–51, March.
Franz J. Och. 2003. Minimum error rate training in statistical
machine translation. In Proceedings of ACL’2003.
Kishore Papineni, Salim Roukos, Todd Ward, and Wei-Jing
Zhu. 2002. BLEU: a method for automatic evaluation of
machine translation. In Proceedings of ACL’2002.
Ben Taskar, Simon Lacoste-Julien, and Dan Klein. 2005. A
discriminative matching approach to word alignment. In
Proceedings of EMNLP’2005.
Stefan Vogel, Hermann Ney, and Christoph Tillmann. 1996.
HMM-based word alignment in statistical translation. In
Proceedings of COLING’1996, pages 836–841.
16