Tài liệu Báo cáo khoa học: "Reading Level Assessment Using Support Vector Machines and Statistical Language Models" pdf
Bạn đang xem bản rút gọn của tài liệu. Xem và tải ngay bản đầy đủ của tài liệu tại đây (177.59 KB, 8 trang )
Proceedings of the 43rd Annual Meeting of the ACL, pages 523–530,
Ann Arbor, June 2005.
c
2005 Association for Computational Linguistics
Reading Level Assessment Using Support Vector Machines and
Statistical Language Models
Sarah E. Schwarm
Dept. of Computer Science and Engineering
University of Washington
Seattle, WA 98195-2350
Mari Ostendorf
Dept. of Electrical Engineering
University of Washington
Seattle, WA 98195-2500
Abstract
Reading proficiency is a fundamen-
tal component of language competency.
However, finding topical texts at an appro-
priate reading level for foreign and sec-
ond language learners is a challenge for
teachers. This task can be addressed with
natural language processing technology to
assess reading level. Existing measures
of reading level are not well suited to
this task, but previous work and our own
pilot experiments have shown the bene-
fit of using statistical language models.
In this paper, we also use support vector
machines to combine features from tradi-
tional reading level measures, statistical
language models, and other language pro-
cessing tools to produce a better method
of assessing reading level.
1 Introduction
The U.S. educational system is faced with the chal-
lenging task of educating growing numbers of stu-
dents for whom English is a second language (U.S.
Dept. of Education, 2003). In the 2001-2002 school
year, Washington state had 72,215 students (7.2% of
all students) in state programs for Limited English
Proficient (LEP) students (Bylsma et al., 2003). In
the same year, one quarter of all public school stu-
dents in California and one in seven students in
Texas were classified as LEP (U.S. Dept. of Edu-
cation, 2004). Reading is a critical part of language
and educational development, but finding appropri-
ate reading material for LEP students is often diffi-
cult. To meet the needs of their students, bilingual
education instructors seek out “high interest level”
texts at low reading levels, e.g. texts at a first or sec-
ond grade reading level that support the fifth grade
science curriculum. Teachers need to find material
at a variety of levels, since students need different
texts to read independently and with help from the
teacher. Finding reading materials that fulfill these
requirements is difficult and time-consuming, and
teachers are often forced to rewrite texts themselves
to suit the varied needs of their students.
Natural language processing (NLP) technology is
an ideal resource for automating the task of selecting
appropriate reading material for bilingual students.
Information retrieval systems successfully find top-
ical materials and even answer complex queries in
text databases and on the World Wide Web. How-
ever, an effective automated way to assess the read-
ing level of the retrieved text is still needed. In
this work, we develop a method of reading level as-
sessment that uses support vector machines (SVMs)
to combine features from statistical language mod-
els (LMs), parse trees, and other traditional features
used in reading level assessment.
The results presented here on reading level as-
sessment are part of a larger project to develop
teacher-support tools for bilingual education instruc-
tors. The larger project will include a text simpli-
fication system, adapting paraphrasing and summa-
rization techniques. Coupled with an information
retrieval system, these tools will be used to select
and simplify reading material in multiple languages
for use by language learners. In addition to students
in bilingual education, these tools will also be use-
ful for those with reading-related learning disabili-
523
ties and adult literacy students. In both of these sit-
uations, as in the bilingual education case, the stu-
dent’s reading level does not match his/her intellec-
tual level and interests.
The remainder of the paper is organized as fol-
lows. Section 2 describes related work on reading
level assessment. Section 3 describes the corpora
used in our work. In Section 4 we present our ap-
proach to the task, and Section 5 contains experi-
mental results. Section 6 provides a summary and
description of future work.
2 Reading Level Assessment
This section highlights examples and features of
some commonly used measures of reading level and
discusses current research on the topic of reading
level assessment using NLP techniques.
Many traditional methods of reading level assess-
ment focus on simple approximations of syntactic
complexity such as sentence length. The widely-
used Flesch-Kincaid Grade Level index is based on
the average number of syllables per word and the
average sentence length in a passage of text (Kin-
caid et al., 1975) (as cited in (Collins-Thompson
and Callan, 2004)). Similarly, the Gunning Fog in-
dex is based on the average number of words per
sentence and the percentage of words with three or
more syllables (Gunning, 1952). These methods are
quick and easy to calculate but have drawbacks: sen-
tence length is not an accurate measure of syntactic
complexity, and syllable count does not necessar-
ily indicate the difficulty of a word. Additionally,
a student may be familiar with a few complex words
(e.g. dinosaur names) but unable to understand com-
plex syntactic constructions.
Other measures of readability focus on seman-
tics, which is usually approximated by word fre-
quency with respect to a reference list or corpus.
The Dale-Chall formula uses a combination of av-
erage sentence length and percentage of words not
on a list of 3000 “easy” words (Chall and Dale,
1995). The Lexile framework combines measures
of semantics, represented by word frequency counts,
and syntax, represented by sentence length (Stenner,
1996). These measures are inadequate for our task;
in many cases, teachers want materials with more
difficult, topic-specific words but simple structure.
Measures of reading level based on word lists do not
capture this information.
In addition to the traditional reading level metrics,
researchers at Carnegie Mellon University have ap-
plied probabilistic language modeling techniques to
this task. Si and Callan (2001) conducted prelimi-
nary work to classify science web pages using uni-
gram models. More recently, Collins-Thompson and
Callan manually collected a corpus of web pages
ranked by grade level and observed that vocabulary
words are not distributed evenly across grade lev-
els. They developed a “smoothed unigram” clas-
sifier to better capture the variance in word usage
across grade levels (Collins-Thompson and Callan,
2004). On web text, their classifier outperformed
several other measures of semantic difficulty: the
fraction of unknown words in the text, the number
of distinct types per 100 token passage, the mean log
frequency of the text relative to a large corpus, and
the Flesch-Kincaid measure. The traditional mea-
sures performed better on some commercial corpora,
but these corpora were calibrated using similar mea-
sures, so this is not a fair comparison. More impor-
tantly, the smoothed unigram measure worked better
on the web corpus, especially on short passages. The
smoothed unigram classifier is also more generaliz-
able, since it can be trained on any collection of data.
Traditional measures such as Dale-Chall and Lexile
are based on static word lists.
Although the smoothed unigram classifier outper-
forms other vocabulary-based semantic measures, it
does not capture syntactic information. We believe
that higher order n-gram models or class n-gram
models can achieve better performance by captur-
ing both semantic and syntactic information. This is
particularly important for the tasks we are interested
in, when the vocabulary (i.e. topic) and grade level
are not necessarily well-matched.
3 Corpora
Our work is currently focused on a corpus obtained
from Weekly Reader, an educational newspaper with
versions targeted at different grade levels (Weekly
Reader, 2004). These data include a variety of la-
beled non-fiction topics, including science, history,
and current events. Our corpus consists of articles
from the second, third, fourth, and fifth grade edi-
524
Grade Num Articles Num Words
2 351 71.5k
3 589 444k
4 766 927k
5 691 1M
Table 1: Distribution of articles and words in the
Weekly Reader corpus.
Corpus Num Articles Num Words
Britannica 115 277k
B. Elementary 115 74k
CNN 111 51k
CNN Abridged 111 37k
Table 2: Distribution of articles and words in the
Britannica and CNN corpora.
tions of the newspaper. We design classifiers to dis-
tinguish each of these four categories. This cor-
pus contains just under 2400 articles, distributed as
shown in Table 1.
Additionally, we have two corpora consisting of
articles for adults and corresponding simplified ver-
sions for children or other language learners. Barzi-
lay and Elhadad (2003) have allowed us to use their
corpus from Encyclopedia Britannica, which con-
tains articles from the full version of the encyclope-
dia and corresponding articles from Britannica El-
ementary, a new version targeted at children. The
Western/Pacific Literacy Network’s (2004) web site
has an archive of CNN news stories and abridged
versions which we have also received permission to
use. Although these corpora do not provide an ex-
plicit grade-level ranking for each article, broad cat-
egories are distinguished. We use these data as a
supplement to the Weekly Reader corpus for learn-
ing models to distinguish broad reading level classes
than can serve to provide features for more detailed
classification. Table 2 shows the size of the supple-
mental corpora.
4 Approach
Existing reading level measures are inadequate due
to their reliance on vocabulary lists and/or a superfi-
cial representation of syntax. Our approach uses n-
gram language models as a low-cost automatic ap-
proximation of both syntactic and semantic analy-
sis. Statistical language models (LMs) are used suc-
cessfully in this way in other areas of NLP such as
speech recognition and machine translation. We also
use a standard statistical parser (Charniak, 2000) to
provide syntactic analysis.
In practice, a teacher is likely to be looking for
texts at a particular level rather than classifying a
group of texts into a variety of categories. Thus
we construct one classifier per category which de-
cides whether a document belongs in that category
or not, rather than constructing a classifier which
ranks documents into different categories relative to
each other.
4.1 Statistical Language Models
Statistical LMs predict the probability that a partic-
ular word sequence will occur. The most commonly
used statistical language model is the n-gram model,
which assumes that the word sequence is an (n−1)th
order Markov process. For example, for the com-
mon trigram model where n = 3, the probability of
sequence w is:
P (w) = P (w
1
)P (w
2
|w
1
)
m
i=3
P (w
i
|w
i−1
, w
i−2
).
(1)
The parameters of the model are estimated using a
maximum likelihood estimate based on the observed
frequency in a training corpus and smoothed using
modified Kneser-Ney smoothing (Chen and Good-
man, 1999). We used the SRI Language Modeling
Toolkit (Stolcke, 2002) for language model training.
Our first set of classifiers consists of one n-gram
language model per class c in the set of possible
classes C. For each text document t, we can cal-
culate the likelihood ratio between the probability
given by the model for class c and the probabilities
given by the other models for the other classes:
LR =
P (t|c)P (c)
c
=c
P (t|c
)P (c
)
(2)
where we assume uniform prior probabilities P (c).
The resulting value can be compared to an empiri-
cally chosen threshold to determine if the document
is in class c or not. For each class c, a language
model is estimated from a corpus of training texts.
525
In addition to using the likelihood ratio for classi-
fication, we can use scores from language models as
features in another classifier (e.g. an SVM). For ex-
ample, perplexity (P P) is an information-theoretic
measure often used to assess language models:
P P = 2
H(t|c)
, (3)
where H(t|c) is the entropy relative to class c of a
length m word sequence t = w
1
, , w
m
, defined as
H(t|c) = −
1
m
log
2
P (t|c). (4)
Low perplexity indicates a better match between the
test data and the model, corresponding to a higher
probability P(t|c). Perplexity scores are used as fea-
tures in the SVM model described in Section 4.3.
The likelihood ratio described above could also be
used as a feature, but we achieved better results us-
ing perplexity.
4.2 Feature Selection
Feature selection is a common part of classifier
design for many classification problems; however,
there are mixed results in the literature on feature
selection for text classification tasks. In Collins-
Thompson and Callan’s work (2004) on readabil-
ity assessment, LM smoothing techniques are more
effective than other forms of explicit feature selec-
tion. However, feature selection proves to be impor-
tant in other text classification work, e.g. Lee and
Myaeng’s (2002) genre and subject detection work
and Boulis and Ostendorf’s (2005) work on feature
selection for topic classification.
For our LM classifiers, we followed Boulis and
Ostendorf’s (2005) approach for feature selection
and ranked words by their ability to discriminate
between classes. Given P (c|w), the probability of
class c given word w, estimated empirically from
the training set, we sorted words based on their in-
formation gain (IG). Information gain measures the
difference in entropy when w is and is not included
as a feature.
IG(w) = −
c∈C
P (c) log P (c)
+ P (w)
c∈C
P (c|w) log P (c|w)
+ P ( ¯w)
c∈C
P (c| ¯w) log P (c| ¯w).(5)
The most discriminative words are selected as fea-
tures by plotting the sorted IG values and keeping
only those words below the “knee” in the curve, as
determined by manual inspection of the graph. In an
early experiment, we replaced all remaining words
with a single “unknown” tag. This did not result
in an effective classifier, so in later experiments the
remaining words were replaced with a small set of
general tags. Motivated by our goal of represent-
ing syntax, we used part-of-speech (POS) tags as la-
beled by a maximum entropy tagger (Ratnaparkhi,
1996). These tags allow the model to represent pat-
terns in the text at a higher level than that of individ-
ual words, using sequences of POS tags to capture
rough syntactic information. The resulting vocabu-
lary consisted of 276 words and 56 POS tags.
4.3 Support Vector Machines
Support vector machines (SVMs) are a machine
learning technique used in a variety of text classi-
fication problems. SVMs are based on the principle
of structural risk minimization. Viewing the data as
points in a high-dimensional feature space, the goal
is to fit a hyperplane between the positive and neg-
ative examples so as to maximize the distance be-
tween the data points and the plane. SVMs were in-
troduced by Vapnik (1995) and were popularized in
the area of text classification by Joachims (1998a).
The unit of classification in this work is a single
article. Our SVM classifiers for reading level use the
following features:
• Average sentence length
• Average number of syllables per word
• Flesch-Kincaid score
• 6 out-of-vocabulary (OOV) rate scores.
• Parse features (per sentence):
– Average parse tree height
– Average number of noun phrases
– Average number of verb phrases
– Average number of “SBAR”s.
1
• 12 language model perplexity scores
The OOV scores are relative to the most common
100, 200 and 500 words in the lowest grade level
1
SBAR is defined in the Penn Treebank tag set as a “clause
introduced by a (possibly empty) subordinating conjunction.” It
is an indicator of sentence complexity.
526
(grade 2)
2
. For each article, we calculated the per-
centage of a) all word instances (tokens) and b) all
unique words (types) not on these lists, resulting in
three token OOV rate features and three type OOV
rate features per article.
The parse features are generated using the Char-
niak parser (Charniak, 2000) trained on the standard
Wall Street Journal Treebank corpus. We chose to
use this standard data set as we do not have any
domain-specific treebank data for training a parser.
Although clearly there is a difference between news
text for adults and news articles intended for chil-
dren, inspection of some of the resulting parses
showed good accuracy.
Ideally, the language model scores would be for
LMs from domain-specific training data (i.e. more
Weekly Reader data.) However, our corpus is lim-
ited and preliminary experiments in which the train-
ing data was split for LM and SVM training were
unsuccessful due to the small size of the resulting
data sets. Thus we made use of the Britannica and
CNN articles to train models of three n-gram or-
ders on “child” text and “adult” text. This resulted
in 12 LM perplexity features per article based on
trigram, bigram and unigram LMs trained on Bri-
tannica (adult), Britannica Elementary, CNN (adult)
and CNN abridged text.
For training SVMs, we used the SVM
light
toolkit
developed by Joachims (1998b). Using development
data, we selected the radial basis function kernel
and tuned parameters using cross validation and grid
search as described in (Hsu et al., 2003).
5 Experiments
5.1 Test Data and Evaluation Criteria
We divide the Weekly Reader corpus described in
Section 3 into separate training, development, and
test sets. The number of articles in each set is shown
in Table 3. The development data is used as a test
set for comparing classifiers, tuning parameters, etc,
and the results presented in this section are based on
the test set.
We present results in three different formats. For
analyzing our binary classifiers, we use Detection
Error Tradeoff (DET) curves and precision/recall
2
These lists are chosen from the full vocabulary indepen-
dently of the feature selection for LMs described above.
Grade Training Dev/Test
2 315 18
3 529 30
4 690 38
5 623 34
Table 3: Number of articles in the Weekly Reader
corpus as divided into training, development and test
sets. The dev and test sets are the same size and each
consist of approximately 5% of the data for each
grade level.
measures. For comparison to other methods, e.g.
Flesch-Kincaid and Lexile, which are not binary
classifiers, we consider the percentage of articles
which are misclassified by more than one grade
level.
Detection Error Tradeoff curves show the tradeoff
between misses and false alarms for different thresh-
old values for the classifiers. “Misses” are positive
examples of a class that are misclassified as neg-
ative examples; “false alarms” are negative exam-
ples misclassified as positive. DET curves have been
used in other detection tasks in language processing,
e.g. Martin et al. (1997). We use these curves to vi-
sualize the tradeoff between the two types of errors,
and select the minimum cost operating point in or-
der to get a threshold for precision and recall calcu-
lations. The minimum cost operating point depends
on the relative costs of misses and false alarms; it
is conceivable that one type of error might be more
serious than the other. After consultation with teach-
ers (future users of our system), we concluded that
there are pros and cons to each side, so for the pur-
pose of this analysis we weighted the two types of
errors equally. In this work, the minimum cost op-
erating point is selected by averaging the percent-
ages of misses and false alarms at each point and
choosing the point with the lowest average. Unless
otherwise noted, errors reported are associated with
these actual operating points, which may not lie on
the convex hull of the DET curve.
Precision and recall are often used to assess in-
formation retrieval systems, and our task is similar.
Precision indicates the percentage of the retrieved
documents that are relevant, in this case the per-
centage of detected documents that match the target
527
grade level. Recall indicates the percentage of the
total number of relevant documents in the data set
that are retrieved, in this case the percentage of the
total number of documents from the target level that
are detected.
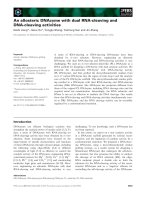
5.2 Language Model Classifier
1 2 5 10 20 40 60 80 90
1
2
5
10
20
40
60
80
90
False Alarm probability (in %)
Miss probability (in %)
grade 2
grade 3
grade 4
grade 5
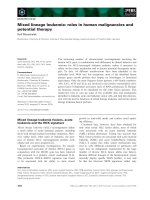
Figure 1: DET curves (test set) for classifiers based
on trigram language models.
Figure 1 shows DET curves for the trigram LM-
based classifiers. The minimum cost error rates for
these classifiers, indicated by large dots in the plot,
are in the range of 33-43%, with only one over 40%.
The curves for bigram and unigram models have
similar shapes, but the trigram models outperform
the lower-order models. Error rates for the bigram
models range from 37-45% and the unigram mod-
els have error rates in the 39-49% range, with all but
one over 40%. Although our training corpus is small
the feature selection described in Section 4.2 allows
us to use these higher-order trigram models.
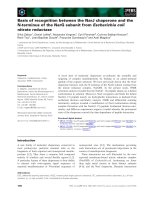
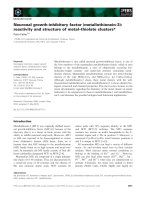
5.3 Support Vector Machine Classifier
By combining language model scores with other fea-
tures in an SVM framework, we achieve our best
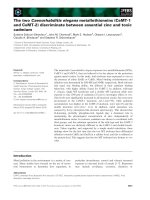
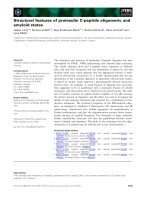
results. Figures 2 and 3 show DET curves for this
set of classifiers on the development set and test
set, respectively. The grade 2 and 5 classifiers have
the best performance, probably because grade 3 and
4 must be distinguished from other classes at both
higher and lower levels. Using threshold values se-
lected based on minimum cost on the development
1 2 5 10 20 40 60 80 90
1
2
5
10
20
40
60
80
90
False Alarm probability (in %)
Miss probability (in %)
grade 2
grade 3
grade 4
grade 5
Figure 2: DET curves (development set) for SVM
classifiers with LM features.
1 2 5 10 20 40 60 80 90
1
2
5
10
20
40
60
80
90
False Alarm probability (in %)
Miss probability (in %)
grade 2
grade 3
grade 4
grade 5
Figure 3: DET curves (test set) for SVM classifiers
with LM features.
set, indicated by large dots on the plot, we calcu-
lated precision and recall on the test set. Results are
presented in Table 4. The grade 3 classifier has high
recall but relatively low precision; the grade 4 classi-
fier does better on precision and reasonably well on
recall. Since the minimum cost operating points do
not correspond to the equal error rate (i.e. equal per-
centage of misses and false alarms) there is variation
in the precision-recall tradeoff for the different grade
level classifiers. For example, for class 3, the oper-
ating point corresponds to a high probability of false
alarms and a lower probability of misses, which re-
sults in low precision and high recall. For operating
points chosen on the convex hull of the DET curves,
the equal error rate ranges from 12-25% for the dif-
528
Grade Precision Recall
2 38% 61%
3 38% 87%
4 70% 60%
5 75% 79%
Table 4: Precision and recall on test set for SVM-
based classifiers.
Grade Errors
Flesch-Kincaid Lexile SVM
2 78% 33% 5.5%
3 67% 27% 3.3%
4 74% 26% 13%
5 59% 24% 21%
Table 5: Percentage of articles which are misclassi-
fied by more than one grade level.
ferent grade levels.
We investigated the contribution of individual fea-
tures to the overall performance of the SVM clas-
sifier and found that no features stood out as most
important, and performance was degraded when any
particular features were removed.
5.4 Comparison
We also compared error rates for the best per-
forming SVM classifier with two traditional read-
ing level measures, Flesch-Kincaid and Lexile. The
Flesch-Kincaid Grade Level index is a commonly
used measure of reading level based on the average
number of syllables per word and average sentence
length. The Flesch-Kincaid score for a document is
intended to directly correspond with its grade level.
We chose the Lexile measure as an example of a
reading level classifier based on word lists.
3
Lexile
scores do not correlate directly to numeric grade lev-
els, however a mapping of ranges of Lexile scores to
their corresponding grade levels is available on the
Lexile web site (Lexile, 2005).
For each of these three classifiers, Table 5 shows
the percentage of articles which are misclassified by
more than one grade level. Flesch-Kincaid performs
poorly, as expected since its only features are sen-
3
Other classifiers such as Dale-Chall do not have automatic
software available.
tence length and average syllable count. Although
this index is commonly used, perhaps due to its sim-
plicity, it is not accurate enough for the intended
application. Our SVM classifier also outperforms
the Lexile metric. Lexile is a more general measure
while our classifier is trained on this particular do-
main, so the better performance of our model is not
entirely surprising. Importantly, however, our clas-
sifier is easily tuned to any corpus of interest.
To test our classifier on data outside the Weekly
Reader corpus, we downloaded 10 randomly se-
lected newspaper articles from the “Kidspost” edi-
tion of The Washington Post (2005). “Kidspost” is
intended for grades 3-8. We found that our SVM
classifier, trained on the Weekly Reader corpus, clas-
sified four of these articles as grade 4 and seven ar-
ticles as grade 5 (with one overlap with grade 4).
These results indicate that our classifier can gener-
alize to other data sets. Since there was no training
data corresponding to higher reading levels, the best
performance we can expect for adult-level newspa-
per articles is for our classifiers to mark them as the
highest grade level, which is indeed what happened
for 10 randomly chosen articles from standard edi-
tion of The Washington Post.
6 Conclusions and Future Work
Statistical LMs were used to classify texts based
on reading level, with trigram models being no-
ticeably more accurate than bigrams and unigrams.
Combining information from statistical LMs with
other features using support vector machines pro-
vided the best results. Future work includes testing
additional classifier features, e.g. parser likelihood
scores and features obtained using a syntax-based
language model such as Chelba and Jelinek (2000)
or Roark (2001). Further experiments are planned
on the generalizability of our classifier to text from
other sources (e.g. newspaper articles, web pages);
to accomplish this we will add higher level text as
negative training data. We also plan to test these
techniques on languages other than English, and in-
corporate them with an information retrieval system
to create a tool that may be used by teachers to help
select reading material for their students.
529
Acknowledgments
This material is based upon work supported by the National Sci-
ence Foundation under Grant No. IIS-0326276. Any opinions,
findings, and conclusions or recommendations expressed in this
material are those of the authors and do not necessarily reflect
the views of the National Science Foundation.
Thank you to Paul Heavenridge (Literacyworks), the Weekly
Reader Corporation, Regina Barzilay (MIT) and Noemie El-
hadad (Columbia University) for sharing their data and corpora.
References
R. Barzilay and N. Elhadad. Sentence alignment for monolin-
gual comparable corpora. In Proc. of EMNLP, pages 25–32,
2003.
C. Boulis and M. Ostendorf. Text classification by aug-
menting the bag-of-words representation with redundancy-
compensated bigrams. Workshop on Feature Selection in
Data Mining, in conjunction with SIAM conference on Data
Mining, 2005.
P. Bylsma, L. Ireland, and H. Malagon. Educating English Lan-
guage Learners in Washington State. Office of the Superin-
tendent of Public Instruction, Olympia, WA, 2003.
J.S. Chall and E. Dale. Readability revisited: the new Dale-
Chall readability formula. Brookline Books, Cambridge,
Mass., 1995.
E. Charniak. A maximum-entropy-inspired parser. In Proc. of
NAACL, pages 132–139, 2000.
C. Chelba and F. Jelinek. Structured Language Modeling.
Computer Speech and Language, 14(4):283-332, 2000.
S. Chen and J. Goodman. An empirical study of smoothing
techniques for language modeling. Computer Speech and
Language, 13(4):359–393, 1999.
K. Collins-Thompson and J. Callan. A language model-
ing approach to predicting reading difficulty. In Proc. of
HLT/NAACL, pages 193–200, 2004.
R. Gunning. The technique of clear writing. McGraw-Hill,
New York, 1952.
C W. Hsu et al. A practical guide to support vector classi-
fication. />papers/guide/guide.pdf, 2003. Accessed 11/2004.
T. Joachims. Text categorization with support vector machines:
learning with many relevant features. In Proc. of the Eu-
ropean Conference on Machine Learning, pages 137–142,
1998a.
T. Joachims. Making large-scale support vector machine learn-
ing practical. In Advances in Kernel Methods: Support Vec-
tor Machines. B. Sch
¨
olkopf, C. Burges, A. Smola, eds. MIT
Press, Cambridge, MA, 1998b.
J.P. Kincaid, Jr., R.P. Fishburne, R.L. Rodgers, and
B.S. Chisson. Derivation of new readability formulas for
Navy enlisted personnel. Research Branch Report 8-75, U.S.
Naval Air Station, Memphis, 1975.
Y B. Lee and S.H. Myaeng. Text genre classification with
genre-revealing and subject-revealing features. In Proc. of
SIGIR, pages 145–150, 2002.
The Lexile framework for reading. ile.
com, 2005. Accessed April 15, 2005.
A. Martin, G. Doddington, T. Kamm, M. Ordowski, and
M. Przybocki. The DET curve in assessment of detection
task performance. Proc. of Eurospeech, v. 4, pp. 1895-1898,
1997.
A. Ratnaparkhi. A maximum entropy part-of-speech tagger. In
Proc. of EMNLP, pages 133–141, 1996.
B. Roark. Probabilistic top-down parsing and language model-
ing. Computational Linguistics, 27(2):249-276, 2001.
L. Si and J.P. Callan. A statistical model for scientific readabil-
ity. In Proc. of CIKM, pages 574–576, 2001.
A.J. Stenner. Measuring reading comprehension with the Lex-
ile framework. Presented at the Fourth North American Con-
ference on Adolescent/Adult Literacy, 1996.
A. Stolcke. SRILM - an extensible language modeling toolkit.
Proc. ICSLP, v. 2, pp. 901-904, 2002.
U.S. Department of Education, National Center for Ed-
ucational Statistics. The condition of education.
/>section1/indicator04.asp, 2003. Accessed June
18, 2004.
U.S. Department of Education, National Center for Educational
Statistics. NCES fast facts: Bilingual education/Limited
English Proficient students. />fastfacts/display.asp?id=96, 2003. Accessed
June 18, 2004.
V. Vapnik. The Nature of Statistical Learning Theory. Springer,
New York, 1995.
The Washington Post. hingtonpost.
com, 2005. Accessed April 20, 2005.
Weekly Reader. ,
2004. Accessed July, 2004.
Western/Pacific Literacy Network / Literacyworks. CNN
SF learning resources. />cnnsf/, 2004. Accessed June 15, 2004.
530