Tài liệu Higher economic growth through macroeconomic policy coordination? The combination of wage policy and monetary policy docx
Bạn đang xem bản rút gọn của tài liệu. Xem và tải ngay bản đầy đủ của tài liệu tại đây (407.09 KB, 31 trang )
econstor
www.econstor.eu
Der Open-Access-Publikationsserver der ZBW – Leibniz-Informationszentrum Wirtschaft
The Open Access Publication Server of the ZBW – Leibniz Information Centre for Economics
Nutzungsbedingungen:
Die ZBW räumt Ihnen als Nutzerin/Nutzer das unentgeltliche,
räumlich unbeschränkte und zeitlich auf die Dauer des Schutzrechts
beschränkte einfache Recht ein, das ausgewählte Werk im Rahmen
der unter
→ />nachzulesenden vollständigen Nutzungsbedingungen zu
vervielfältigen, mit denen die Nutzerin/der Nutzer sich durch die
erste Nutzung einverstanden erklärt.
Terms of use:
The ZBW grants you, the user, the non-exclusive right to use
the selected work free of charge, territorially unrestricted and
within the time limit of the term of the property rights according
to the terms specified at
→ />By the first use of the selected work the user agrees and
declares to comply with these terms of use.
zbw
Leibniz-Informationszentrum Wirtschaft
Leibniz Information Centre for Economics
Gern, Klaus-Jürgen; Meier, Carsten-Patrick; Scheide, Joachim
Working Paper
Higher economic growth through macroeconomic
policy coordination? The combination of wage policy
and monetary policy
Kieler Diskussionsbeiträge, No. 399
Provided in Cooperation with:
Kiel Institute for the World Economy (IfW)
Suggested Citation: Gern, Klaus-Jürgen; Meier, Carsten-Patrick; Scheide, Joachim (2003) :
Higher economic growth through macroeconomic policy coordination? The combination of wage
policy and monetary policy, Kieler Diskussionsbeiträge, No. 399, ISBN 3894562463
This Version is available at:
/> KIELER DISKUSSIONSBEITRÄGE
399 KIEL DISCUSSION PAPERS
Higher Economic Growth through Macroeconomic
Policy Coordination? The Combination of Wage
Policy and Monetary Policy
by Klaus-Jürgen Gern, Carsten-Patrick Meier and Joachim Scheide
CONTENTS
Strengthening potential output is high on the agenda
for economic policy in the European Union. While
there is widespread agreement that structural policies
have a positive impact on long-term growth, there is a
controversial discussion whether coordination of mac-
roeconomic policies can contribute to this goal.
Against the background of the new economic condi-
tions in the euro area, we analyze what could be
gained from a combination of wage policy and mone-
tary policy.
Using a small theoretical macroeconomic model, we
show that coordination between wage policy and
monetary policy can be beneficial under certain as-
sumptions. A policy of sustained wage moderation re-
sults in an increase in employment and potential out-
put. Assuming that expectations are not completely
forward-looking and prices are sticky, the upward shift
in potential output will not be matched by a similar in-
crease in aggregate demand. To prevent an output
gap from emerging, the optimal monetary policy is to
lower interest rates. However, a central bank aiming
at price stability will only do so when the announce-
ment of a policy of sustained wage moderation is
credible.
Simulations with a large macroeconometric multi-
country model confirm that a coordination of German
wage policy and ECB monetary policy would help to
realize the beneficial effects of wage moderation
somewhat faster, although the quantitative effect is re-
latively small. The long-run gain in employment would
accrue regardless of a coordination with monetary
policy. According to the simulations, employment in
Germany would increase by about 750,000 persons in
the long run if wages increase one percentage point
slower than usual over a period of five years.
Frequently, countries with a particularly positive eco-
nomic development are said to have benefited from a
coordination of macroeconomic policies. However,
only a small part of the growth and employment suc-
cess in these countries can be accounted for such a
coordination. In the case of the United States, it is
hard to see any evidence of ex ante policy coordina-
tion at all. In the Netherlands and in Ireland, a con-
sensual strategy of wage restraint for improving the
competitiveness of the economy and stimulating em-
ployment has been a significant factor of the econom-
ic success. It was important in both cases that signifi-
cant supply side reforms were implemented by the
governments at the same time, whereas monetary
policy played no active role.
Coordination of macro policies is severely compli-
cated by the pronounced differences in national wage
bargaining systems. The systems would have to be
harmonized and centralized to create a single Euro-
pean wage policy. It is, however, unlikely that centrally
designed harmonization of labor market institutions in
the EU can cope with the differences across Euroland
regarding productivity and employment.
In the framework of the European Union, the pre-
sumed positive effects of policy coordination are
stressed over and over again, for example in the
Broad Economic Policy Guidelines. However, clear
definitions and mechanisms how such a coordination
can be achieved are missing. The fundamental diffi-
culty concerning a coordination between wage policy
and monetary policy arises from two facts: First, there
is no such thing as “the” wage policy at the European
level. Second, the statute of the ECB does not allow a
binding commitment by the central bank.
This does not mean, however, that the ECB would not
take account of what is happening, for example, to
wage developments. According to the monetary policy
strategy, it should react if there is an increase in the
growth rate of potential output as a result of wage mo-
deration. For example: If the social partners in a large
country such as Germany give a credible signal that
wage increases will be moderate for several years,
the ECB could accommodate this change. However,
such a strategy cannot be reversed in that the ECB
moves first hoping that wage moderation will follow.
INSTITUT FÜR WELTWIRTSCHAFT KIEL
•
Februar 2003
Contents
1 What Does Coordination Mean? 3
2 The Effects of Macroeconomic Policy Coordination
4
2.1 Policy Coordination in a Small Theoretical Model 5
2.2 The Quantitative Impact of Coordinating Wage and Monetary Policy – Simulations
with a Macroeconometric Model 7
2.2.1 The NiGEM Model 8
2.2.2 Estimating the Effects of Coordination between Wage Policy and Monetary
Policy 10
2.3 Summary 15
3 International Experience with Macroeconomic Coordination 16
3.1 United States: Prolonged Expansion without Coordination 16
3.2 The Netherlands: Success by Consensus 17
3.3 Ireland: Consensual Fiscal Consolidation and Wage Restraint 19
3.4 Summary 21
4 Coordination under the Conditions of the European Union 21
4.1 Nationally Diversified Wage Setting Processes 22
4.2 Summary 24
5 Conclusions for Economic Policy 25
6 References
27
This paper summarizes the results of the research project “Möglichkeiten zur Stärkung des Potentialwachstums
durch den Einsatz makroökonomischer Instrumente” commissioned by the German Federal Ministry of Finance.
1 What Does Coordination Mean?
Strengthening potential output growth is high on
the agenda for economic policy in the European
Union. In the economic literature there is, of
course, a dispute on how this target of high
growth may be achieved. The discussion wheth-
er a coordination of macroeconomic policies can
contribute to higher growth of potential output is
subject of the present paper. We explore the pos-
sibilities against the background of the new eco-
nomic setup in the euro area: While there is a
single monetary policy, other areas of economic
policy are left to policy makers at the national
level. There is a large amount of statements
stressing coordination in the EU, such as in the
Broad Economic Policy Guidelines (BEPG).
1
Our focus is on wage developments on the one
hand and monetary policy on the other. In this
context, we sometimes refer to “wage policy,” a
term which is commonly used in Germany but
not in many other countries.
Given this framework, a few other prelimina-
ry remarks may be necessary at the outset. First
of all, we focus on potential output growth. This
means that we do not discuss issues of short-
term macroeconomic stabilization policies in the
context of coordination although our results will
have implications for such questions as well.
Furthermore, while there is a large variety of de-
finitions for potential output or related meas-
ures,
2
we define this variable as “ the sustain-
able aggregate supply capabilities of an econ-
omy, as determined by the structure of produc-
tion, the state of technology and the available in-
puts” (ECB 2000a: 37). This is a generally ac-
cepted economic interpretation, as opposed to
definitions of capacity output in a technical
sense. By using the term “sustainable,” this defi-
nition expresses the condition that an accelera-
tion of inflation is excluded. For example, in
1
The BEPG are updated annually. For 2002, see Euro-
pean Commission (2002a).
2
In the literature, concepts of equilibrium output, natu-
ral output, normal output, trend output etc. are often
used interchangeably although they may have different
meanings and policy implications. The same holds for
definitions related to unemployment (natural, equilib-
rium, NAIRU etc.).
most models an expansionary monetary policy
typically leads to higher investment; the conse-
quent increase of the capital stock, however, is
not sustainable as this policy leads to more infla-
tion. Finally, our paper takes as given that many
measures of structural policies which raise the
efficiency and the flexibility in a market econo-
my have a positive impact on potential output.
This applies also to fiscal policy which can con-
tribute to higher potential output by cutting taxes
and cutting unproductive government expendi-
tures.
Given these preliminaries, the paper is orga-
nized as follows. In Section 2, we start to dis-
cuss the coordination issue in a simple theoretic-
al macroeconomic model which covers both the
demand side and the supply side of the economy
and in which the effects of macro policies are
demonstrated in benchmark simulations. The
model is then used to discuss the changes of im-
portant variables if the policy measures are not
taken individually but are coordinated. In parti-
cular, we interpret wage moderation as a posI-
tive supply shock. In the next step, we look at
the effects on output if monetary policy re-
sponds to this shock in an ideal fashion, i.e., we
assume that the central bank has full knowledge
about the size and the nature of this shock. The
quantitative effects of wage moderation are then
estimated on the basis of a large macroeconome-
tric model (NiGEM). Here, too, we analyze the
effects of the wage shock in Germany combined
with alternative strategies for monetary policy in
the euro area.
These simulations are supplemented by an
analysis of the experience of other countries in
Section 3. The examples of the United States,
the Netherlands and Ireland are chosen because
these countries have experienced a very good
performance in recent years. In particular, we
discuss whether this success in terms of higher
potential output growth was due to macroeco-
nomic policy coordination. In Section 4, we ex-
plore the possibilities of macroeconomic policy
coordination within the framework of the Euro-
pean Union. As monetary policy plays an im-
4
portant role for such an analysis, we discuss
whether the European Central Bank (ECB)
could be included in such a process. As far as
wages are concerned, it seems important to dis-
cuss whether a coordination of wage develop-
ments on the European level is realistic; in this
context we describe the different institutional ar-
rangements of wage setting in individual coun-
tries. A brief summary of the findings is given in
Section 5 where we draw some conclusions for
economic policy.
2 The Effects of Macroeconomic Policy Coordination
There is a widespread consensus that potential
output is determined by structural factors.
Among these the most important are the institu-
tional framework, technological progress and
factor inputs. The former two factors can raise
potential output growth by increasing efficiency.
Technological progress is especially dependent
on the formation of human capital and an envi-
ronment which is conducive to innovations. As
far as labor and capital inputs are concerned,
sufficient incentives to work and the profitabil-
ity of investment are essential.
Macroeconomic instruments can contribute to
a stronger growth of potential output in various
ways. The main contribution of monetary policy
is to maintain price level stability and to reduce
the fluctuations of inflation. Monetary policy
alone cannot raise potential output. In fact, a
sustained expansionary monetary policy would
be counterproductive, as it would lead to higher
inflation which distorts the resource allocation
via prices. In contrast, fiscal policy can stimulate
potential output growth by lowering taxes and
duties on factor incomes and cutting subsidies in
order to reduce distortions of private decisions
and thus increase overall efficiency. However,
these measures are normally not regarded as
macroeconomic policies since they are intended
to change behavior at the microeconomic level.
Short-run variations of the structural budget
deficit, which are usually regarded as the mac-
roeconomic part of fiscal policy, will affect
long-run economic growth. Fiscal policy should
therefore not try to fine-tune the economy.
Given the high number of unemployed in
Germany and in the euro area, there is, however,
scope for wage policy – possibly combined with
structural reforms on the labor market and a
move to more wage differentiation – to increase
potential output growth. A policy of wage mod-
eration which would imply that real wages grow
less than labor productivity for an extended pe-
riod of time would result in higher labor demand
and consequently higher labor input in aggregate
production and an upward shift in potential out-
put.
However, it may be the case that this increase
in potential output is initially not matched by an
increase of demand by the same amount. In such
a situation, a negative output gap would arise
and inflation would fall below the target of the
central bank. Central bank intervention could
prevent this. By lowering interest rates, mone-
tary policy could raise aggregate demand to the
level of aggregate supply and thus stabilize GDP
and inflation. What makes such a reaction diffi-
cult for the central bank, however, is that an in-
crease of potential output cannot be observed di-
rectly. It usually becomes apparent in the mac-
roeconomic data only after a substantial period
of time.
Here coordination between macroeconomic
policies comes into play. Social partners could
bridge the information gap of the central bank,
in that they make clear that they have embarked
on a policy of sustained wage moderation. If
such a statement is credible, the monetary au-
thorities can infer from it that potential output
will rise in the future and can act accordingly,
which may include lowering interest rates even
before the increase is observed. Credibility of
the announcement is, however, important. Mon-
etary authorities will only be inclined to lower
interest rates if they can be sufficiently confident
that an upward shift in potential output has in
fact occurred. If the announcement of the social
5
partners is not credible, the central bank will
take a wait-and-see attitude and react only when
the shift in potential output can be observed in
the data. In this case, the economy experiences
more macroeconomic instability than with a
credible announcement. Coordination between
wage policy and monetary policy, in this view,
implies a credible announcement of wage policy
regarding its future course.
2.1 Policy Coordination in a Small
Theoretical Model
To illustrate this idea of macroeconomic coordi-
nation, we use a small dynamic macro model.
The closed-economy model consists of an equa-
tion for aggregate demand, an equation for price
adjustment dynamics in the goods market, a
condition of equilibrium for the money market
and an equation for production potential. The
model is formulated in discrete time and is de-
noted by the following equations:
(1) Aggregate demand:
()
tt
piy ∆−=
α
(2) Production potential:
1−
+=
tt
xx
ω
Α
(3) Price adjustment hypothesis:
()
∑
=
−
+−=
n
i
itittt
pxyp
1
,
κβ
(4) Money market equilibrium:
tttt
iypm
γ
−=−
.
The variables are denoted as follows: y: ag-
gregate demand, x: production potential, i: nom-
inal interest rate, p: aggregate price level, m:
nominal money supply.
α
,
β
,
ω
,
κ
,
γ
,
Α
are para-
meters. With the exception of the nominal inter-
est rate i, lower-case Latin letters represent the
natural logarithms of the macroeconomic vari-
ables.
Equation (1) describes aggregate demand for
goods as depending on the real interest rate,
tt
pi ∆−
. Real interest rates affect aggregate de-
mand via private investment activity and the in-
come effect, but it is also conceivable that pri-
vate consumption of durable consumer goods is
influenced by the real rate of interest. Potential
output,
t
x
, given in (2), is assumed to be influ-
enced predominantly by factors which do not
depend on cyclical dynamics and are conse-
quently regarded as exogenous in this model.
These are summarized for simplicity in A. In the
numeric simulations for the economic model
implemented in the following section, A is
treated as a shock variable, representing changes
in the determinants of production potential, trig-
gered for example by wage and labor market
policy measures. The model assumes that chan-
ges in potential output do not occur instantane-
ously; instead, it takes several periods before the
shocks exert their full effect on production po-
tential.
In (3) the assumptions of the model with re-
gard to the dynamics of price adjustment on the
goods market are formalized. The equation indi-
cates that the aggregate price level,
t
p
, depends
positively
)0( >
β
on the difference between
aggregate demand for goods,
t
y
, and aggregate
supply of goods,
t
x
, that is on the output gap,
tt
xy
−
. By including lags the equation accounts
for the fact that, in reality, price adjustments are
usually serially correlated due to longer-term
contracts.
Money market equilibrium is represented by
(4). The supply of money,
t
m
, deflated with an
aggregate price level and exogenously given by
the domestic central bank, equals the demand
for money which depends on aggregate demand
for goods and the nominal interest rate,
t
i
.
While this dependence of the demand for money
on income encapsulates the transactions motive,
the domestic rate of interest reflects the oppor-
tunity costs of holding cash. Consequently,
0>
γ
applies.
Policy Rules for the Reaction of Monetary Pol-
icy to an Upward Shift of Potential Output
To analyze the potential benefits of macroeco-
nomic coordination, the model is simulated un-
der alternative assumptions regarding the reac-
tion of monetary policy. Starting point in all
simulation exercises is a given exogenous shock
6
on production potential, caused by wage and la-
bor market policies which increase efficiency.
3
This is represented by a permanent increase in
the size of
A, which, with some delay, affects
actual production potential
t
x
. The central bank
now reacts to this shift in potential output by
following different rules for the money supply.
Under the first rule, monetary policy does not
react to the supply shock at all:
(5)
., tmm
t
∀=
The central bank does not consider the supply
disturbance in its decisions and thus keeps the
money supply constant in all periods t .
Under the second rule, the money supply is
linked directly to potential output, that is
4
(6)
tt
xm = .
In this case, the central bank reacts immedi-
ately to the supply shock with a proportional ex-
pansion of money supply. This, of course, re-
quires the bank to have information on the up-
ward shift of potential output. Since the latter is
not observable, the only way the bank can get it
is from a credible announcement of the wage
policy authorities. So in a way, (6) represents
the “full coordination” case.
Finally, we analyze an intermediate case,
where money supply is increased in proportion
to potential output, but only with a substantial
delay of k periods:
(7)
ktt
xm
−
= ,
1≥k
.
The delay arises from the fact that the central
bank only acts after information on increased
potential output appears in the data. The delay
will be influenced by the degree of credibility of
the announcement of the wage policy authori-
3
The cause of the increase in production potential is ir-
relevant for the further analysis. The increase could
also be caused by a favorable fiscal policy or other ex-
ogenous factors.
4
In reality, the trend change of velocity and the central
bank’s target rate of inflation should also be taken into
account when formulating a money supply rule. For
the sake of simplicity, this model assumes a constant
value of 1 for velocity and a value of 0 for the target
rate of inflation.
ties. The lower the credibility, the longer will
the central bank wait in order to see data that
convinces it that wage policy is in fact moderate
and the upward shift in potential output can be
expected.
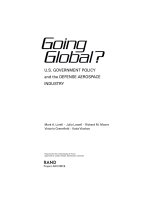
Results of the Model Analysis
The results of the dynamic simulations are pre-
sented in Figure 1.
5
The upper part shows the re-
action of the output gap under alternative mone-
tary rules. It is largest when money supply is not
adapted to higher potential output. In this case,
there is at first no stimulus to demand, so a rela-
tive large negative output gap arises. With some
delay prices then start to fall and inflation falls
below the central bank’s target level (lower part
of Figure 1). The fall in the price level increases
real money supply and thus lowers the interest
rate. As the interest rate decreases, aggregate de-
mand rises and the output gap diminishes. Even-
tually, the new equilibrium is reached where in-
flation is on target and the output gap is closed.
In the case the central bank reacts immedi-
ately to the change in potential output by raising
the money supply by the same magnitude, inter-
est rates fall immediately. Aggregate demand is
thus increased and as a result the output gap is
far smaller and inflation deviates less from the
central bank’s target than in the first scenario.
In the intermediate case, where the central
bank waits for k periods – for the simulation we
assumed k = 4 – the output gap first falls for the
first k periods as strongly as under the first sce-
nario. Then the monetary authorities increase the
money supply, the interest rate falls and aggre-
gate demand starts increasing. So from that
point onwards, the absolute output gap is smal-
ler than under the first scenario and converges
even faster to equilibrium than under the second
scenario. The reason is that in addition to the in-
crease in nominal money supply engineered by
the central bank, interest rates fall even more
than
in the second scenario by the fall in the
price level and the ensuing increase in the real
money supply.
5
The following parameterization was used for the
model simulations: ;5.0;2.0;5.0 ==−=
γβα
;2.0;8.0
21
==
κκ
8.0
=
ω
.
7
Figure 1: Effect of an Increase of Production Potential on the Output Gap and Inflation under Alternative Rules for Money
Supply
0
10
20
30 40 50 60 70
80
0.0
–
0.5
–
1.0
–
1.5
–
2.0
–
2.5
Immediate proportional increase
N
o change in money suppl
y
Proportional increase after 4 periods
0
10
20
30 40 50 60 70
80
0.0
–
0.5
–
1.0
–
1.5
Output gap
Deviation of the inflation rate from its target
Period
Period
Immediate proportional increase
N
o change in money suppl
y
Proportional increase after 4 periods
2.2 The Quantitative Impact of
Coordinating Wage and Monetary
Policies – Simulations with a
Macroeconometric Model
The previous section clarified the potential for
coordinating wage policy and monetary policy.
The results, however, were deduced from a very
simplified theoretical model. No conclusions
can be drawn for the realistic, anticipated mag-
nitude of the effects of the different policy sce-
narios, although this is required for a compre-
hensive evaluation of the scenarios. Conse-
quently, in the present section, the analytical ap-
paratus has been changed. Instead of using a
small theoretical model, we will investigate the
effects of coordinating wage and monetary poli-
cies as part of a detailed macroeconometric
model whose estimated parameters are based on
empirical data, the NiGEM model. The advan-
tage of this model’s realistic nature comes with
the disadvantage of having less transparency and
that results are strongly influenced by the
8
model’s theoretical “philosophy,” which is not
completely identical to the theoretical analysis
in the previous section in all cases.
The NiGEM model was developed by the Na-
tional Institute of Economic and Social Research
(NIESR). The following will first provide a
short presentation of the model and clarify the
parts of the model relevant for the simulations.
After that the results of a policy of sustained
wage moderation in Germany for GDP growth,
employment and other variables will be presen-
ted for the both cases of coordination and no co-
ordination between wage policy and monetary
policy.
2.2.1 The NiGEM Model
The NiGEM model is a comprehensive structu-
ral macroeconometric model of the world econ-
omy. It consists of interlinked submodels for all
important industrial countries or regions – in-
cluding Germany and the euro area – and for a
number of emerging markets and developing
countries, each with a complete demand and
supply side. In the current version there are
about 3,000 equations (NIESR 2001).
The macroeconomic philosophy of the model
follows the new-Keynesian approach, which has
emerged as a consensus of the academic debate
in the past years (Clarida et al. 1999) and on
which the theoretical model is also based. A
crucial characteristic of this approach is that
prices only have a delayed reaction to exoge-
nous changes. Economic agents have rational
(model-consistent) expectations (Barrell et al.
1993).
6
6
NiGEM is regularly used by the National Institute for
producing quarterly forecasts of the world economy.
In addition, the model can be used to simulate the ef-
fects of various exogenous shocks, such as changes in
the exchange rate or the price of raw materials as well
as monetary and fiscal policy measures or other eco-
nomic policy shocks. Since all countries in the euro
area are represented, NiGEM is one of the few mac-
roeconometric models which allows monetary policy
issues and macroeconomic coordination within the
euro area to be quantitatively examined. Barrell and
Whitley (1992) used the model to analyze the issue of
policy coordination in connection with the European
Currency System, Barrell et al. (1993) investigated the
impact of Maastricht criteria on employment and in-
terest rates in Europe and Barrell and Pain (1996) used
the model to simulate how the European Monetary
Determining GDP: The Demand Side of the
Model
The NiGEM model follows standard practice in
modeling aggregate demand in the respective
national economies, along the lines of the natio-
nal accounts. The starting point is the identity
equation according to which gross domestic pro-
duct is the result of private consumption expen-
diture, government consumption, investment,
stock building and net trade in goods and servi-
ces (exports less imports).
Government consumption is fixed exogenous-
ly by fiscal policy. For each of the remaining de-
mand components there is a stochastic behavio-
ral equation. In the model, private consumption
is determined by real disposable income of pri-
vate households, short-term interest rates (3
months), consumer prices and the aggregate as-
sets of private households. Investment is deter-
mined by the capital stock and the costs of capi-
tal utilization, whereby separate functions are
estimated for housing investment and other in-
vestments. For stock building, a dependency on
the short-term interest rate, on consumer prices
and on gross domestic product is assumed. Im-
ports are linked to domestic final demand and
the price competitiveness of the domestic econo-
my, exports are linked to import demand in the
trading partner country and price competitive-
ness. The price competitiveness is derived from
effective, country-specific exchange rates which
are based on the regional foreign trade structure
of the respective country. In general, NiGEM
models foreign trade integration among the indi-
vidual countries in great detail in order to guar-
antee the most precise picture of international
business cycle transmissions. However, since
this aspect is of lesser importance for our inves-
tigation, it will not be the subject of further exa-
mination.
Production Potential
In NiGEM, production potential is represented
by a macroeconomic production function with
constant
elasticity of substitution (CES func-
Union affect employment. Also see Barrell, Morgan
and Pain (1996), Barrell and Sefton (1995) and
Barrell, Pain and Sefton (1996).
9
tion). Production factors are labor and capital.
The production function shows constant returns
to scale. Labor-augmenting technical progress
(represented by
λ
) assumed, this function can be
written as:
(8)
()
()
[]
,e1
1
ρ
ρ
λρ
δδγ
−
−
−
−+=
t
LKY
where K and L stand for production factors
capital and labor (measured in hours per em-
ployee),
γ
and
δ
are the scale parameters of the
production function and the elasticity of substi-
tution is
σ
= 1/(1+
ρ
). For
ρ
= 0, the constant
elasticity of substitution is 1 and it represents a
Cobb–Douglas production function.
Production potential X results from the pro-
duction function (8) if its potential value L* is
used for labor input. The latter is defined as
(9)
***
)1( HUEL −= ,
where E stands for the number of employees, H*
for the potential or equilibrium number of hours
per employee and U* for the “natural” level of
unemployment. Potential labor input is derived
as a product of potential employment (calculated
as the number of employees less natural unem-
ployment) and the equilibrium number of work-
ing hours per employee. The latter is assumed to
be decreasing exogenously at a declining rate.
The Labor Market
The labor market, which also determines the
natural level of unemployment, is represented in
NiGEM as follows. Demand for labor is deter-
mined in a profit-maximizing representative
firm, which demands labor services until the
marginal product of labor corresponds to the real
wage. Formally, the labor demand function is
derived by differentiating the production func-
tion (8) with respect to labor, the result (the
marginal product of labor) is equated with the
real wage and this expression is solved for L (lo-
garithmic representation):
(10)
t
P
W
Y
L
λσσα
)1(lnln −−−= ,
where W/P stands for real employee remunera-
tion per hour.
7
Accordingly, aggregate econom-
ic demand for labor is a negative function of real
wages and the rate of (labor-augmenting) techni-
cal progress.
Nominal wages are determined as part of a
negotiation process between unions and employ-
er representatives. The magnitude of the wage
increase depends on the relative negotiating
power of the unions, which again depends on the
cyclical situation, labor productivity, the level of
unemployment and the expectations concerning
future inflation. From an ex post perspective, the
real wage is, therefore, the higher, the higher the
level of labor productivity and the smaller the
level of unemployment, that is
(11)
U
L
Y
P
W
βµ
−+= lnln
.
The demand for labor function and the wage
settlement function together produce a natural
rate of unemployment, U*: When (11) is sub-
stituted for (10) and then solved for the rate of
unemployment, one is left with the following
expression:
(12)
⎥
⎦
⎤
⎢
⎣
⎡
+−
⎟
⎠
⎞
⎜
⎝
⎛
−
−
=
µ
σ
α
λ
σ
σ
β
t
L
Y
U
11
*
.
In the special case, where
1=
σ
, the constant
parameters of the labor demand function and the
wage settlement function alone determine the
natural rate of unemployment. In general cases,
where
1
≠
σ
, labor productivity, the rate of
technical advancement and substitution elastic-
ity also play a role.
Prices
In the NiGEM model, consumer price levels are
determined by import prices, production costs
and a profit markup, which depends on the de-
gree of capacity utilization. Production costs are
a function of wage costs per employee and of
capital utilization costs. The latter is calculated
7
In NiGEM, wages are regarded as net wages less em-
ployer contributions to social security, that is em-
ployer remuneration.
10
from the long-term real interest rate, adjusted for
the effects of taxation.
Monetary Policy Rules
Interest rates are determined as part of monetary
policy. In the NiGEM model, changes in the rate
of interest have – as in the theoretical model
above – effects on aggregate demand, both via
the real-balance effect and via the exchange rate:
A cut in interest rates results in a temporary real
depreciation of the domestic currency and,
thereby, improves the price competitiveness of
domestic manufacturers.
The model facilitates the simulation of a
number of rules for the ECB. These rules deter-
mine which target variables the central bank is
aiming at with its interest rate policy, in order to
attain a long-term stabilization of price levels or
of interest rates. In addition they establish by
how much the interest rate should be changed
when the target variable deviates from its target
path by a particular magnitude. Typical target
variables are the money supply, which except
for changes in velocity should increase at the
same rate as nominal GDP, or the rate of infla-
tion. A typical, implicit rule for the money sup-
ply would be:
(13)
()
()
[]
ttttt
YPYPr lnln
1
−=
γ
,
where a bar indicates a target value. According
to this rule, the rate of interest is changed when
the nominal GDP deviates from its target value.
A rule for inflation targeting may be formulated
as follows:
(14)
()
ttt
P∆Pr lnln∆
2
−=
γ
,
with
∆ as an indicator for the rate of change
against the previous period.
The two-pillar strategy of the ECB can be in-
terpreted as a combination of a money supply
target and inflation targeting. In the NiGEM
model this strategy is implemented through a
combination of (13) and (14), i.e.
(15)
()
()
[]
ttttt
YPYPr lnln
1
−=
γ
()
tt
PP ln∆ln∆
2
−+
γ
,
or
(15a)
(
) ()
ttttt
YYPPr lnlnlnln
1211
−
+
−
=
γ
γ
(
)
,ln∆ln∆
2 tt
PP −
+
γ
where for a nominal GDP target
1211
γ
γ
=
ap-
plies. The consumer price index is used to mea-
sure the price level empirically.
2.2.2 Estimating the Effects of
Coordination between Wage Policy
and Monetary Policy
The aim of the simulation
8
is to estimate how
large the effects of a policy of wage moderation
in Germany might be on real GDP, employment
and inflation in Germany given different degrees
of coordination between wage policy and ECB
monetary policy. In the model, a policy of wage
moderation is represented by a change in the be-
havior of trade unions and employer representa-
tives over a particular period of time. Specifi-
cally, it is assumed that as a result of the change
in wage policy nominal hourly wages over a pe-
riod of 5 years increase by one percentage point
less than they would without the policy change.
After this five-year period, trade unions and em-
ployer representatives return to their old wage
policy so that hourly wages, after a short ad-
justment period, again increase just as quickly as
in the base solution without a moderate wage
policy.
The structure of the simulation differs some-
what from the theoretical model in the previous
section where to simplify a policy of permanent
wage restraint was assumed, which correspond-
ingly led to an ever-lasting increase in produc-
tion potential. The simulation here, with its tem-
porary wage moderation, is based on the follow-
ing considerations. A moderate standard wage
policy can only lead to a reduced increase in ef-
fective wages as long as there is excess supply
on the labor market. As soon as this no longer
exists, real effective wages can be expected to
approach the market clearing level. This would
exhaust the possibilities for an increase in pro-
duction potential. In order to allow for these cir-
cumstances, in the simulation it is assumed that
8
Simulations were kindly provided by the National In-
stitute of Social and Economic Research (NIESR).
11
after 5 years of moderate growth, wages will
again increase at the base solution rate.
Technically this is implemented in NiGEM
through a temporary reduction in one of the pa-
rameters of the wage settlement function. Eco-
nomically, this parametric implementation does
mean that wage settlements may continue to be
influenced by other factors. Wage increases in
the simulation period are approximately one
percentage point below the base solution. Com-
pared to the basic scenario, real wages are lower
due to the policy of wage moderation, which can
be represented by a permanent reduction in the
constant
µ
in equation (11). Then from equa-
tion (12) it follows that a moderate wage policy
leads to a lower level of natural unemployment.
From (8) and (9) it can also be concluded that in
this case production potential increases. NiGEM
does not allow for the effects of policy measures
on the growth of production potential to be
quantified.
Wage Moderation Policy Without Coordination
With Monetary Policy
At the start of the scenario, trade unions and em-
ployer representatives in Germany have agreed
on a course of moderate wage policy. There is
no coordination between the policy areas be-
cause sufficient information about the future
course of wage policy is not available. The ECB
relies solely on historical data. Consequently it
adapts monetary policy rule (15a) based solely
on the information for output and inflation. In
the theoretical framework outlined above, this
would be compatible with rule (7). Based on the
theoretical results, it is expected that production,
employment and production potential will in-
crease. However, production will increase less
than potential due to the delayed reaction of
monetary policy and, consequently, inflation
falls below its target rate.
The assumptions and results of the simulation
for growth rates of nominal and real wages, con-
sumer prices, real GDP and employment are
shown in Figure 2. Wage development is de-pic-
ted in the top left. The growth rate of nominal
wages is about one percentage point below the
rate in the base solution over 5 years, abstracting
from two adjustment periods at the beginning. In
real terms, wage moderation is lower since in-
flation falls at the same time. After three years
the increase in real wages remains just half a
percentage point below the increase in the base
solution. The rate of inflation reaches its lowest
point at the end of the wage moderation period.
Then it is 0.6 percentage points lower than in the
base solution, in which the costs of living in
Germany for the simulation period increase an-
nually by 1.3 to 2.0 percent. The reduction in in-
flation does, thus, not lead to an absolute fall in
the price level (deflation).
As a consequence of the wage moderation
policy, real GDP grows more rapidly over the
entire simulation period than it would have done
in the absence of this policy. The transmission
mechanism differs from that in the theoretical
analysis. In NiGEM, the primary stimulus of
wage moderation on gross domestic product ex-
clusively affects the net trade in goods and ser-
vices at the beginning of the simulation. The
price competitiveness of domestic products de-
pends directly on the development of unit labor
costs compared to those abroad. The restricted
growth of wages leads to an improvement in the
net trade in goods and services and to an in-
crease in GDP. Consumer prices are influenced
by both unit wage costs and the degree of ca-
pacity utilization. At the beginning of the simu-
lation, capacity utilization increases due to the
increase in gross domestic product, while the
limited increase in unit wage costs suppresses
consumer prices after a slight delay. The result
is that, at the beginning of the simulation, the
rate of inflation increases slightly compared to
the basic scenario, before falling below the
baseline.
At its maximum level, which is reached 6
years
after the beginning of the policy, the
growth rate of GDP is by almost 0.2 percentage
points higher. Of particular note is the initial ac-
celeration in growth at the beginning of the si-
mulation, which then slows down after about
one year.
While the effects of a moderate wage policy
on GDP are rather restrained, employment
clearly profits from this policy. The expansion
of
employment accelerates immediately after the
12
Figure 2: Wages, Prices, Real GDP and Employment with Wage Moderation and no Coordination with Monetary Policy
a
Wages
10
20 30
40
50 60
1.2
0.6
0.0
0.6
nominal
real
Consumer prices
10
20 30
40
50 60
0.6
0.5
0.4
0.3
0.2
0.1
0.0
0.1
Gross domestic product
10 20 30
40
50 60
0.0
0.2
0.4
0.6
Employment
10 20 30
40
50 60
0.0
0.2
0.4
0.6
Quarter Quarter
Quarter
Quarter
a
Quarterly deviation from the rate of growth compared with the previous year in the base scenario in percentage points.
Source: Simulations with NiGEM.
beginning of the policy by 0.3 percentage points
compared to the base solution, due to the in-
crease in real wages being lower than the base
solution. It retains this value until the end of the
wage moderation period. Then the rate of in-
crease returns to its level for the base solution.
However, it does not fall below it, that is, the
gains in employment achieved are retained. In
absolute figures around 750,000 long-term jobs
are created through wage moderation (Figure 3).
It would take 7 years until the full extent of em-
ployment gains is reached.
Wage Moderation Policy with Coordination
with Monetary Policy
The second scenario assumes that German wage
policy and ECB monetary policy are coordi-
nated. German social partners are now able to
credibly signal the ECB that they have em-
barked on a moderate course. The ECB assumes
from this that a passive policy on its part would
lead to inflation falling below the target. In order
to avoid this, the ECB increases the target value
for nominal GDP by the anticipated increase of
real gross domestic product in the euro area. As
part of the two-pillar strategy, this would corre-
spond
to an increase in the reference value for
13
Figure 3: Employment in Germany with Wage Moderation
in Germany and no Coordination with Monetary Policy
a
10
20
30 40
50
60
0
100
200
300
400
500
600
700
800
Quarter
a
Quarterly deviations from the base scenario in thousands of
people.
Source: Simulations with NiGEM.
Figure 4: Money Market Interest Rate in the Euro Area
with Wage Moderation in Germany and Coordination with
Monetary Policy
a
10 20 30 40
50
60
-
-
-0.2
-
-
-0.1
0.0
0.1
Quarter
a
Quarterly deviations from the base scenario in percentage
points.
Source: Simulations with NiGEM.
the money supply growth (M3) and a subsequent
fall in the interest rate.
The implications of this form of coordination
between wage and monetary policy for the inter-
est rates within the euro area are shown in Fig-
ure 4. During the entire simulation, the interest
rate remains below the base solution level.
Monetary policy has a stimulating effect on
overall economic demand. In contrast to a situa-
tion where monetary policy is not coordinated
with wage policy, the ECB must not wait for the
actual fall in the rate of inflation before it can
cut interest rates. The temporary increase in the
rate of inflation within the euro area at the be-
ginning of the simulation period (Figure 5) will
not prevent the ECB from reducing the interest
rate. Compared to the situation without coordi-
nation, in the first few years of the simulation
interest rates are now one quarter of a percent-
age point lower. Compared to the base solution,
the cut in interest rates is rather moderate. Still,
it is sufficient to keep the rate of inflation in the
euro area close to the base solution and thereby
close to its target value.
The rates of growth of the remaining vari-
ables in Germany, compared to the base solu-
tion, are presented in Figure 6. The wage in-
crease in this simulation does not fall to the tar-
geted level of one percentage point below the
base solution, since the stronger expansion of
GDP has a positive effect on the wage increase.
Equally, in this simulation the real wage short-
fall below the base solution is less than in the
previous simulation without coordination. Due
to the monetary stimulation, real GDP increases
more than in the situation without coordination.
At its maximum value, it increases half a per-
centage point faster than in the base solution.
Employment is also more dynamic than in the
situation without coordination. The fact that real
wages fall less than in the first scenario is more
than compensated for by the more rapid increase
in GDP and the associated increase in labor pro-
ductivity. In this scenario also, approximately
750,000 jobs are created. Employment gains oc-
cur somewhat earlier than without coordination
between the policy areas. Note, however, that
the long-run increase in employment is hardly
influenced at all by the assumption of coordina-
tion between wage and monetary policy (Figure
7).
Conclusions may be drawn from the long-
term increase in employment as regards the ef-
fects of policy alternatives on production poten-
tial. As can be seen from the increase in em-
ployment, potential output also rises. However,
the long-term effects do not depend on whether
wage and monetary policy are coordinated.
What is crucial for the long run is wage mod-
eration.
Coordination is relevant only for ex-
14
Figure 5: Consumer Prices and Real GDP in Germany and in the Euro Area with Wage Moderation in Germany and Coordi-
nation with Monetary Policy
a
Quarter
Consumer prices
10 20 30 40 50 60
0.6
0.4
0.2
0.0
0.2
Germany
Euro zone
Gross domestic product
10 20 30 40 50 60
0.0
0.2
0.4
0.6
Quarter
a
Quarterly deviations in the growth rate from the base scenario in percentage points.
Source: Simulations with NiGEM.
Figure 6:
Wages, Prices, Real GDP and Employment in Germany with Wage Moderation in Germany and Coordination with
Monetary Policy
a
Wages
10
20
30
40
50 60
-
1.2
0.6
0.0
0.6
nominal
real
Consumer prices
10
20
30
40
50
60
-
0.5
-
0.4
-
0.3
-
0.2
-
0.1
-
0.0
0.0
Gross domestic product
10
20
30
40
50
60
0.0
0.2
0.4
0.6
Employment
10
20
30
40
50
60
0.0
0.2
0.4
0.6
Quarter
Quarter
Quarter
Quarter
a
Quarterly deviations in the growth rate from the base scenario in percentage points.
Source: Simulations with NiGEM.
15
Figure 7: Employment with Wage Moderation in Germany
under Alternative Assumptions Regarding Coordination
with Monetary Policy
a
with
coordination
without coordination
10 20 30 40 50 60
0
100
2
00
3
00
4
00
500
600
7
00
800
Quarter
a
Quarterly deviations from the base scenario in thousands
of people.
Source: Simulations with NiGEM.
ploiting potential output in the short term. In this
respect, the results of the quantitative analysis
support the findings of the theoretical analysis.
2.3 Summary
The preceding analysis has argued that a policy
of sustained wage moderation could give rise to
an acceleration of potential output growth and a
substantial increase in employment. If such a
policy were implemented, there would be scope
for a coordination of wage policy with monetary
policy. As long as private agents do not com-
pletely anticipate the increase in potential output
caused by the wage moderation policy, aggre-
gate demand will fall short of aggregate supply
for some period of time. In this case a more ex-
pansionary monetary policy would be needed to
fully reap the benefits of the wage moderation
policy. Monetary authorities will, however, be
reluctant to ease the monetary policy stance as
long as there are no clear signs of the increase of
potential output. In this case, a credible an-
nouncement of the social partners to the mone-
tary authorities, signaling that the former have
embarked on a wage moderation policy, could
make the latter react faster. The result would be
that output rises faster than without this kind of
“coordination.”
One considerable obstacle to this kind of co-
ordination between wage and monetary policy is
that wage policy announcements may not appear
credible. The aim of trade unions is probably not
overall economic welfare but the short-term
maximization of wage income for the trade un-
ion members without sufficiently taking into ac-
count the interests of the unemployed. It may
therefore be optimal for wage policy to deviate
from an announced policy of sustained wage
moderation by implementing higher wage in-
creases than announced, as soon as the central
bank has switched to an expansive policy. In this
case, the employed receive wage increases with-
out having to expect dismissals, since the econ-
omy is undergoing a period of cyclical boom
caused by monetary policy. In the medium term,
this strategy certainly leads to higher inflation
and higher unemployment. If this increased un-
employment is irrelevant to wage policy because
it occurs after several years and the time frame
for wage policy is shorter, then the announce-
ment of moderate wage policy will be time-in-
consistent. The central bank will then attach no
credibility to it, irrespective of the intentions of
wage policy, and instead will prefer a cautious
strategy of monetary policy which does not rely
on the announced wage policy. In order for co-
ordination to work, it is important to solve the
problem of credibility or at least to keep it small.
This could, for instance, be achieved by institu-
tions which result in a wage policy not exclu-
sively being oriented towards the interests of
employees but also towards the interests of the
unemployed.
It should be noted, however, that the benefi-
cial effects of coordination on output found
above relate only to the short run. In the long
run, potential output as well as employment in-
crease regardless of coordination, given that the
wage moderation policy is sustained.
16
3 International Experience with Macroeconomic Coordination
When calling for the coordination of macro
policies, it is frequently argued that countries
with a particularly positive overall economic
development have benefited from an agreement
on the macroeconomic policy mix. The coun-
tries most frequently mentioned in this respect
are the United States, the Netherlands and Ire-
land. In this section we will examine to which
extent coordination of macro policies might be
credited with growth and employment successes
in these countries.
3.1 United States: Prolonged
Expansion without Coordination
In the nineties the United States experienced its
longest boom in post-war history. There was a
sustained expansion of economic activity from
May 1991 until March 2001. However, it should
be noted that the average rate of growth during
this expansion was not higher than during earlier
long periods of economic expansion in the six-
ties or in the eighties (Zarnowitz 2000). The
sustained growth led to a strong increase in em-
ployment and to a pronounced reduction of un-
employment from 7.5 percent in 1992 to below
4 percent in 2000. But again, the employment
growth was not exceptionally strong in historical
comparison.
Remarkably, the boom of the nineties was not
accompanied by a pronounced upsurge in infla-
tion. This is the most striking difference to ear-
lier sustained expansions which each time ended
in a marked acceleration of inflation that had to
be countered by pronounced monetary restric-
tion.
These favorable developments of the nineties
are often traced back to a successful combina-
tion of macroeconomic policies (Heilemann et
al. 2000). Even accepting the argument, which
can be disputed, there can be no talk of explicit
macroeconomic policy coordination. To start
with, there are no institutions in place to achieve
this. A coordinated wage policy is not possible
due to the decentralized wage bargaining sys-
tem. And there are also no institutions for ex-
plicit agreements on monetary and fiscal policy.
Certainly, at the beginning of the nineties, when
the recession was bottoming out and the recov-
ery was slow, both monetary and fiscal policy
were expansive in order to revive the economy.
But as early as in 1993, when the recovery was
still hardly to be felt, the Clinton administration
switched towards a policy of fiscal consolidation
by passing the so-called Omnibus Budget Rec-
onciliation Act. In particular, with this initiative
growth in government spending was strictly
limited. In addition, taxes where increased mod-
estly.
This turn in fiscal policy towards restriction
corresponded to the expectations of the financial
markets and led to a subsequent drop in long-
term interest rates. And while it was welcomed
by the central bank, which was critical of the
high budget deficit and the associated rapid rise
in government debt (Mackenzie and Thornton
1996), it did not prevent the Fed from raising
key interest rates only months later towards a
course which was judged as being neutral or
even dampening (Gern et al. 1995). Subse-
quently this led to a substantial slowing of
growth in an economy that had seemed to just
have started to recover. Thus the change towards
consolidation in fiscal policy cannot be regarded
as part of a deal with the central bank that in
turn would have had to keep interest rates low
for an extended period of time.
Therefore, a closer look at monetary and fis-
cal policy decisions during the nineties leads to
the conclusion that they were not the result of a
deliberate and coherent policy coordination. Ra-
ther, they have to be characterized as individual
and discrete reactions to events (see also Blinder
and Yellen 2001).
An unusual feature of the almost ten-year pe-
riod of economic expansion in the nineties was
that the strongest growth was recorded in the
latter years. And most remarkably, inflation did
not accelerate, but even declined temporarily,
although unemployment was falling below what
was generally believed to be the NAIRU, the
17
rate of unemployment that is associated with
stable inflation (Solow 2001).
This unusual behavior of inflation can be ex-
plained by a series of exogenous factors. To
mention some of them: In the second half of the
nineties, the real effective exchange rate of the
dollar rose sharply, in addition the terms of trade
improved as a result of a drop in the price of raw
materials and crude oil in particular. Further-
more, the increase in labor cost was muted since
nonwage labor costs fell, for example health in-
surance premiums. Also changes in methods for
the statistical measurement of inflation showed a
lower inflation rate. Finally, and probably most
important, there was an acceleration of produc-
tivity which was unusual for the later stages of a
boom (Gern et al. 2000). This surge in produc-
tivity was associated with the increasing impor-
tance of information technologies in the econo-
my but was obviously not accounted for in the
wage negotiations. As a result, wages rose be-
low productivity, which checked unit labor
costs, leading to a leveling off of the upward
trend in prices (Ball and Moffitt 2001). All this
had nothing to do with macroeconomic policy
coordination.
3.2 The Netherlands: Success by
Consensus
In the eighties and nineties, the macroeconomic
performance of the Netherlands was signifi-
cantly better than the performance in Germany
and also that in the European Union as a whole.
Real GDP rose faster and inflation was lower,
but most strikingly, employment increased
strongly and the unemployment rate fell sharply.
What role did macroeconomic coordination play
in these developments?
To start with, it should be noted that monetary
policy was effectively not available as a policy
tool in the Netherlands. The scope for a national
monetary policy was limited due to the obliga-
tion to keep the exchange rate within tight bands
in the European Monetary System. Since 1988,
the Dutch central bank closely followed the
Deutsche Bundesbank in setting its interest
rates.
As concerns fiscal and wage policies, con-
trary to widely held beliefs, there were no for-
mal agreements between these policy fields ei-
ther. However, under the umbrella of the
Stichting van de Arbeid (literally: Foundation
for Labor) there were regular discussions be-
tween trade unions, employees’ associations and
the government about the general conditions for
supply and demand in the labor market, the aims
of labor market policy and labor procurement
programs.
In general, the so-called Wassenaar Accord
from 1982 is seen as the foundation for the
Dutch model. This agreement between employ-
ers’ associations, trade unions and the govern-
ment gave employer representatives and trade
unions the responsibility for negotiating wages.
Government influence on wage settlements was
reduced significantly, and not increased, com-
pared to the preceding period of wage planning
and control.
According to the Wassenaar Accord, the
wage bargaining process consists of two levels.
As part of the
Stichting van de Arbeid a basic
consensus of the leading associations of em-
ployers and employees on targets for wage in-
creases and other labor conditions is negotiated.
In this process, government and the Central
Planning Bureau provide their ideas on eco-
nomic conditions and the scope for changing the
income distribution. On this basis, wage nego-
tiations at company and sector levels are con-
ducted, so that sector and regional characteris-
tics can be taken into account.
9
However, there remains the government op-
tion to intervene in the collective bargaining
process. For example, in emergency situations
the government can insist on wage targets that
differ from the wage increase of the basic con-
sensus, something that happened the last time in
1993/4 (Krätke 2001). Or the government can
refuse to declare a wage agreement as binding
for outsiders, or can explicitly declare it as non-
binding (Schrader 2000). The threat of exercis-
ing this right alone was enough to ensure a cer-
9
Empirical work on the European labor markets show
that a low degree of wage differentiation inhibits em-
ployment growth (Siebert 1999).
18
tain degree of discipline between employer rep-
resentatives and trade unions.
With the reforms in the wage bargaining sys-
tem, social partners agreed on a policy of re-
ducing working hours and promoting part-time
work in order to increase employment. In return,
trade unions accepted moderate wage increases.
The government reduced corporate taxes as well
as employers’ contributions to social security.
At the same time, the minimum wage was cut
drastically and frozen over a long period, so that
minimum wages decreased significantly relative
to average wages (Barrell and Genre 1999).
Since many social benefits are linked to the
minimum wage, this led to a decrease in many
social benefits too. In order to make trade unions
accept wage moderation, successive decreases in
income tax and social contributions were help-
ful, which raised after-tax labor income by al-
most 15 percent between 1983 and 1998 (Tille
and Yi 2001).
The strategy to promote employment in the
Netherlands had a medium-term perspective and
wage moderation continued until the late nine-
ties. The result was a sustained improvement in
the international competitiveness of the Dutch
economy. Unit labor costs declined significantly
relative to the most important trading partner
countries. Wage moderation is frequently
viewed as the main reason for the success of the
employment policy, which is supported by quan-
titative studies (Nickell and van Ours 2000; IMF
1999a). More recently, however, wage rates
have increased considerably (EUROFRAME
2001), reflecting the fact that in the meantime
unemployment has reached a low level and that
human resources are becoming increasingly
scarce.
The increase in the number of employed since
1982 is largely due to a reduction in average
working hours. The total volume of labor has
risen significantly only in recent years. The
number of part-time workers increased strongly
and the share of part-time jobs in all jobs almost
doubled since the early eighties and is now ex-
tremely high in international comparison.
10
10
The number of part-time workers has almost doubled
since 1982. The ratio of part-time jobs to all jobs rose
from 21 percent in 1983 to 36.5 percent in 1996
There is a break in the statistics on part-time
jobs so that the share of part-time jobs in 2000 is
not directly comparable to that in 1983, but it is
evident that the share has further risen since
1996. The large increase in the number of part-
time workers is a particular characteristic of the
labor market in the Netherlands. It was part of
the employment policy strategy and was suppor-
ted by social partners as well as the government.
From the beginning, it was crucial that a legal
framework guaranteed comprehensive social se-
curity for part-time workers. This increased em-
ployees’ acceptance. The percentage of part-
time employees wishing to work full time is re-
latively small in international comparison
(OECD 1999a: 33). Employers increasingly of-
fered more part-time jobs, mainly in the expan-
ding service sector. Generally these jobs were
new, not split-up full-time positions (OECD
1998: 36).
However, the picture of the labor market in
the Netherlands painted by the official unem-
ployment statistics is too positive. Particularly in
the eighties, the labor market was relieved by
public labor procurement programs and early
retirement for older and less qualified employ-
ees.
11
Specifically, disability insurance schemes
effectively worked to reduce labor supply.
A thorough look at the Dutch model shows
that the success of economic policy can only
partly be traced back to explicit economic policy
coordination. Sustained wage moderation has
supported employment growth. However, wage
moderation was implemented as part of a free
collective bargaining between employers and
trade unions, even though it was facilitated by
the government that granted tax relief. But the
example shows that a unanimously agreed em-
ployment strategy can be successful if employ-
ers, trade unions and the government consis-
tently deploy suitable measures within their par-
ticular areas of responsibility. In this regard, the
main task of the government is to implement re-
forms of general institutional conditions rather
(OECD 1997). Since then it has continued to increase
although it is difficult to measure since there is a break
in the time series. The figure according to the new
definition was 32.1 percent for 2000, the correspond-
ing value for 1996 was 29.4 percent (OECD 2001a).
11
For details see Schrader (2000).
19
than demand-orientated fiscal policy. As a re-
sult, it was possible to increase labor supply and
tap on the pool of the inactive population by in-
creasing the number of part-time jobs. When
transferring this approach to other countries, it
should be kept in mind that, compared interna-
tionally, the Netherlands had started from an
extremely low female participation rate at the
beginning of the eighties.
3.3 Ireland: Consensual Fiscal
Consolidation and Wage Restraint
Another country with an impressive macroeco-
nomic performance is Ireland. After a drastic u-
turn in economic policy towards stabilization,
both in monetary policy (as part of the EMS)
and fiscal policy, the Irish economy has experi-
enced an impressive boom since the mid-eight-
ies. From 1986 to 2000, real GDP rose at an av-
erage 6.7 percent annually, and by almost 10
percent annually in the latter half of the nineties.
This compares with average annual growth in
the seventies and early eighties of less than 4
percent. The standardized rate of unemployment
fell from 16.8 percent in 1986 to 4.2 percent in
2000. At the same time, the rate of inflation,
which regularly reached double-digit figures in
the seventies and early eighties, stabilized at a
relatively low level. Consumer prices on average
have risen by only 2.7 percent annually since
1986. Meanwhile, the general government finan-
ces were consolidated very quickly. The budget
deficit was reduced from a sizeable 10 percent
in relation to GDP in 1986 to 1.7 percent in
1989. In every year since 1997 the government
achieved budget surpluses. In 2000 the surplus
was 5.7 percent of GDP. Government debt,
which had risen to 112 percent of GDP until
1987, fell to under 40 percent in 2000 and to
around 30 percent in 2001 (OECD 2001b).
In Ireland’s case, the change in monetary and
financial policies was a decisive factor for the
following strong economic growth. General eco-
nomic conditions for the private sector were im-
proved considerably through the shift of mone-
tary policy towards price stability and a consis-
tent strategy of fiscal consolidation. Therefore,
overall demand rose sharply in the second half
of the eighties despite the significant reduction
in government spending. The main feature of the
Irish fiscal consolidation was that it heavily re-
lied on spending cuts.
12
In relation to GDP, gov-
ernment spending was reduced from 50.2 per-
cent to 38.6 percent in only three years between
1986 and 1989. The period from 1987 to 1994
can be regarded as a phase of stabilization
which, although accompanied by comparatively
strong
economic growth, saw only a gradual de-
crease in unemployment. The second half of the
nineties by contrast was a period of very strong
growth and an extremely rapid increase in em-
ployment (average annual growth of 5.3 percent
from 1995 to 2001), which led to a fall in the
level of unemployment from 14.7 percent (1994)
to 4 percent (2001).
The turning point in Irish economic policy
came in 1987 when a social pact was agreed
upon in the form of the “Programme for Natio-
nal Recovery.”
13
This program established the
basis of the consensual (cooperative) approach
to implementing economic policy. The strategy
consisted of strengthening the competitiveness
of the domestic economy through wage modera-
tion and at the same time to reform institutions
of the welfare state (Auer 2000: 53). This part-
nership approach to wage settlement significant-
ly improved the social climate and general eco-
nomic conditions in Ireland (Sexton and
O’Connel 1997).
In the 1987 program, wage increases from
1988 to 1990 were limited to 2.5 percent. In the
following
years, further multi-year social pacts
12
There is a rising body of literature on so-called non-
Keynesian effects of fiscal consolidation, according to
which fiscal consolidation can lead to expansionary ef-
fects even in the short run due to expectations in the
private sector of lower future taxation. For a survey
see Giavazzi et al. (2000), on developments in Ireland
in particular see Giavazzi and Pagano (1990). There is
evidence that the structure of consolidation matters,
i.e., that particularly consolidation from the expendi-
ture side can create positive expectational effects
(Alesina and Perotti 1995, 1997). There is, however,
also the view that the fiscal consolidation program had
dampened demand significantly, while the Irish econ-
omy was pulled along by buoyant external demand on
the back of a world economic upswing (Fitzgerald
2000).
13
There were previous attempts to improve the govern-
ment finances in 1982–1984 which, however, failed.
20
Table 1: Social Pacts in Ireland
Years covered Target for annual wage growth
(percent)
Actual annual wage growth
(compensation per employee)
Programme for National Recovery 1988–1990 2.5 5.8
Programme for Economic and Social
Progress
1991–1993
3.8
5.8
Programme for Competitiveness and Work 1994–1996 2.7 2.6
Partnership 2000 1997–1999 2.3 4.6
Programme for Prosperity and Fairness 2000–2002 4.9 8.5
Source: Tille and Yi (2001); European Commission (2002b); own calculations.
were successively agreed upon. In the mean-
time, they appear to be a long-term feature of
Irish wage policy. As to the central feature of
wage growth limits, Table 1 compares the tar-
gets for wage increases with actual increases in
compensation per employee. Although this
measure might not be a perfect reference, it is
evident that actual labor costs over most of the
period increased faster than targeted in the pro-
grams. Particularly, in recent years the ex-
tremely tight labor market has led to a strong
wage drift. This illustrates that even in an insti-
tutional environment which supports central-
ized wage setting it is difficult to determine
economy-wide wage developments, as market
forces will shape actual outcomes considera-
bly. Nevertheless, the Irish policy resulted in
wage moderation inasmuch as real unit labor
costs fell absolutely and in relation to the EU
as a whole.
In addition to wage increases, the social
pacts included the commitment of the govern-
ment to increase disposable incomes through
cuts in income tax and social contributions. As
a result, the average tax burden for employees
fell from 35 percent in 1987 to 31 percent in
1994 and 29 percent in 1996. In addition, the
government committed itself to increase
spending on social infrastructure (education,
public health, housing construction). In the
course of the consensual reform policy, the
level of unemployment benefits was also re-
duced and the entitlement requirements were
tightened up. In return, active labor market
policy was extended.
The policy of protracted wage moderation,
with wage increases remaining below produc-
tivity growth, has contributed to the period of
strongest employment growth in Ireland and
has strengthened companies’ propensity to in-
vest (Blanchard 2000). However, it seems dif-
ficult to argue that moderate wage policy and
the underlying labor market reforms have been
the main sources of the boom of the second
half of the nineties. Another important factor
appears to be the rapid increase of foreign di-
rect investment, which occurred after 1993
(OECD 1999b). Since the early seventies, the
Irish government has attempted to attract for-
eign direct investment. Foreign investors were
granted tax breaks. Improvements in the eco-
nomic environment with the switch to stability-
oriented economic policies provided an addi-
tional prerequisite for becoming an attractive
destination of foreign direct investment. By the
end of the nineties almost half of all jobs in the
processing industry were at production plants
owned by foreign companies, which contrib-
uted around 30 percent to GDP (OECD 1999b:
62). In the nineties, Ireland became increas-
ingly attractive as a production location for in-
ternationally operating companies, as a large
number of well-trained workers entered the la-
bor market. This was partly the result of the re-
turn of emigrants, but above all this was the
long-term result of introducing free general se-
condary education. Employees entering the
labor market in the nineties had considerably
better skills than newcomers in the seventies
and eighties (IMF 1999b). Finally, it should be
noted that one feature of Ireland is that the
country received massive financial support
from the EU Structural Funds.
14
14
Since 1985 financial aid totalled between 2 and 3.5
percent of GDP annually (O’Connel 1999).
21
3.4 Summary
In general, coordination of macroeconomic
policies can only to a small part account for the
growth and employment success in the coun-
tries discussed here. In the case of the United
States, it is even hard to see any evidence of ex
ante policy coordination at all. In the Nether-
lands and in Ireland the development and im-
plementation of a consensual strategy of wage
restraint with the aim of improving the com-
petitiveness of the economy and stimulating
employment has been a significant factor be-
hind the economic success. The role of the
government included providing tax cuts to
support disposable incomes and to facilitate the
implementation of wage moderation. It was
important in both cases that significant supply-
side reforms were implemented at the same
time, and monetary policy played no active
role. But there were also special factors at
work which significantly contributed to the de-
velopments in both countries and complicate
drawing conclusions for other countries.
4 Coordination under the Conditions of the European Union
In the framework of the European Union, the
necessity and the assumed positive effects of
policy coordination are stressed in practically all
documents of the European Union. In the con-
text of this paper, we discuss the feasibility of an
ex ante coordination between monetary policy
on the one hand and wage developments on the
other: Is it possible that policy makers and wage
setters can make a credible commitment so that
the positive results shown in the model simula-
tions can indeed materialize?
The most important document for economic
policy coordination in the European Union are
the Broad Economic Policy Guidelines (BEPG)
which are decided upon annually by the Euro-
pean Council.
15
In these BEPG, there is a clear
assignment of the targets and instruments of
economic policy: The main objective for the
ECB is to secure price stability; fiscal policy
should aim at the balanced budget as described
in the Stability and Growth Pact and should
promote economic growth; wage developments
should support employment and the profitability
15
These guidelines can be viewed as the summary of the
various coordination processes at the European level,
in particular the Stability and Growth Pact, which de-
scribes the rules for fiscal policy, the policies for more
employment in the framework of the Luxembourg
process, structural policies in the framework of the
Cardiff process, and the Macroeconomic Dialogue,
which was established in Cologne in 1999. For a de-
scription of the various areas of coordination, see ECB
(2001).
of investment; and finally, structural policies
should enhance the flexibility of markets. In this
sense, there is a clear assignment of the respon-
sibilities of the various areas of economic poli-
cies to the respective targets. However, no pre-
cise statements are made as to whether or how
the various areas of economic policy should be
coordinated.
While clear prescriptions of macroeconomic
policy coordination in the usual sense are miss-
ing, one can analyze whether the framework
could be made more precise in order to define
such mechanisms. When we discuss the possible
coordination between monetary policy and wage
policy, the role of the ECB in such a process is
of great importance. In the next step, we will
look at the conditions for wage policy.
The statute and the targets of the ECB are de-
scribed in the Treaty establishing the European
Community.
16
The independence of the ECB is
clearly defined. According to the Treaty, “nei-
ther the ECB, nor a national central bank, nor
any member of their decision making bodies
shall seek or take instructions from Community
institutions or bodies, from any government of a
Member State or from any other body” (quoted
from ECB 2000b: 52). Accordingly, the men-
tioned bodies, i.e., all other institutions of eco-
16
Article 105 of the Treaty defines the tasks and
prerogatives of the monetary authority, Article 108 de-
fines the independence.
22
nomic policy making, should not try to influence
the ECB in any way. According to the ECB, the
status of independence implies “clear limits to
the degree of engagement between Community
institutions and bodies on the one hand and the
ECB on the other” (ECB 2000b: 52). As far as
the interaction in the field of economic policies
is concerned, the ECB interprets the Treaty in
such a way that “the ECB’s relations with other
policy making bodies cannot go beyond a non-
binding dialogue” (ECB 2000b: 52). This inter-
pretation was supported at the Helsinki Euro-
pean Council in 1999. In short: An ex ante coor-
dination in the form of a binding commitment is
excluded for the monetary authority.
This does not mean, however, that the ECB
does not or should not take into account the
measures of other areas of economic policy. In
fact, the ECB participates in the discussions at
the EU level, for example, in the meetings of the
European Council, and it is involved in the Eu-
rogroup, the Economic and Financial Committee
and the Macroeconomic Dialogue, all of which
are contacts which are understood as meetings
for the exchange of information and of views
and which take the form of a nonbinding policy
dialogue (ECB 2001: 64). While one may not
expect commitments from any side, it is obvious
that the ECB would take into account any state-
ments of, for example, the social partners. If
there are clear signals concerning wage modera-
tion in the future, the ECB would – in fact, it
should, given its mandate to maintain price sta-
bility – take this message into account in its
monetary policy strategy. In particular, in the
context of the second pillar, the ECB would then
see less of a risk for price stability and positive
effects on potential output growth which would
in turn influence its policy decisions. However,
an ex ante commitment is not possible for vari-
ous reasons. For example, it may not be clear
whether the social partners can credibly an-
nounce a policy of wage moderation.
17
Also, it
is possible that risks for price stability come
from other sources; in this case, the ECB would
have to react accordingly, which may then be
17
This is discussed in the following paragraph.
wrongly interpreted by the social partners as a
violation of the agreement.
4.1 Nationally Diversified Wage
Setting Processes
In the EU countries there are different wage
bargaining systems that have historically devel-
oped and vary in different respects.
As concerns wage bargaining levels, wage
bargaining on sector and company levels can be
found in every country (Table 2). This is sup-
plemented by wage bargaining on the central
(national) level in five countries, covering either
the whole economy (in Finland and Ireland), the
private sector (in Belgium and Greece) or the
industrial sector (in Denmark). An additional
central element exists in a number of countries
in the form of minimum wages.
18
The central level is the predominant level of
wage bargaining in Belgium and Ireland, while
the importance of the central level varies in
Finland from wage round to wage round and
matches the importance of the sector level in
Denmark. The company level is the predominant
level of wage bargaining in France and in the
United Kingdom and is important in Luxem-
bourg also.
In the remainder of the EU countries, the
sector level is predominant. At the same time,
there are significant differences in the meaning
and scope of sector wage bargaining across
countries. In Ireland and the United Kingdom,
sector wage bargaining is restricted to a small
number of branches; in other countries, such as
France, the Netherlands, Portugal and Spain, it
is particularly the small and medium-sized com-
panies that are covered by sector-wide wage
agreements, while large companies tend to have
a company agreement. There are also differ-
ences with respect to geographical coverage:
while in most countries sector-wide agreements
cover
the whole country, coverage is restricted,
18
Minimum wages in various forms exist in Belgium,
France, Germany, Greece, Ireland, Luxembourg, the
Netherlands, Portugal, Spain and the United Kingdom
(see EIRO 2000).
23
Table 2: Levels of Wage Bargaining in the EU Countries
Central level Sectoral level Company level Overall assessment
Austria * xxx x centralized
Belgium xxx x x centralized
Denmark xx xx x intermediate
Finland xx xx x centralized
France x xxx decentralized
Germany xxx x intermediate
Greece x xxx x intermediate
Ireland xxx x x centralized
Italy xxx x intermediate
Luxembourg xx xx intermediate
Netherlands * xxx x centralized
Portugal xxx x intermediate
Spain xxx x intermediate
Sweden xxx x intermediate
United Kingdom x xxx decentralized
x = Level of wage bargaining existent, but not important. – xx = Level of wage bargaining important, but not dominant. –
xxx = Dominant level of wage bargaining. – *Important central coordination.
Source: EIRO (2000); Dohse and Krieger-Boden (1998); own compilation.
at least formally, to certain regions in France,
Germany and Spain.
Furthermore, there are differences in the rela-
tionship between the different wage bargaining
levels. In a number of countries, sector and
company levels supplement each other in that
agreements on the sector level define a mini-
mum wage which may be exceeded by company
agreements. By contrast, in Belgium and in Ire-
land, there is a maximum wage increase agreed
upon on the central level which sets the margin
for wage negotiations on the sector and com-
pany levels, respectively.
When categorizing the national wage bar-
gaining systems according to their degree of
centralization in the tradition of Calmfors and
Driffill (1988), most of the wage bargaining
systems have to be grouped as intermediate.
19
Central wage bargaining systems prevail in Bel-
gium, Finland and Ireland and also in Austria
and the Netherlands, where wage negotiations
take place predominantly on the sector level, but
coordination on the central level has a strong in-
fluence.
Wage bargaining systems are also character-
ized by the degree of unionization of workers
and employers and the share of workers that are
19
For a slightly different rating see OECD (1997).
covered by negotiated wage contracts. Countries
vary considerably also in this respect (Table 3).
The Scandinavian countries typically have a
high degree of unionization of workers com-
bined with a relatively low share of enterprises
organized in employers associations. Coverage
of wage agreements is intermediate relative to
the other EU countries. The instrument of man-
datory extension of wage agreements to nonor-
ganized companies exists only in Finland. The
type of wage bargaining system predominant in
the EU, by contrast, consists of a relatively low
(and falling) share of workers organized in trade
unions and a relatively high degree of organiza-
tion among employers leading to generally high
levels of coverage of bargained wage agree-
ments. The power of trade unions is increased in
some countries by the possibility of extending
bargained wage agreements to the nonorganized
part of the economy by law.
Wage policy is coordinated on the macro
level by different means (OECD 1997, EIRO
2000). In the United Kingdom and in France, the
setting of minimum wages, which can be seen as
a form of state-imposed coordination, is the only
form of central coordination. Wage indexation
mechanisms as in Belgium and in Luxembourg
represent
a stronger form of government inter-
24
Table 3: Unionization of Employees and Employers, Coverage of Bargained Wages and Incidence of Mandatory Extension
of Bargained Wages in EU Countries
a
Unionization (percent)
Employees
b
Employers
c
Coverage
(percent)
Mandatory extension
of bargained wages
Austria 37 96 97 significant
Belgium 40 80 82 significant
Denmark 68 48 52 not existent
Finland 65 58 67 significant
France < 7 71 75 limited
Germany 25 76 80 significant
Greece < 15 n.a. 97 significant
Ireland 37 44 n.a.
d
insignificant
Italy 32 40 90 not existent
Luxembourg n.a. n.a. n.a. n.a.
Netherlands 19 80 79 limited
Portugal < 20 n.a. 80 limited
Spain < 15 70 67 limited
Sweden 77 60 72 not existent
United Kingdom 21 57 40 not existent
a
Mid-nineties. –
b
Share of employees that are members in trade unions. –
c
Measured as proportion of employees in enter-
prises that are members of employers associations. –
d
The coverage in Ireland is very high but figures are not available. –
n.a.= not available.
Source: Auer (2000: 58); Dohse and Krieger-Boden (1998: 68); own compilation.
ference.
20
In the other countries there is a co-
ordination of wage policies between the employ-
ers associations and the trade unions. This is
done explicitly in some countries (Belgium, Fin-
land, Ireland, the Netherlands, Spain) with top-
level associations of employers and trade unions
setting a target wage increase on the central
level. In other countries, including Austria, Den-
mark, Germany and Sweden, the coordination is
performed implicitly with sectoral or regional
wage bargaining partners following a leader in
some kind of convoy system.
A more recent development is the establish-
ment of cross-sector or national tripartite agree-
ments, so-called social pacts. Such kinds of
“round table talks” have already been estab-
lished in 10 EU countries.
21
Design and rele-
vance of these agreements, however, vary
strongly across countries, reaching from nonbin-
20
Wage increases are generally tied to inflation; in Bel-
gium, however, the development of labor costs in im-
portant trading partner countries has played the deci-
sive role in the determination of wages.
21
For a compilation see EIRO (2000), for more detailed
information see Fajertag and Pochet (1997), Hassel
(1998) and Kuntze (1998).
ding statements of general principles of wage
policy (such as with the
Bündnis für Arbeit in
Germany) to legally binding rules for wage set-
ting (as in the case of the Irish consensus pro-
grams).
4.2 Summary
All in all, differences in national wage bargain-
ing systems in the EU are very pronounced.
Against this background, it seems inappropriate
to think of wage setting in the EU (or in the euro
area) in terms of a single wage bargaining sys-
tem or even a single wage policy. For institu-
tional reasons it currently seems impossible to
obey a certain target path for wages in the euro
area as a whole. It has to be recognized that
wage increases in the euro area trace back to dif-
ferent national wage developments that can be
centrally controlled only to a limited extent.
This means that it is hard (or even impossible)
to coordinate macro policies on the EU level or
in the euro area as is sometimes proposed in or-
der to improve the growth performance in Eu-