Tài liệu Báo cáo khoa học: Adaptive changes in the expression of nuclear and mitochondrial encoded subunits of cytochrome c oxidase and the catalytic activity during hypoxia pptx
Bạn đang xem bản rút gọn của tài liệu. Xem và tải ngay bản đầy đủ của tài liệu tại đây (263.34 KB, 9 trang )
Adaptive changes in the expression of nuclear and mitochondrial
encoded subunits of cytochrome
c
oxidase and the catalytic
activity during hypoxia
C. Vijayasarathy
1,
*
,†
, Shirish Damle
1,
*, Subbuswamy K. Prabu
1,
*, Cynthia M. Otto
2
and Narayan G. Avadhani
1
1
Department of Animal Biology and
2
Department of Clinical Studies, School of Veterinary Medicine, University of Pennsylvania,
Philadelphia, PA, USA
The effects of physiologically relevant hypoxia on the
catalytic activity of cytochrome c oxidase (CytOX), mito-
chondrial gene expression, and both nuclear and mito-
chondrial encoded CytOX mRNA levels were investigated
in murine monocyte macrophages, mouse C2C12 skeletal
myocytes and rat adrenal pheochromocytoma PC12 cells.
Our results suggest a coordinated down regulation of mito-
chondrial genome-coded CytOX I and II and nuclear
genome-coded CytOX IV and Vb mRNAs during hypoxia.
Hypoxia also caused a severe decrease in mitochondrial
transcription rates, and associated decrease in mitochondrial
transcription factor A. The enzyme from hypoxia exposed
cells exhibited altered subunit content as revealed by blue
native gel electrophoresis. There was a generalized decline in
mitochondrial function that led to a decrease in total cellular
heme and ATP pools. We also observed a decrease in
mitochondrial heme aa
3
content and decreased levels of
CytOX subunit I, IV and Vb, though the catalytic efficiency
of the enzyme (TN for cytochrome c oxidase) remained
nearly the same. Increased glycolytic flux and alterations in
the kinetic characteristics of the CytOX might be the two
mechanisms by which hypoxic cells maintain adequate ATP
levels to sustain life processes. Reoxygenation nearly com-
pletely reversed hypoxia-mediated changes in CytOX
mRNA contents, rate of mitochondrial transcription, and
the catalytic activity of CytOX enzyme. Our results show
adaptive changes in CytOX structure and activity during
physiological hypoxia.
Keywords: hypoxia; cytochrome c oxidase; subunit content;
mitochondrial genome transcription.
Cytochrome c oxidase (CytOX) is the terminal oxidase of
the mitochondrial electron transport chain [1–5], which
catalyzes the reduction of the dioxygen (O
2
) to water and
harnesses the free energy of the reaction to phosphorylate
ADP to ATP. Heme and Cu, which transfer electrons from
ferrocytochrome c to molecular oxygen, constitute the
catalytic site of the enzyme complex. The three catalytic
subunits, CytOX I, II and III are coded by the mitochon-
drial DNA and are synthesized within mitochondria.
Heme a, heme a
3
and Cu
b
are ligated to subunit I, while
Cu
a
is ligated to subunit II which is also the binding site for
cytochrome c [4,5]. The remaining 10 subunits of the
mammalian enzyme, namely, IV, Vb, VIa, VIb, VIc, VIIa,
VIIb and VIII are encoded by the nuclear genome,
synthesized in the cytosol and imported into mitochondria
[1–3]. Some of the nuclear-encoded subunits in the mam-
mals are regulated developmentally and occur as tissue
specific isoforms [6,7]. Although the nuclear encoded
subunits, such as CytOX VIa and VIb, have been shown
to enhance the catalytic efficiency of the enzyme [8,9], the
precise role of many nuclear-encoded subunits in the
mammalian enzyme complex remains unknown.
Oxygen as a substrate and heme as a prosthetic group, are
closely interlinked in the function of the enzyme complex.
Studies in yeast have shown that both oxygen and heme act
as physiological modulators and regulate the expression of
the enzyme complex [10]. In the yeast CytOX complex, the
nuclear encoded subunit V is expressed as two distinct
isoforms, Va and Vb, that are regulated by heme and O
2
[11].
In the mammalian systems, however, the differential expres-
sion of nuclear encoded subunits in response to different
physiological factors has not been investigated in detail.
In a previous study we demonstrated that administration
of inhibitors of heme biosynthesis (succinyl acetone and
cobalt chloride) to mice, resulted in a 50% reduction in
mitochondrial genome encoded CytOX I and II mRNAs
and nuclear genome encoded CytOX Vb mRNA in heme
depleted tissues [12]. Heme depletion was also accom-
panied by a 50–80% reduction in intramitochondrial
Correspondence to N. G. Avadhani, Department of Animal Biology,
School of Veterinary Medicine, University of Pennsylvania,
3800 Spruce Street, Philadelphia, PA, 19104, USA.
Fax: + 215 573 6651, Tel.: + 215 898 8819,
E-mail:
Abbreviations: CytOX, cytochrome c oxidase; mtTFA, mitochondrial
transcription factor A; SMP, submitochondrial particles; TN, turn-
over number; BN/PAGE, blue native gel electrophoresis.
*Note: these authors contributed equally to this work.
Present address: UAE University, Faculty of Medicine and Health
Sciences, Department of Biochemistry, Al Ain, United Arab Emirates.
(Received 8 November 2002, revised 18 December 2002,
accepted 3 January 2003)
Eur. J. Biochem. 270, 871–879 (2003) Ó FEBS 2003 doi:10.1046/j.1432-1033.2003.03447.x
transcription and translation rates. Surprisingly, the
enzyme from heme-depleted tissues showed twofold to
fourfold higher turnover rates for cytochrome c oxidation,
suggesting alterations in the kinetic characteristics of the
enzyme following heme reduction. These studies suggested
that heme might regulate not only the mammalian CytOX
gene expression but also the catalytic activity of the
enzyme by affecting its stability or composition. Although
succinylacetone and CoCl
2
are known inhibitors of heme
biosynthesis, these agents also elicit nonspecific and toxic
effects in animals. To ascertain that the effects of these
agents, on the catalytic activity and subunit composition
of CytOX were related to their hypoxia-specific effects, we
have extended our investigation to physiological hypoxia
in cultured cells. We focused our attention on the
expression of mitochondrial genome encoded catalytic
subunits I and II, and the nuclear genome encoded
subunits, IV, Vb and VIIa. The mammalian CytOX
subunit IV is a homolog of the yeast subunit V, with the
latterexpressedinanO
2
and heme regulated manner.
In this study therefore, we investigated how O
2
modulates
the expression of mRNAs for CytOX subunits and also the
catalytic activity of the enzyme complex. Our results show
that the levels of some of the select mitochondrial and
nuclear genome encoded CytOX mRNAs are uniformly
down regulated during hypoxia. Results also show changes
in the composition and activity of the enzyme complex,
which is accompanied by alterations in cellular ATP and
heme pools.
Materials and methods
Cell culture
The following cell lines were used in this study: RAW 264.7
mouse monocyte macrophages, C2C12 mouse skeletal
muscle cells and PC12 rat adrenal pheochromocytoma
cells. Mouse macrophages were cultured in Dulbecco’s
modified Eagles medium supplemented with 10% (v/v) heat
inactivated fetal bovine serum (Gibco) and 100 lgÆmL
)1
penicillin/streptomycin. C2C12 cells were cultured as mono-
layers in Falcon tissue culture dishes in a medium containing
10% (v/v) fetal bovine serum (Gibco) and 90% (v/v) high
glucose Dulbecco’s modified Eagles medium supplemented
with 100 lgÆmL
)1
penicillin/streptomycin. The myocytes
were induced to differentiate into myoblasts by replacing the
medium at confluence with a fresh medium containing 2%
(v/v) fetal bovine serum. These myoblasts were further
grown for a period of 3 days when 70–80% of the cells fuse
to form multinucleated myotubes. Rat pheochromocytoma
(PC12) cells were cultured in Dulbecco’s modified Eagle’s
medium F-12 containing 15 m
M
Hepes buffer,
L
-glutamine,
10% fetal bovine serum and penicillin/streptomycin
(100 lgÆmL
)1
). All the cells were grown to 80–90%
confluence in a controlled humidified environment (21%
O
2
,5%CO
2
, remainder N
2
at 37 °C).
Exposure of cells to hypoxia
The normal range of tissue oxygen tension (in nonpul-
monary tissues) measured under in vivo conditions ranges
from 5 to 71 Torr, with most tissues maintaining a pO
2
of
40 Torr or less. Simulation of realistic in vivo hypoxia
requires that O
2
tension is maintained at less than 5 Torr
[13]. We have used modular incubator chambers (Billups-
Rothernberg, CA, USA) for creation of a nonfluctuating
hypoxic environment. The chambers were maintained at
37 °C in a humidified incubator. Cells grown in tissue
culture dishes were introduced into the chambers that
were directly connected to certified premixed compressed
gas cylinders. The modular chambers were purged with a
constant flow of premixed gas that was certified to contain
1 Torr (hypoxic) or 141 Torr of oxygen (normoxic), all
with 5% CO
2
and balance nitrogen (BOC gases; Murray
Hill, NJ, USA). Based on the barometric pressure and
atmospheric humidity, these levels approximately corres-
pond to 0.1 and 21% of oxygen, respectively. Normally
the cells were exposed to either normoxic or hypoxic
conditions for a period of 6–12 h. In each experiment, a
group of cells that were exposed to hypoxic conditions for
6–12 h were re-exposed to normoxic conditions for an
additional period of 6 h.
Collection of cells and fractionation
At the end of the culture period, the cells were rapidly chilled
on ice and were rinsed twice with ice cold NaCl/P
i
to remove
any residual, media, and dead cells. The cells were harvested
by centrifugation at 1500 g for 5 min and subsequently used
to prepare total cell lysates or subcellular fractions as
needed. For the preparation of total cell extracts the cells
were suspended in a lysis buffer (100 m
M
Hepes, pH 7.5,
10% Sucrose, 0.1 m
M
dithiothreitol, 0.1% Chaps and
150 m
M
NaCl and protease inhibitors [5 lgÆmL
)1
pepstatin
A, 5 lgÆmL
)1
aprotinin, and 1 m
M
phenylmethanesulfonyl
fluoride]) and lysed by three cycles of freezing and thawing
in liquid nitrogen. The lysates were centrifuged at 4 °Cfor
30 min in an Eppendorf centrifuge tube to remove debris
and unlysed cells. The supernatant was collected and stored
at )80 °C till further use. Protein concentrations were
determined using Lowry’s method [14].
Mitochondria were isolated form intact cells by differen-
tial centrifugation as described earlier [17]. The cell pellets
were suspended in H medium (70 m
M
sucrose, 220 m
M
mannitol, 2.5 m
M
Hepes, pH 7.4 and 2 m
M
EDTA) and
ruptured by homogenization through a Dounce homo-
genizer. Submitochondrial particles (SMP) were prepared
according to the method of Pederson et al. [18], and washed
three times with mitochondrial isolation buffer. All steps of
subcellular fractionation and isolation of SMP were carried
out at 4 °C.
Northern blot analysis
RNA was isolated from cells grown under hypoxic and
normoxic conditions using the guanidine thiocyanate
procedure previously described [15]. Total RNA (25 lg)
was analyzed by Northern blot hybridization with
32
P-labeled mouse cDNA probes for CytOX subunits I,
II, IV, Vb and VIIa under standard conditions (Schleicher
& Schuell Laboratory Manual). Gel-purified double
stranded DNA probes were labeled with
32
PdCTP
(6000 CiÆmmol
)1
, Dupont, NEN) by random primer
extension using the Klenow polymerase. The same blots
872 C. Vijayasarathy et al.(Eur. J. Biochem. 270) Ó FEBS 2003
were stripped and rehybridized with a
32
P-labeled 18S
DNA probe to evaluate loading levels [16]. The Northern
blots were imaged and quantified using the Bio-Rad
GS-525 Molecular Imager.
Mitochondrial transcription
The rate of transcription in isolated mitochondrial parti-
cles was measured essentially as described previously [19].
Freshly prepared mitoplasts were suspended in RNA
synthesis buffer at the final concentration of 5 mgÆmL
)1
protein. The reaction mixture consisted of 10 m
M
Hepes,
pH 7.4, 60 m
M
KCl, 10 m
M
MgCl
2
,5m
M
2-mercapto-
ethanol, 10 m
M
KH
2
PO
4
(pH 7.4), 0.14
M
sucrose, 2 m
M
ATP, 1 m
M
each of GTP and CTP, 5 m
M
pyruvate, 5 m
M
creatine phosphate, 0.2 mgÆmL
)1
creatine phosphokinase
and 100 l
M
each of 20
L
-amino acids. The reaction was
initiated by the addition of 200 lCiÆmL
)1
of [
32
P]UTP
(400 CiÆmmol
)1
) and was allowed to proceed for 45 min at
33 °C. Aliquots were used to determine the level of
32
P
incorporation in to RNA as described before [19]. At the
end of incubation, the mitochondria were pelleted by
centrifugation at 10 000 g for 10 min and
32
P-labeled
mitochondrial RNA was isolated as previously described
[15]. The rate of in vitro transcription was measured by dot
blot analysis. For this purpose, the plasmid DNA carrying
the mouse CytOX I and II encoding region of mitochon-
drial DNA, was immobilized on a Nytran membrane
(Schleicher & Schuell). The membrane was probed with
32
P-labeled mitochondrial RNA, subjected to autoradio-
graphy and quantified in a Bio-Rad GS 525 Molecular
Imager.
Spectrophotometric analysis of CytOX activity
and heme content
CytOX was assayed in membrane fragments (SMP) by the
method of Smith [20], wherein the rate of oxidation of
ferrocytochrome cwas measured by following the decrease in
absorbency of its a band at 550 nm. The reaction medium
contained 50 m
M
PO
4
(pH 7.0), 1% sodium cholate, 80 l
M
ferrocytochrome c,1m
M
EDTA and 1–2 lg of protein in a
total volume of 1 mL. Reaction rates were measured using
Cary-1E spectrophotometer (Varian Instruments Walnut
Creek, CA, USA). First order rate constants were calculated
from mean values of four measurements. The heme aa
3
content was calculated from the difference spectra (dithio-
nate/ascorbate reduced minus ferricyanide oxidized) of
mitochondria or SMP solubilized in 2% lauryl maltoside
using an absorption coefficient of 24 m
M
)1
Æcm
)1
at 605–
630 nm [21].
Electrophoresis of proteins and immunoblot analysis
Proteins were subjected to electrophoresis on 12–18% SDS/
polyacrylamide gels as described by Laemmli [22]. The
conditions for immunoblot analysis of proteins were similar
to that described earlier [23]. Polyclonal antibody against
purified mouse mitochondrial transcription factor (mtTFA)
was a gift from David Clayton (Howard Hughes Medical
Institute, Chevy Chase, MD, USA). The immunoblot was
developed using the Super Signal ULTRA chemilumines-
cent substrate kit from Pierce Chemical Co. The blots were
imaged and quantified in a Bio-Rad Fluor-S imaging
system.
Blue native gel electrophoresis of mitochondrial
membrane complexes
Blue native gel electrophoresis (BN/PAGE) was carried
out following the method of Schagger and Von Jagow on
6–13% gradient acrylamide gels [24]. SMP (30–50 lg) were
solubilized in ice-cold detergent buffer (1% digitonin,
0.1 m
M
EDTA, 50 m
M
NaCl, 10% glycerol, 20 m
M
Tris-
Hcl, pH 7.4) and centrifuged at 100 000 g for 20 min to
remove any insoluble material. The supernatant, 45 lLwas
mixedwith5lL of loading dye (5% Serva Blue G, 500 m
M
amino-n-caproic acid, 100 m
M
Bis-Tris, pH 7.0) and
analyzed by BN/PAGE. Marker proteins such as b-amy-
lase, 200 kDa; apo-ferritin, 443 kDa and thyroglobulin,
669 kDa (Sigma Chemical Company) were included as
standards. Electrophoresis was carried out initially at 100 V
until the protein samples were within the stacking gel, and
then at a constant current of 18 mA (500 V) for 5–6 h. The
proteins were transblotted onto a poly(vinylidene difluoride)
membrane and probed with subunit-specific monoclonal
or polyclonal antibodies and appropriate horseradish
peroxidase (HRP)-conjugated secondary antibody. The
immunoblot was developed using the Super Signal ULTRA
chemiluminescent substrate kit (Pierce Chemical Co),
imaged and quantitated in a Bio-Rad Fluor-S imaging sys-
tem. Subunit-specific monoclonal antibodies for CytOX I,
IV and Vb proteins were obtained from Molecular Probes
(Eugene, OR, USA) and the specificity of each antibody was
tested by immunoblot analysis of purified CytOX complex.
Polyclonal antibody to rat liver F
1
ATPase was a kind gift
from P. L. Pederson (Johns Hopkins University, Baltimore,
MD, USA).
Measurement of cellular ATP levels
Cellular ATP levels were measured using a somatic cell ATP
assay kit (Sigma Chemical Co, St Louis, MO, USA), which
is based on the assay of ATP driven luciferin luciferase assay
system. Cells were lysed with ATP releasing agent as per
manufacturer’s protocol and ATP levels were measured in a
TD-20/20 Luminometer (Turner Designs, Sunnyvale, CA,
USA), using appropriate controls and blanks. For measur-
ing the respiration driven ATP synthesis, mitochondria were
incubated for 3 min in a medium consisting of 150 m
M
KCl,
25 m
M
Tris/HCl pH 7.4, 2 m
M
EDTA, 10 m
M
KH
2
PO
4
,
0.25
M
sucrose, 0.1% bovine serum albumin, 0.3 m
M
ADP,
and 5 m
M
succinate. At the end of 3 min, mitochondria
were solubilized and ATP levels were measured as described
above.
Assays for other enzyme activities
Extracts of isolated mitochondria were assayed for NADH-
ubiquinone oxidoreductase (Complex-1) [25], cytosolic
fractions (105 000 g supernatant fractions) were used for
assaying isocitrate dehydrogenase [26], hexokinase [27] and
phosphofructokinase [28] enzyme activities by published
methods.
Ó FEBS 2003 Cytochrome c oxidase subunit expression in hypoxia (Eur. J. Biochem. 270) 873
Results
As a measure of the hypoxic effect on CytOX gene
expression, we measured the steady state CytOX mRNA
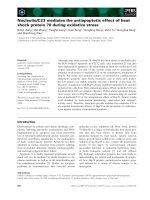
levels. The Northern blot in Fig. 1 shows the effect of
hypoxia on the levels of mitochondrial genome- and nuclear
genome-coded mRNAs for CytOX subunits. There were no
detectable changes in mRNA levels for CytOX subunits in
macrophages (Fig. 1A), PC12 and C2C12 cells (results not
shown) after 3 h of exposure to hypoxia. As CytOX has a
low K
m
for oxygen, it is conceivable that an adaptive
response to hypoxia might only be seen after a long period
of exposure to low O
2
. Changes in mRNA levels became
apparent only after 6 h of exposure to hypoxia. The
mitochondrial genome coded CytOX I and II mRNAs were
reduced by 60–70% in macrophages (Fig. 1A), PC12 cells
(Fig. 1B) and differentiated C2C12 myotubes (Fig. 1C),
after hypoxic exposures ranging from 6 to 10 h. The time
point at which a 40–60% reduction in mRNA levels
occurred varied between different cell types. Macrophages
and C2C12 myotubes showed a 50% reduction in mRNA
levels after 6 h of exposure to hypoxia, while PC12 cells
showed a similar reduction after 10 h of exposure to
hypoxia. In contrast, undifferentiated C2C12 myocytes did
not show any change in mRNA levels even after 12-h
exposure to hypoxia (Fig. 1D).
Figure 1(A–C) shows the effects of hypoxia on the steady
state levels of nuclear genome encoded CytOX IV and Vb
mRNAs. There was no change in the levels of these mRNAs
in macrophages at 6 h of hypoxia, the time point at which
there was a 50% reduction in mitochondrial genome
encoded subunit I and II mRNAs (Fig. 1A). However,
changes in subunit IV and Vb mRNA levels became
apparent after prolonged exposure to hypoxia. In both
PC12 cells (Fig. 1B) and differentiated C2C12 myotube
(Fig. 1C), CytOX IV and Vb mRNA levels were reduced by
30–60% at 10 h exposure to hypoxic conditions. These
results suggest that changes in mitochondrial gene expres-
sion precede changes in the expression of nuclear genome
coded CytOX subunits during hypoxia.
We also tested the level of mRNA for subunit VIIa,
which is expressed as isolog H and L. The L isolog is
ubiquitously expressed in all the tissues whereas the H isolog
is detected in the heart and skeletal muscle tissues [3]. The
Northern blot in Fig. 1E shows that in both macrophages
and PC12 cells more than 50% reduction in CytOX VIIa
(L) mRNA level was observed following 10 h of exposure to
hypoxia. The mRNA levels reverted to near control levels in
cells subjected to normoxia following exposure to hypoxia
(Fig. 1E). These results together show that physiological
hypoxia in cells causes (a) progressive decrease in the
nuclear and mitochondrial genome encoded mRNAs for
CytOX subunits and (b) the nuclear and mitochondrial
genes coding for CytOX are coordinately down regulated
during hypoxia. Although not shown, the reversibility of
mRNA levels and also other biochemical parameters tested
in this study were limited to hypoxic exposure up to a
threshold limit. This threshold limit ranged from 10 to 16 h
for different cells. Our results point to differential sensitivity
of cell types to hypoxia, though the effect on CytOX gene
expression was similar in all the cell types studied. Based on
Fig. 1. Effects of hypoxia on the steady state levels of nuclear and
mitochondrial coded CytOX mRNAs. Northern blot analysis was car-
ried out with total RNA (25 lg each) from macrophages (A, E), PC12
cells (B,E), myotubes (C) and myocytes (D) exposed to normoxia
(141 Torrr O
2
)orhypoxia(1TorrO
2
) for 10 h. Hybridization with
32
P-labeled probes was carried out as described in the Materials and
Methods section. The stripped blots were rehybridized with a [
32
P]18S
rDNA probe to determine the RNA loading. The blots were scanned
in a Bio-Rad GS-525 Molecular Imager. The values were normalized
to the 18S rRNA level in each lane.
874 C. Vijayasarathy et al.(Eur. J. Biochem. 270) Ó FEBS 2003
this observation we restricted our subsequent investigations
to macrophages and PC12 cells.
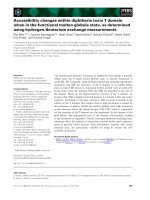
In order to understand the basis for reduced CytOX I
and II mRNA levels, we studied the rate of transcrip-
tion in mitochondria from cells cultured under hypoxic
environment. Mitochondrial transcription rates were meas-
ured by extent of incorporation of
32
P-labeled UTP into
RNA. It is seen from Fig. 2A that mitochondria from PC12
cells and macrophages exposed to hypoxia for 8 h show
50% and about 75% reduced transcription, respectively.
The effect on the transcription rates of CytOX I and II
mRNAs was further ascertained by slot blot hybridization
of nascent
32
P-labeled RNA to mitochondrial DNA frag-
ment encoding the CytOX I and II mRNAs. The hybrid-
ization patterns (Fig. 2B,C) show that the transcription of
CytOX I and II mRNAs in both PC12 cells and macroph-
ages were inhibited by over 60% when cells were exposed to
hypoxia for 8 h. Because each strand of the mitochondrial
genome is transcribed as a single unit originating from one or
limited number of strand specific promoters [29], a reduction
in subunit I and II transcript levels reflects an overall
reduction in mitochondrial genome transcription rates.
We also determined the levels of mitochondrial tran-
scription factor mtTFA by immunoblot analysis. The
29 kDa MtTFA is a mitochondrial specific transcription
factor coded by the nuclear genome, which is implicated in
the regulation of mitochondrial genome transcription
[29,30]. Both macrophages and PC12 cells had a 60–80%
reduction in mtTFA levels following exposure to hypoxia as
compared to the controls (Fig. 2D). However, mtTFA
levels were restored to near normal levels following exposure
of cells to normoxic conditions. It is likely that the reduced
mtTFA level is a factor in reduced mitochondrial mRNA
levels during hypoxia.
Fig. 2. Hypoxia mediated inhibition of mitochondrial transcription. In organelle RNA synthesis with isolated mitochondrial particles from cells
grown under control (141 Torrr O
2
) and hypoxia (1 Torr O
2
) for 10 h was carried out using [a-
32
P]UTP as described in Materials and methods. Rate
of
32
P incorporation in the RNA fraction was determined as described before [21]. RNA isolated from in vitro incubated mitochondria (5 lgeach)
was hybridized to CytOX subunit I and II encoding DNA from the mouse mitochondrial genome by slot blot hybridization. The blot was
quantified in a Bio-Rad GS-525 Molecular Imager. Rates of
32
P incorporation by mitochondria from these cells (A), transcription rates as in PC12
cells (B) and macrophages (C) were shown. (D) shows the levels of mtTFA in PC12 cells and macrophages grown under normoxia and hypoxia by
immunoblot analysis. Immunoblot analysis was carried out as described in Materials and methods using 30 lg mitochondrial protein in each case.
Ó FEBS 2003 Cytochrome c oxidase subunit expression in hypoxia (Eur. J. Biochem. 270) 875
Oxygen is essential for the biosynthesis of heme and
hence heme is considered, an oxygen sensor [31]. Addition-
ally, our previous study [11] indicated that heme not only
regulates the catalytic activity of the CytOX complex but
may also affect its stability. Based on these observations, we
determined heme aa
3
levels as well as the catalytic activity of
the CytOX complex in cells exposed to physiologically
relevant hypoxia. The heme aa
3
content of SMP directly
represents the enzyme-associated heme. In both PC12 cells
and macrophages a 38–55% decrease in heme aa
3
content
was seen after 10 h of exposure to hypoxia (Table 1). At this
time point, the CytOX activity (mol cytochrome c oxi-
dizedÆmin
)1
Æmg SMP
)1
) was reduced only marginally in
PC12 cells but was decreased by 52% in macrophages
(Table 1). With the accompanying reduction in heme aa
3
levels, the enzyme activity per mg SMP protein indicates a
change in the catalytic efficiency (TN) of the enzyme
complex in PC12 cells following exposure to hypoxia
(Table 1). Hypoxia induced heme depletion in PC12 cells,
probably caused a small, but significant increase in TN.
However, both the CytOX activity and heme content were
reduced by about 50% in macrophages exposed to hypoxia,
thus indicating a major change in the CytOX content in
these cells. These results suggest that the CytOX activity in
the two cell types is differentially modulated in response to
hypoxia.
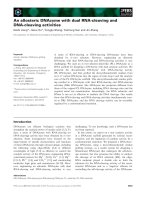
The heme a and a
3
moieties are associated with the
mitochondrial genome encoded CytOX subunit I [4,5].
The effects of hypoxic inhibition of transcription on the
subunit contents of the complex were assessed by BN/
PAGE, which allows the separation of large oligomeric
complexes based predominantly on size. Equal amounts of
SMP protein from control and hypoxia exposed macro-
phages were resolved on BN/PAGE and transferred to
PVDF membrane. The enzyme resolved as two major
complexes, which comigrated with Apo-ferritin and
b-amylase. Based on the rates of migration, the slow
migrating complex may be a dimmer and the faster
migrating complex migrating with an apparent molecular
mass of 200 kDa may be the monomeric form. It is
interesting that the levels of mitochondrial encoded
CytOX I and nuclear encoded CytOX IV and Vb in both
complexes were reduced, although we observed a more
pronounced reduction in the putative dimeric form, which
is thought to be the more active form (Fig. 3A). It is also
seen that the level of ATPase complex as determined by
immunoblotting with antibody to the F
1
ATPase did not
change under these conditions (Fig. 3B). Quantification of
the blots shows that the levels of CytOX subunits I, IV
and Vb were reduced by 50–75% in the two complexes
combined as compared to cells grown under normoxia (see
Fig. 3C). A nearly 50% reduction in enzyme activity
(Table 1) under hypoxia seems to accompany a change in
the subunit content of CytOX subunits I, IV and Vb as
seen from BN/PAGE analysis (Fig. 3A).
Table 1. Effect of hypoxia on CytOX activity, mitochondrial heme aa
3
content and TN (s
)1
) in macrophages and PC12 cells. CytOX activity in
submitochondrial particles (SMP) from standard (141 Torr O
2
) and hypoxia (1 Torr O
2
) exposed cells were assayed by measuring the rate of
oxidation of ferrocytochrome c at 550 nm. Ferrocytochrome c concentrations were determined using an absorption coefficient (reduced-oxidized)
at 550 nm of 21.1 m
M
)1
Æcm
)1
andthevaluesexpressedasmolÆmin
)1
Æmg
)1
protein. For the measurement of heme aa3 levels, the SMP were
solubilized in laurylmaltoside and heme aa3 levels were calculated from the difference spectra (dithionate/ascorbate reduced vs. air oxidized) using
an absorption coefficient 24 m
M
)1
Æcm
)1
at 605–630 nm. Values represent average of three separate experiments. TN, turnover number.
Macrophages PC12 Cells
Normoxia Hypoxia Normoxia Hypoxia
CytOX activity (nmolÆmin
)1
Æmg
)1
SMP) 2429 1160 2633 2166
Heme aa3 content (nmolÆmg
)1
SMP
)1
) 0.225 0.103 0.179 0.112
TN (nmolÆnmol heme aa
À1
3
Æs
)1
) 180 187 245 314
Fig. 3. Hypoxia induced changes in CytOX complex. SMP (30 lg
protein) from standard (141 Torr O
2
)orhypoxia(1TorrO
2
)exposed
cells were solubilized by treatment with 1% digitonin and analyzed by
BN/PAGE on 6–13% acrylamide gels as described in Materials and
methods. Proteins were transblotted to poly(vinylidene difluoride)
membrane and probed with subunit specific monoclonal antibodies
and HRP-conjugated anti-(mouse IgG) Ig (A). Stripped blots were
also probed with antibody to F
1
ATPaseandusedasaloadingcontrol
(B). Blots were imaged and quantified using BIO-RAD GS-525
Molecular imager and the difference in band intensities were depicted
as a bar chart (C).
876 C. Vijayasarathy et al.(Eur. J. Biochem. 270) Ó FEBS 2003
We also tested other mitochondrial functional param-
eters including ATP synthesis and the activities of the
Krebs cycle enzyme, isocitrate dehydrogenase, and the
electron transport enzyme NADH:ubiqunone oxidoreduc-
tase (Complex I). As shown in Table 2, there was a marked
difference in the total cell ATP synthesis as well as
mitochondrial respiration-coupled ATP synthesis in
macrophages and PC12 cells. The rate of ATP synthesis
in control PC12 cells was nearly twice that of macrophages
suggesting vastly different energy needs of these cell types.
The mitochondrial respiration-coupled ATP synthesis was
inhibited in cells grown under hypoxic conditions but the
degree of inhibition was dependent on cell type. In
macrophages, there was a 22% reduction in ATP synthesis
compared to a steep 56% reduction in PC12 cells. The
activities of isocitrate dehydrogenase and complex I were
inhibited in both cell types by 35–50% level of control cells.
Most notably, the glycolytic pathway enzymes, hexokinase
and PFK were increased nearly two fold in both cell types
(Table 2). These results are consistent with the generalized
down regulation of mitochondrial functions during hyp-
oxia and a compensatory up-regulation of alternate energy
generating systems.
Discussion
Studies in yeast have demonstrated that oxygen acts as a
molecular switch and alters the expression of the two
nuclear genome coded isoforms of CytOX V [10,32]. The
regulation of genes CytOX5a and CytOX5b, coding for the
two isofoms Va and Vb, parallels that of genes CYC1 and
CYC7, which encode iso-1 and iso-2 of yeast cytochrome c,
respectively. CytOX 5a and CYC1 are coexpressed under
aerobic conditions (O
2
>0.5l
M
), whereas CytOX 5b and
CYC7 are co-expressed under hypoxic (O
2
<0.5l
M
)and
heme deficient conditions [11]. The coexpression of specific
subunit V and cytochrome c isoforms indicates that these
isoform pairs act synergistically to regulate electron transfer
rates in enzyme function. These variant subunit isoforms
have been shown to affect the turnover rate (TN) of the
holoenzyme markedly by altering the rates of intramole-
cular electron transfer between heme a and the binuclear
reaction center. Thus the yeast, CytOX V, functions as an
oxygen/heme sensor [32].
This investigation was undertaken, to determine the effect
of hypoxia on (a) CytOX gene expression and (b) CytOX
activity. The objective was to determine if oxygen/heme
dependent regulation of mammalian CytOX genes is similar
to that observed in the yeast system. Our results show that
the levels of mitochondrial and nuclear genome encoded
CytOX mRNAs are uniformly reduced during hypoxia
(Fig. 1). We show that the reduction in mitochondrial
mRNAs may be due to reduced mitochondrial genome
transcription (Fig. 2). Although, the precise reasons for
hypoxia-induced reduction in the levels of nuclear genome
coded CytOX Vb and IV mRNA remain unknown, reduced
transcription is a likely possibility. Transcription factors
NRF1 and NRF2 (the latter factor also called GABP) that
have direct roles in the regulation of CytOX IV and Vb
genes are known to be modulated by oxidative stress [3,33].
Although reasons for reduced mitochondrial transcription
remain unclear, altered activity of mtTFA (Fig. 2D) and
phosphorylation of mtRNA polymerase (results not shown)
are the likely possibilities. Our results therefore show for the
first time that in mammalian cells physiologically relevant
hypoxia induces a coordinated down regulation of both the
nuclear and mitochondrial genes coding for the CytOX
enzyme complex. These results are also consistent with a
coordinated up or down regulation of the nuclear and
mitochondrial genes under various physiological and
pathological conditions such as cardiac growth, develop-
ment and cardiac hypertrophy [35,36].
The restoration of mRNA levels within 3–6 h following
reoxygenation indicates that the decreased ATP levels,
which follow reduced respiration (O
2
uptake) during
hypoxia, might be one of the mechanisms for reduced
transcription rates (Fig. 1 and Table 2). This is supported
by the observations of Schumacker et al. who have noted an
inhibition of cellular respiration and suppression of ATP
utilization during hypoxia [37–40]. The mammalian mito-
chondrial RNA polymerase requires a high concentration
of ATP (0.5–1 m
M
) for maximal activity. Narasimhan
and Attardi [41] showed that a high concentration of
5¢-adenylylimidodiphosphate was able to stimulate the
Table 2. Effect of hypoxia on some biochemical parameters related to mitochondrial function. ATP levels in total cell extracts were measured using the
somatic cell ATP assay kit, which is based on the assay of ATP driven luciferin luciferase assay system. ATP levels were measured in a TD-20/20
luminometer. Respiration coupled ATP synthesis by isolated mitochondria was measured by incubating mitochondria in a medium supplemented
with ADP and succinate as described in the Materials and methods section. Hexokinase and phosphofructokinase activities were measured in the
cytosolic fractions. Isocitrate dehydrogenase and NADH:ubiqinone oxidoreductase (complex I) activities were measured in isolated mitochondria
by standard methods as indicated in the Materials and methods section. Values are given as means ± SD calculated from four estimates.
Macrophages PC12 Cells
Normoxia Hypoxia Normoxia Hypoxia
Total cellular ATP (nmolÆmg protein
)1
) 10.3 ± 1.132 7.04 ± 0.774 22 ± 1.986 11 ± 1.431
Respiration coupled ATP synthesis in isolated
mitochondria (nmolÆmg protein
)1
)
36 ± 3.24 28 ± 5.7 84 ± 9.52 37 ± 5.12
Enzyme activity
Isocitrate dehydrogenase (lmolÆmin
)1
Æmg protein
)1
) 0.022 ± 0.0024 0.014 ± 0.0013 0.010 ± 0.009 0.006 ± 0.0048
Complex I (lmolÆmin
)1
Æmg protein
)1
) 0.157 ± 0.0200 0.088 ± 0.0079 0.148 ± 0.0237 0.082 ± 0.0111
Hexokinase (lmolÆmin
)1
Æmg protein
)1
) 0.016 ± 0.0021 0.028 ± 0.0034 0.048 ± 0.0067 0.068 ± 0.0986
Phosphofructokinase (lmolÆmin
)1
Æmg protein
)1
) 0.026 ± 0.0030 0.056 ± 0.0050 0.051 ± 0.0068 0.077 ± 0.0073
Ó FEBS 2003 Cytochrome c oxidase subunit expression in hypoxia (Eur. J. Biochem. 270) 877
transcription in vitro in the presence of a low concentration
of ATP. These studies suggest that while at low concentra-
tions ATP is a substrate for mitochondrial RNA poly-
merase, at high concentrations it has a regulatory function.
Reduction in cellular ATP levels (Table 2) might also be one
of the factors for the down regulation of nuclear genes
coding for the mitochondrial proteins. It is likely that the
decreased mitochondrial enzyme activities that were
observed during the exposure of lung macrophages and
rat L8 myocytes to 96 h of mild hypoxia (15–20 Torr) might
be related to such a coordinated down regulation of
mitochondrial and nuclear genes [42].
Similar to that reported for chemical hypoxia with
CoCl
2
and succinyl acetone [12], physiologically relevant
hypoxia in cultured cells also leads to rapid depletion of
heme aa
3
pools (Table 1). The observed heme depletion is
closely associated with lowered CytOX subunits I, IV and
Vb content and altered enzyme activity. Notably the
reduced subunit level is more apparent in the slow
migrating putative dimeric form of the enzyme (Fig. 3),
suggesting that reduced heme and altered subunit levels
may interfere with the formation of the more active
dimeric complex. As heme is involved in reactions that
transfer electrons from cytochrome c to molecular oxygen,
its depletion reflects alterations in the catalytic efficiency
of the enzyme complex as assessed by the TN for
cytochrome c oxidation or oxygen utilization (Table 1).
Even under hypoxia induced heme depletion and reduced
enzyme content the TN of the CytOX complex for
cytochrome c oxidation essentially remained unaltered in
macrophages, while the TN was slightly enhanced in
PC12 cells (Table 1). This is in sharp contrast to twofold
to fourfold higher TN rates for cytochrome c oxidation,
which we reported for the enzyme from heme-depleted
tissues in CoCl
2
treated animals [12]. Although the
mechanism of action of CoCl
2
is not clearly known, it
is generally believed that its action mimics hypoxia by
interfering with the incorporation of iron into heme and
thus limiting the utilization of molecular O
2
. While heme
depletion is common to both physiological and chemical
hypoxia as shown by our studies, physiological hypoxia
is also characterized by the deficiency of molecular O
2
.
Employing a variety of experimental systems that included
hepatocytes or isolated mitochondria, Schumacker et al.
demonstrated the inhibition of CytOX during hypoxia
[37–40]. They proposed that inhibition of CytOX is an
adaptive response to inhibition of respiration during
hypoxia. In a polarographic assay that employed TMPD
as a substrate, they observed that the decrease in TN
occurred more rapidly at 0 l
M
oxygen compared with 25
or 50 l
M
(approximately 13–27 Torr) O
2
concentrations.
However, the data on TN of the enzyme was obtained
using isolated bovine enzyme exposed to varying levels of
hypoxic conditions. Our results suggest that such a
decrease in TN of the enzyme might be a late event in
intact cells exposed to hypoxia. It is more likely that these
differences in TN represent the different stages of adaptive
response to hypoxia.
Based on the results of our study and those of
Schumacker, it is reasonable to conclude that the effects
of hypoxia on CytOX gene expression and its activity are
secondary to suppression of respiration during hypoxia. In
the absence of differential regulation of a specific nuclear
gene coding for the subunits of CytOX, changes in the
microenvironment of the cell may induce alterations in the
catalytic efficiency of mammalian enzyme. Selective loss of
CytOX subunits I/II and IV might be important factors in
altered catalytic activity [12]. Alternatively, subunit phos-
phorylation as suggested in studies by Kadenbach [43,44]
and others, including our own [12] might be involved in
altered catalytic function of the enzyme complex. In
summary, altered respiration and oxygen-regulated alter-
ations in ATP and heme pools might have a direct effect on
the activity of the complex.
Acknowledgements
We are thankful to members of the Avadhani lab for useful discussions
and comments during the course of this work. We also thank Dr David
Clayton for providing antibody to mouse mtTFA. This research was
supported in part by National Institute of Health (USA) grant GM-
49683.
References
1. Taanman, J.W. (1997) Human cytochrome c oxidase: structure,
function, and deficiency. J. Bioenerg. Biomemb. 29, 151–163.
2. Capaldi, R.A. (1990) Structure and function of cytochrome c
oxidase. Annu. Rev. Biochem. 59, 569–596.
3. Lenka, N., Vijayasarathy, C., Mullick, J. & Avadhani, N.G.
(1988) Structural organization and transcription regulation of
nuclear genes encoding the mammalian cytochrome c oxidase
complex. Prog. Nucleic Acid Res. Mol. Biol. 61, 309–344.
4. Yoshikawa, S. (1999) X-ray structure and reaction mechanism of
bovine heart cytochrome c oxidase. Biochem. Soc. Transac. 27,
351–362.
5. Regan, J.J., Ramirez, B.E., Winkler, J.R., Gray, H.B. &
Malmstrom, B.G. (1998) Pathways for electron tunneling in
cytochrome c oxidase. J. Bioenerg. Biomembr. 30, 35–39.
6. Bonne, G., Seibel, P., Possekel, S., Marsac, C. & Kadenbach, B.
(1993) Expression of human cytochrome c oxidase subunits during
fetal development. Eur. J. Biochem. 217, 1099–1107.
7. Taanman, J.W., Hall, R.E., Tang, C., Marusich, M.F., Kenna-
way, N.G. & Capaldi, R.A. (1993) Tissue distribution of cyto-
chrome c oxidase isoforms in mammals. Characterization with
monoclonal and polyclonal antibodies. Biochim. Biophys. Acta.
1225, 95–100.
8. Anthony, G., Reimann, A. & Kadenbach, B. (1993) Tissue-
specific regulation of bovine heart cytochrome-c oxidase activity
by ADP via interaction with subunit VIa. Proc. Natl Acad. Sci.
USA 90, 652–656.
9. Weishaupt, A. & Kadenbach, B. (1992) Selective removal of
subunit VIb increases the activity of cytochrome c oxidase. Bio-
chemistry 31, 11477–11481.
10. Poyton, R.O. & Dagsgaard, C.J. (2000) Mitochondrial-nuclear
crosstalk is involved in oxygen-regulated gene expression in yeast.
Adv. Exp. Med. Biol. 475, 177–184.
11. Burke, P.A. & Poyton, R.O. (1998) Structure/function of oxygen-
regulated isoforms in cytochrome c oxidase. J. Exp. Biol. 201,
1163–1175.
12. Vijayasarathy, C., Damle, S., Lenka, N. & Avadhani, N.G. (1999)
Tissue variant effects of heme inhibitors on the mouse cytochrome
c oxidase gene expression and catalytic activity of the enzyme
complex. Eur. J. Biochem. 266, 191–200.
13. Otto, C.M. & Baumgardner, J.E. (2001) Effect of culture PO2 on
macrophage (RAW 264.7) nitric oxide production. Am.J.Physiol.
280, C280–C287.
878 C. Vijayasarathy et al.(Eur. J. Biochem. 270) Ó FEBS 2003
14. Lowry, O.H., Rosebrough, N.J., Farr, A.L. & Randall, R.J.
(1951) Protein measurement with the Folin Phenol reagent. J. Biol.
Chem. 193, 265–275.
15. Chomczynski, P. & Sacchi, N. (1987) Single-step method of RNA
isolation by acid guanidinium thiocyanate-phenol-chloroform
extraction. Anal. Biochem. 162, 156–159.
16. Wellauer, P.K. & Dawid, I.B. (1979) Isolation and sequence
organization of human ribosomal DNA. J. Mol. Biol. 128, 289–303.
17. Bhat, N.K., Niranjan, B.G. & Avadhani, N.G. (1982) Qualitative
and comparative nature of mitochondrial translation products in
mammalian cells. Biochemistry 21, 2452–2460.
18. Pedersen, P.L., Greenawalt, J.W., Reynafarje, B., Hullihen, J.,
Decker, G.L., Soper, J.W. & Bustamente, E. (1978) Preparation
and characterization of mitochondria and submitochondrial par-
ticles of rat liver and liver-derived tissues. Methods Cell. Biol. 20,
411–481.
19. Kantharaj, G.R., Bhat, K.S. & Avadhani, N.G. (1983) Mode
of transcription and maturation of ribosomal ribonucleic acid
in vitro in mitochondria from Ehrlich ascites cells. Biochemistry
22, 3151–3156.
20. Smith, L. (1955) Spectrophotometric assay of cytochrome c
oxidase. In Methods in Biochemical Analysis (Glick, D., ed.), Vol.
2, pp. 427–434.
21. Buge, U. & Kadenbach, B. (1986) Influence of buffer composition,
membrane lipids and proteases on the kinetics of reconstituted
cytochrome-c oxidase from bovine liver and heart. Eur. J. Bio-
chem. 161, 383–390.
22. Laemmli, U.K. (1970) Cleavage of structural proteins during the
assembly of the head of bacteriophage T4. Nature 227, 680–685.
23. Vijayasarathy, C., Biunno, I., Lenka, N., Yang, M., Basu, A.,
Hall, I.P. & Avadhani, N.G. (1998) Variations in the subunit
content and catalytic activity of the cytochrome c oxidase complex
from different tissues and different cardiac compartments. Bio-
chim. Biophys. Acta. 1371, 71–82.
24. Schagger, H. & von Jagow, G. (1991) Blue native electrophoresis
for isolation of membrane protein complexes in enzymatically
active form. Anal. Biochem. 199, 223–231.
25. Estornell, E., Fato, R., Pallotti, F. & Lenaz, G. (1993) Assay
conditions for the mitochondrial NADH: coenzyme Q oxido-
reductase. FEBS Lett. 332, 127–131.
26. Plaut, G.W.E. (1969) Isocitrate dehydrogenase (DPN specific)
from bovine heart. Methods Enzymol. 13, 34–42.
27. Joshi, M.D. & Jagannathan, V. (1968) Properties and kinetics and
purified brain hexokinase. Arch. Biochem. Biophys. 125, 460–467.
28. Mansour, T.E., Wakid, N. & Sprouse, H.M. (1966) Studies on
heart phosphofructokinase. Purification, crystallization, and
properties of sheep heart phosphofructokinase. J. Biol. Chem. 241,
1512–1521.
29. Shadel, G.S. & Clayton, D.A. (1993) Mitochondrial transcription
initiation, variation and conservation. J. Biol. Chem. 268, 16083–
16086.
30. Larsson, N.G., Wang, J., Wilhelmsson, H., Oldfors, A., Rustin,
P., Lewandoski, M., Barsh, G.S. & Clayton, D.A. (1994)
Mitochondrial transcription factor A is necessary for mtDNA
maintenance and embryogenesis in mice. Nat. Genet. 18, 231–236.
31. Kwast, K.E., Burke, P.V. & Poyton, R.O. (1998) Oxygen sensing
and the transcriptional regulation of oxygen-responsive genes in
yeast. J. Exp. Biol. 201, 1177–1195.
32. Poyton, R.O. (1999) Models for oxygen sensing in yeast: impli-
cations for oxygen-regulated gene expression in higher eucaryotes.
Resp. Physiol. 115, 119–133.
33. Chinenov, Y., Schmidt, T., Yang, X.Y. & Martin, M.E. (1998)
Identification of redox-sensitive cysteines in GA-binding protein-
alpha that regulate DNA binding and heterodimerization. J. Biol.
Chem. 273, 6203–6209.
34. Kwong, M., Kan, Y.W. & Chan, J.Y. (1999) The CNC basic
leucine zipper factor, Nrf1, is essential for cell survival in response
to oxidative stress-inducing agents. Role for Nrf1 in gamma-gcs
(1) and gss expression in mouse fibroblasts. J. Biol. Chem. 274,
37491–37498.
35. Marin-Garcia, J., Ananthakrishnan, R., Agrawal, N. & Gold-
enthal, M.J. (1994) Mitochondrial gene expression during bovine
cardiac growth and development. J. Mol. Cell Cardiol. 26, 1029–
1036.
36. Wiesner, R.J., Aschenbrenner, V., Ruegg, J.C. & Zak, R. (1994)
Coordination of nuclear and mitochondrial gene expression dur-
ing the development of cardiac hypertrophy in rats. Am.J.Phy-
siol. 267, C229–C235.
37. Chandel, N., Budinger, G.R., Kemp, R.A. & Schumacker, P.T.
(1995) Inhibition of cytochrome-c oxidase activity during pro-
longed hypoxia. Am. J. Physiol. 268, L918–L925.
38. Chandel, N.S., Budinger, G.R. & Schumacker, P.T. (1996)
Molecular oxygen modulates cytochrome c oxidase function.
J. Biol. Chem. 271, 18672–18677.
39. Chandel, N.S., Budinger, G.R., Choe, S.H. & Schumacker, P.T.
(1997) Cellular respiration during hypoxia. Role of cytochrome
oxidase as the oxygen sensor in hepatocytes. J. Biol. Chem. 272,
18808–18816.
40. Chandel, N.S. & Schumacker, P.T. (2000) Cellular oxygen sensing
by mitochondria: old questions, new insight. J. Appl. Physiol. 88,
1880–1889.
41. Narasimhan, N. & Attardi, G. (1987) Specific requirement for
ATP at an early step of in vitro transcription of human
mitochondrial DNA. Proc. Natl Acad. Sci. USA 84, 4078–4082.
42. Murphy, B.J., Robin, E.D., Tapper, D.P., Wong, R.J. & Clayton,
D.A. (1984) Hypoxic coordinate regulation of mitochondrial
enzymes in mammalian cells. Science 223, 707–709.
43. Kadenbach, B. & Arnold, S. (1999) A second mechanism of
respiratory control. FEBS Lett. 447, 131–134.
44. Bender, E. & Kadenbach, B. (2000) The allosteric ATP-inhibition
of cytochrome c oxidase activity is reversibly switched on by
cAMP-dependent phosphorylation. FEBS Lett. 466, 130–134.
Ó FEBS 2003 Cytochrome c oxidase subunit expression in hypoxia (Eur. J. Biochem. 270) 879