Tài liệu Báo cáo khoa học: Metabolic flux profiling of Escherichia coli mutants in central carbon metabolism using GC-MS docx
Bạn đang xem bản rút gọn của tài liệu. Xem và tải ngay bản đầy đủ của tài liệu tại đây (553.94 KB, 12 trang )
Metabolic flux profiling of
Escherichia coli
mutants in central
carbon metabolism using GC-MS
Eliane Fischer and Uwe Sauer
Institute of Biotechnology, ETH Zu
¨
rich, Zu
¨
rich, Switzerland
We describe here a novel methodology for rapid diagnosis of
metabolic changes, which is based on probabilistic equations
that relate GC-MS-derived mass distributions in proteino-
genic amino acids to in vivo enzyme activities. This metabolic
flux ratio analysis by GC-MS provides a comprehensive
perspective on central metabolism by quantifying 14 ratios
of fluxes through converging pathways and reactions from
[1-
13
C] and [U-
13
C]glucose experiments. Reliability and
accuracy of this method were experimentally verified by
successfully capturing expected flux responses of Escherichia
coli to environmental modifications and seven knockout
mutations in all major pathways of central metabolism.
Furthermore, several mutants exhibited additional, unex-
pected flux responses that provide new insights into the
behavior of the metabolic network in its entirety. Most
prominently, the low in vivo activity of the Entner–
Doudoroff pathway in wild-type E. coli increased up to a
contribution of 30% to glucose catabolism in mutants of
glycolysis and TCA cycle. Moreover, glucose 6-phosphate
dehydrogenase mutants catabolized glucose not exclusively
via glycolysis, suggesting a yet unidentified bypass of this
reaction. Although strongly affected by environmental
conditions, a stable balance between anaplerotic and TCA
cycle flux was maintained by all mutants in the upper part of
metabolism. Overall, our results provide quantitative insight
into flux changes that bring about the resilience of metabolic
networks to disruption.
Keywords: Entner–Doudoroff pathway; flux analysis;
fluxome; METAFoR analysis; pentose phosphate path-
way.
Comprehensive and quantitative understanding of bio-
chemical reaction networks requires not only knowledge
about their constituting components, but also information
about the behavior of the network in its entirety. Toward
this end, systems-oriented methodologies were developed
that simultaneously access the level of reaction intermedi-
ates [1] or rates of reactions [2–5], also referred to as the
metabolome [6] and the fluxome [7], respectively. The most
important property of biochemical networks are the per se
nonmeasurable in vivo reaction rates, which may be
estimated by so-called metabolic flux analysis that provides
a holistic perspective on metabolism.
In its simplest form, metabolic flux analysis relies on flux
balancing of extracellular consumption and secretion rates
within a stoichiometric reaction model [5]. To increase
reliability and resolution of such flux balancing analyses,
additional information may be derived from
13
C-labeling
experiments. In this approach,
13
C-labeled substrates are
administered and
13
C-labeled products of metabolism are
analyzed by methods that distinguish between different
isotope labeling patterns, in particular NMR and MS
[2,3,8]. In the most advanced methodology, a comprehen-
sive isotope isomer (isotopomer) model of metabolism is
used to map metabolic fluxes in an iterative fitting procedure
on the isotopomer pattern of network metabolites that are
deduced from NMR or MS data [2]. This global data
interpretation enables integrated and quantitative consid-
eration of all physiological and
13
C-labeling data. Typically,
protein hydrolysates are subjected to NMR or GC-MS
analysis, which provides not only isotopomer pattern of the
amino acids but also of their related precursor molecules
that are key components of central metabolism. With the
presently available models and software, these isotopomer
balancing methods have attained a high level of precision
and applicability [2,9,10].
In contrast to isotopomer balancing, direct analytical
interpretation of
13
C-labeling patterns has long been used not
only to identify biochemical pathways and reactions but also
to quantify individual flux partitioning ratios [3,11,12]. Such
analytically deduced flux ratios were also used successfully as
constraints for metabolic flux analysis [13–15]. Based on
probabilistic equations, a more general methodology was
developed to simultaneously identify network topology and
multiple flux partitioning ratios [16,17]. This metabolic flux
ratio analysis was based on the detection of
13
C-labeling
patterns in proteinogenic amino acids by NMR analysis, and
provides direct evidence for a particular flux. Global isotopic
data interpretation by isotopomer balancing and strictly
local metabolic flux ratio analysis are largely independent.
Correspondence to U. Sauer, Institute of Biotechnology,
ETH Zu
¨
rich, CH-8093 Zu
¨
rich, Switzerland.
Fax: + 41 1 633 10 51, Tel.: + 41 1 633 36 72,
E-mail:
Abbreviations: MDV, mass distribution vector; G6P, glucose-
6-phosphate; F6P, fructose-6-phosphate; P5P, pentose phosphates;
E4P, erythrose-4-phosphate; PEP, phosphoenolpyruvate;
OAA, oxaloacetate; OGA, 2-oxoglutarate; PTS, phosphoenol
pyruvate:glucose phosphotransferase system; PP pathway, pentose
phosphate pathway; ED pathway, Entner–Doudoroff pathway;
TCA cycle, tricarboxylic acid cycle; CDW, cellular dry weight.
(Received 29 August 2002, revised 10 December 2002,
accepted 7 January 2003)
Eur. J. Biochem. 270, 880–891 (2003) Ó FEBS 2003 doi:10.1046/j.1432-1033.2003.03448.x
Hence, the favorable agreement of results obtained by both
approaches for the same experimental data provides strong
evidence for their reliability [18,19].
Here we develop a novel methodology for metabolic flux
ratio analysis based on GC-MS data from [1-
13
C] and
[U-
13
C]glucose experiments. This methodology is used for
metabolic network analysis in Escherichia coli strains with
knockout mutations in all major pathways of central carbon
metabolism. The analyses presented here provide not only
novel insights into central metabolism but represent also
experimental verification of the reliability of metabolic flux
ratio analysis by GC-MS.
Materials and methods
Strains, media, and growth conditions
The nomenclature of the employed E. coli knockout
mutants indicates the affected genes (Table 1). Unless
indicated otherwise, aerobic batch cultures were grown at
37 °C in 500 mL baffled shake flasks with 50 mL of M9
minimal medium on a gyratory shaker at 200 r.p.m.
Anaerobic cultures were grown in 100 mL sealed glass
flasks containing 50 mL medium that was gassed with N
2
prior to sterilization for 10 min. The M9 medium contained
per litre of deionized water: 0.8 g NH
4
Cl, 0.5 g NaCl, 7.52 g
Na
2
HPO
4
,and3.0gKH
2
PO
4
. The following components
were sterilized separately and then added (per litre of final
medium): 2 mL of 1
M
MgSO
4
,1 mLof0.1
M
CaCl
2
,1 mL
of 1 mgÆL
)1
thiamine HCl (filter sterilized), and 10 mL of a
trace element solution containing (per litre) 16.67 g
FeCl
3
Æ6H
2
O, 0.18 g ZnSO
4
Æ7H
2
O, 0.12 g CuCl
2
Æ2H
2
O,
0.12 g MnSO
4
ÆH
2
O, 0.18 g CoCl
2
Æ6H
2
O, and 22.25 g
Na
2
EDTAÆ2H
2
O. Filter-sterilized glucose was added to a
final concentration of 3 g per litre. For
13
C-labeling
experiments, glucose was added either entirely as the
[1-
13
C] labeled isotope isomer (> 99%; Euriso-top, GIF-
sur-Yvette, France) or as a mixture of 20% (w/w) [U-
13
C]
(
13
C, > 98%; Isotech, Miamisburg, OH) and 80% (w/w)
natural glucose. The
13
C-enrichment of [U-
13
C]glucose was
independently determined to be 98.7% from cells grown
exclusively on [U-
13
C]glucose.
Analytical procedures and physiological parameters
Cell growth was monitored by measuring the optical density
at 600 nm (D
600
). Glucose concentrations were determined
enzymatically using a commercial kit (Beckman, Palo Alto,
CA, USA). The following physiological parameters were
determined during the exponential growth phase in batch
cultures as described previously [7]: Maximum growth rate,
biomass yield on glucose, and specific glucose consumption
rate, using a predetermined correlation factor of 0.44 g
cellular dry weight (CDW) per D
600
unit.
Sample preparation and GC-MS measurements
Aliquots of batch cultures were harvested during the mid-
exponential growth-phase, defined as D
600
of 0.8–1.5, and
centrifuged at 14 000 g at room temp. for 5 min. Pellets
were washed once in 1 mL 0.9% (w/v) NaCl and hydro-
lyzed in 1.5 mL 6
M
HCl at 105 °Cfor24hinsealedglass
tubes. The hydrolysate was dried in a vacuum centrifuge
at room temperature and derivatized at 85 °Cin50lL
tetrahydrofurane (Fluka, Switzerland) and 50 lLof
N-(tert-butyldimethylsilyl)-N-methyl-trifluoroacetamide
(Fluka, Switzerland) for 60 min [20]. 1 lL of derivatized
sample was injected into a series 8000 GC, combined
with an MD 800 mass spectrometer (Fisons Instruments,
Beverly, MA, USA), on a SPB-1 column (SUPELCO,
30 m · 0.32 mm · 0.25 lm fused silica) with a split
injection of 1 : 20. GC conditions were: carrier gas
(helium) flow rate at 2 mL per min, oven temperature
programmed from 150 °C(2min)to280°Cat3°Cper
min, source temperature at 200 °C and interface tempera-
ture at 250 °C. Electron impact (EI) spectra were obtained
at )70 eV. GC-MS raw data were analyzed using the
software package MassLab (Fisons), avoiding detector
overload and isotope fractionation as described [20].
The amino acids analyzed by GC-MS were aspartate,
glutamate, glycine, histidine, isoleucine, leucine, phenyl-
alanine, proline, serine, threonine, tyrosine, and valine for
[U-
13
C]glucose experiments and aspartate, isoleucine, leu-
cine, phenylalanine, serine, threonine, tyrosine, and valine
for [1-
13
C] experiments.
Bioreaction network
The considered E. coli bioreaction network was described
previously [18] but included additionally the ED pathway
[21] and threonine aldolase [22] (Fig. 1). The amino-acid-
carbon skeletons were derived from the metabolic inter-
mediates PEP, Pyruvate, P5P, E4P, OAA, and OGA as
described [16].
Table 1. E. coli strains used in this study. The original strain designation is given in parentheses.
Strains Relevant characteristics Reference
MG1655 Wild-type K12 strain (k
–
F
–
rph-1) [44]
W3110 Wild-type K12 strain (k
–
F
–
IN(rrnD-rrnE)1 rph-1) [44]
JM101 [F
–
traD36 lacI
q
D(lacZ)M15 proA
+
B
+
supE thi D(lac-proAB)] [45]
Zwf G6P dehydrogenase-deficient K10 (DF2001) [46]
Pgi Phosphoglucose isomerase-deficient W3110 (LJ110) [47]
PfkA Phosphofructokinase-deficient K10 (AM1) [48]
PykAF Pyruvate kinase-deficient JM101 (PB25) [49]
Mae/Pck Malic enzymes (ScfA and Mae)- and PEP carboxykinase-deficient K12 (EJ1321) [50]
SdhA/Mdh Succinate dehydrogenase- and malate dehydrogenase-deficient MG1655 (DL323) [29]
FumA Fumarase A-deficient K12 (EJ1535) [30]
Ó FEBS 2003 Metabolic flux profiling in E. coli (Eur. J. Biochem. 270) 881
Correction for naturally occurring isotopes
The obtained EI spectral data are sets of ion clusters, each
representing the distribution of mass isotopomers of a given
amino-acid fragment. For each fragment a,amass
isotopomer distribution vector (MDV):
MDV
a
¼
ðm
0
Þ
ðm
1
Þ
ðm
2
Þ
ÁÁÁ
ðm
n
Þ
2
6
6
6
6
4
3
7
7
7
7
5
with
X
m
i
¼ 1 ð1Þ
was assigned, where m
0
is the fractional abundance of
fragments with the lowest mass and m
i>0
the abundances of
molecules with higher masses. These higher masses result
from isotope signals that originate from (a) natural abun-
dance in non-C-atoms, (b) natural abundance of
13
Cinthe
derivatization reagent, and (c)
13
C in the carbon skeleton of
the amino-acid fragment that were incorporated from
naturally or artificially
13
C-labeled substrates. To obtain
the exclusive mass isotope distribution of the carbon
skeleton, MDV
a
were corrected for the natural isotope
abundance of O, N, H, Si, S, and C atoms in the derivatizing
agent by using correction matrices as described elsewhere
[23], yielding MDV*
a
. Prior to analysis, the contribution of
13
C from unlabeled biomass in culture inocula was
subtracted from MDV*
a
yielding MDV
AA
according to
MDV
AA
¼
MDV
Ã
a
À f
unlabeled
ÁMDV
unlabeled;n
ð1 À f
unlabeled
Þ
ð2Þ
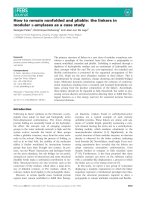
Fig. 1. Bioreaction network of E. coli central carbon metabolism. Arrows indicate the assumed reaction reversibility. Solid arrows indicate precursor
withdrawal for the amino acid analyzed by GC-MS. Inactivated proteins in the investigated knockout mutants are highlighted in boxes. Abbre-
viations: 6PG, 6-phosphogluconate; S7P, seduheptulose-7-phosphate; T3P, triose-3-phosphate; PGA 3-phosphoglycerate.
882 E. Fischer and U. Sauer (Eur. J. Biochem. 270) Ó FEBS 2003
where f
unlabeled
is the fraction of unlabeled biomass and
MDV
unlabeled,n
is the mass distribution of an unlabeled
fragment of length n. Its elements i can be calculated from
the natural abundances of
12
Cand
13
C according to
Eqn (3).
MDV
unlabeled;n
ðiÞ
¼ c
ðnÀiÞ
0
c
ðiÞ
1
n
i
ð3Þ
c
0
and c
1
represent the natural abundance of
12
Cand
13
C,
respectively, and
n
i
ÀÁ
is a binomial coefficient. The corrected
MDV
AA
now represent the mass distributions of the carbon
skeletons due to substrate incorporation (Fig. 2A).
MDV of metabolites
Amino acids are derived from one or more metabolic
intermediates and MDV
M
of these metabolites (or their
fragments) can easily be derived from the MDV
AA
,as
illustrated schematically in Fig. 2A. If we assume that the
carbon skeleton of an amino acid originates from the
metabolites M1 and M2, the mass distribution vector
MDV
AA
is a combination of the mass distributions
MDV
M1
and MDV
M2
and can be derived by element-wise
multiplication according to:
MDV
AA
ðiÞ¼MDV
M1
 MDV
M2
¼
X
i
j¼0
MDV
M1
ði À jÞÁMDV
M2
ðjÞð4Þ
MDV
M
were obtained from a least squares fit to all
MDV
AA
using the MATLAB function lsqnonlin with the
additional constraint that the sum of their element equals 1.
MDV of substrate fragments
A fragment with n carbon atoms of a mixture of uniformly
and naturally labeled substrate has the following mass
distribution
MDV
S;n
U
ðiÞ¼ ð1 À lÞ c
ðnÀiÞ
0
c
i
1
þ lð1 À pÞ
ðnÀiÞ
p
i
n
i
ð5Þ
where l is the labeled fraction and p is the purity of the
labeled substrate. A fragment of a substrate that is
13
C-labeled at a specific position can either be unlabeled,
thus having the mass distribution MDV
unlabeled,n
(Eqn 3) or
it may contain the
13
C-labeled position leading to
MDV
S;n
1
(i)¼ð1ÀlÁpÞc
ðnÀiÞ
0
c
i
1
n
i
þlÁp c
ðnÀiÞ
0
c
iÀ1
1
nÀ1
iÀ1
ð6Þ
A summary of all obtained MDV is given in Table 2.
Calculation of metabolic flux ratios
The intracellular pool of a given metabolite can be derived
from other metabolite pools through biochemical pathways
(Fig. 2B). The fractional contribution f of a pathway to a
target metabolite pool with MDV1 was determined as:
f ¼
MDV1 À MDV3
MDV2 À MDV3
ð7Þ
where MDV2 and MDV3 are the mass distributions of the
source metabolites degraded through the examined and the
alternative pathway, respectively. As MDV are vectors and
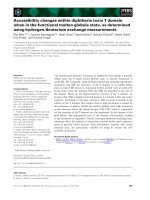
Fig. 2. Example of the information flow from experimentally deter-
mined mass distributions in amino acids to metabolites (A) and the
calculation of flux ratios (B). Bars illustrating the mass distribution
(m
0
, m
1
,…,m
n
)aredrawntoscalefortheexampleofanE. coli batch
culture grown on a mixture of 20% [U-
13
C] and 80% unlabeled
glucose. Mass distributions of amino-acid fragments (MDV
AA
)are
obtained from the experimentally determined MDVa by correction for
natural isotope abundance and unlabeled biomass fraction. Mass
distributions of metabolite fragments (MDV
M
)arecalculatedfrom
MDV
AA
by using Eqn (4). (B) MDV
M
of different metabolites are
used to calculate split ratios of diverging pathways and the MDV of
CO
2
according to Eqn (9).
Ó FEBS 2003 Metabolic flux profiling in E. coli (Eur. J. Biochem. 270) 883
not single data points, f represents the least-squares solution
to Eqn (7). Accordingly, using MDV with n elements, up to
n alternative pathways can be distinguished. For example,
the individual contributions of three converging pathways is
determined as:
f
1
f
2
!
¼
MDV1 À MDV4
MDV2 À MDV4
MDV3 À MDV4
!
ð8Þ
with f
3
¼ 1 ) f
1
) f
2
.
The origin of several intracellular metabolite pools can be
determined with Eqns (7) and (8). Specifically, MDV
M
of six
metabolites and MDV
AA
of two amino acids were used for
metabolic flux ratio analysis (Table 2) together with MDV
S
of substrate fragments. In some cases, however, the
metabolic precursors MDV2 or MDV3 were combinations
of two MDV
M
. Eqn (4) was applied to calculate the mass
distribution of these combinations.
Pentose phosphate pathway
E. coli can potentially catabolize glucose to trioses via three
different biochemical pathways, i.e. glycolysis, ED pathway,
and PP pathway [24] (Fig. 1). Upon growth on a mixture of
[U-
13
C] and unlabeled glucose, introduction and cleavage
of bonds between carbon atoms is reflected in the MDV
M
of
PEP, P5P, and E4P. As glucose catabolism through the
glycolysis and the ED pathway yields uncleaved trioses, the
activity of these two pathways is indistinguishable with
[U-
13
C]glucose. The activity of transketolase and trans-
aldolase in the nonoxidative PP pathway, however, can be
accessed.
As exchange fluxes between serine and glycine [16] clearly
influence the mass distribution of serine, PEP
(1)2)
was used
to determine the fraction of trioses that were cleaved and
rearranged between C
1
–C
2
by the action of transketolase,
and compared to the fraction that originates from an
unbroken two carbon unit of glucose according to Eqn (7).
An upper bound for PEP molecules that were generated
from P5P can be calculated assuming that five trioses are
produced from three pentoses and that at least two trioses
are rearranged by transketolase. It should be noted that the
thus calculated fraction of PEP originating from P5P does
not necessarily reflect glucose catabolism through the PP
pathway, but may likewise result from a reversible exchange
flux via transketolase.
Two other metabolites that reflect transketolase and
transaldolase activities are P5P and E4P. P5P molecules
may be produced either via the oxidative PP pathway
from G6P, thus yielding an intact five carbon skeleton
from a source molecule of glucose, or via the transketolase
reaction, which cleaves between C
3
–C
4
. Additionally, P5P
may also originate from E4P and a one carbon unit
through the combined action of transaldolase and trans-
ketolase. The contributions of the three converging
pathways are thus calculated using Eqn (8). As transketo-
lase can reversibly cleave P5P and multiple cycling may
occur through the PP pathway, P5P from G6P is
calculated as a lower bound for the fraction of P5P
molecules that were generated via the oxidative PP
pathway.
The second PP pathway intermediate, E4P, is either
produced from F6P as an uncleaved four carbon unit or via
the combined activity of transketolase and transaldolase
from P5P. The latter introduces E4P molecules with cleaved
C
1
–C
2
bonds originating from the fraction of P5P that was
cleaved between C
3
–C
4
. The E4P pool was analyzed using
Eqn (7).
Anaplerosis and the TCA Cycle
[U-
13
C]glucose experiments were also used to distinguish
OAA produced either from a four carbon unit via the
TCA cycle or from PEP and CO
2
via the anaplerotic
reaction catalyzed by PEP carboxylase (see also Fig. 2).
OAA
(1)4)
can thus be derived from the mass distribution
of OGA
(2)5)
or from a combination of the MDV of PEP
with CO
2
, according to Eqn (4). As the fractional
labeling of CO
2
(l
CO
2
) is unknown in batch cultures
and may be lower than the fractional enrichment of the
input substrate, it was treated as an additional unknown
using
f
f à l
CO
2
!
¼
OAA
ð1À4Þ
À OGA
ð2À5Þ
Â
PEP
ð1À3Þ
0
Ã
À OGA
ð2À5Þ
0 PEP
ð1À3Þ
ÂÃ
À PEP
ð1À3Þ
0
ÂÃ
!
ð9Þ
The fraction of OAA molecules that originate through the
TCA cycle is thus determined as 1 ) f. The remaining
fraction originates from PEP either through PEP carboxy-
lase or through reversible malic enzyme via pyruvate.
Additionally, the fraction of OAA
(1)4)
derived from
glyoxylate via the glyoxylate shunt can be detected as a
combination of pyruvate
(2)3)
and OAA
(1)2)
.
Table 2. Mass distribution vectors used for flux ratio analysis. The
carbon atoms included in each considered fragment are specified for
each MDV
M
and MDV
AA
.MDV
S
are described by the length n of the
fragment and its
13
C-content. U, 20% [U-
13
C] and 80% unlabeled
glucose experiment; 1, 100%[1-
13
C]glucose experiment.
Experiment MDV
Metabolite
PEP U PEP
(1)3)
PEP
(2)3)
PEP
(1)2)
1 PEP
(1)2)
Pyruvate U Pyruvate
(1)3)
Pyruvate
(2)3)
1 Pyruvate
(1)3)
Pyruvate
(2)3)
OAA U OAA
(1)4)
OAA
(2)4)
OAA
(1)2)
1 OAA
(1)4)
OAA
(2)4)
OAA
(1)2)
OGA U OGA
(1)5)
OGA
(2)5)
1 OGA
(1)5)
OGA
(2)5)
E4P U E4P
(1)4)
P5P U P5P
(1)5)
1 P5P
(1)5)
Amino acid
Serine U Serine
(1)3)
Serine
(2)3)
Serine
(1)2)
1 Serine
(1)3)
Serine
(2)3)
Serine
(1)2)
Glycine U Glycine
(1)2)
1 Glycine
(1)2)
Substrate
Glucose U Glc,n
U
1 Glc,n
1
Glc,n
unlabeled
884 E. Fischer and U. Sauer (Eur. J. Biochem. 270) Ó FEBS 2003
Gluconeogenic reactions
Fluxes from the TCA cycle to the lower part of glycolysis
via malic enzyme and PEP carboxykinase can be diagnosed
as cleaved C
2
–C
3
bonds in pyruvate and PEP, respectively.
The interconversion of malate to pyruvate via the malic
enzymes (ScfA and Mae) can thus be determined by
comparing the pyruvate
(2)3)
and PEP
(2)3)
fragments using
Eqn (7). As the mass distribution of malate is unknown, a
pyruvate
(2)3)
molecule produced via malic enzyme was
assumed to have the mass distribution of two combined one
carbon units, each with the fractional
13
C-label of the input
glucose. This assumption includes (a) that all malate
molecules are broken between C
2
–C
3
, thus are derived from
OGA, and (b) that the fractional enrichment of C
2
and C
3
in
malate does not differ from the fractional enrichment in the
input substrate. A dilution of the fractional enrichment
might be observed, for example, in positions where CO
2
is
introduced. This, however, may occur only at C
1
or C
4
of
malate, thus does not affect the present calculation of the
lower bound for malic enzyme activity. If the malate pool is
in equilibrium with OAA, intact C
2
–C
3
fragments from
anaplerosis are present in malate. Thus, an upper bound for
pyruvate produced through malic enzyme can be defined for
the extreme case of full equilibration of the malate and
OAA pools.
Similarly, PEP carboxykinase activity can be detected in
the cleaved fraction of PEP
(2)3)
using Eqn (7). As a cleaved
C
2
–C
3
bond in PEP may also result from transaldolase
activity, the thus calculated fraction of PEP originating
from OAA remains an upper bound on the PEP carboxy-
kinase activity.
C1-metabolism
The reversible exchange of the serine and glycine pools was
quantified by determining the fraction of serine
(1)3)
origin-
ating from glycine
(1)2)
and a one carbon unit vs. the fraction
that is identical with PEP
(1)3)
(Eqn 7). Additionally, the
fraction of glycine
(1)2)
derived from serine
(1)2)
was attained
assuming that the remaining glycine fraction with two
independent C atoms originates from CO
2
and a one carbon
unit through the reversible glycine cleavage pathway or
through threonine cleavage catalyzed by the threonine
aldolase. The latter enzyme was reported to be active in
E. coli under some conditions, albeit not those used here
[22,25].
Calculation of metabolic flux ratios from [1-
13
C]glucose
experiments
To obtain more precise information about the in vivo
activities of the PP and ED pathway and the PEP
carboxykinase, positional labeling was detected from cells
grown exclusively on [1-
13
C]glucose. As the MDV of PEP
could not be obtained in [1-
13
C]glucose experiments, serine
was used instead to quantify the relative contribution of
glycolysis to triose-3P synthesis, compared to the PP and
ED pathways. The exchange flux with glycine does not
change the label content in serine, unless substantial
fractions of glycine or the one carbon unit are produced
from sources other than serine. The oxidative PP or the ED
pathway both yield unlabeled triose-3P, while glycolysis
yields 50% unlabeled and 50% triose-3P that is
13
C-labeled
at C
1
(Eqn 7).
If the ED pathway is active, additional label is introduced
at the level of pyruvate, resulting in different MDV of
serine
(1)3)
and pyruvate
(1)3)
, which can be used to assess the
relative contribution of this pathway to pyruvate synthesis
using Eqn (7). Additionally, pyruvate derived through the
ED pathway is labeled at C
1
, while pyruvate originating
from glycolysis is labeled at C
3
. The fraction of pyruvate
molecules labeled at C
1
can be calculated from the difference
between pyruvate
(1)3)
and pyruvate
(2)3)
. This information is
used to verify that the label is indeed introduced through the
ED pathway and not through a gluconeogenic reaction.
Finally, PEP
(1)2)
originating from OAA
(1)2)
via the PEP
carboxykinase was quantified using Eqn (7) assuming that
the remaining fraction is identical to serine
(1)2)
.
Error consideration
The experimental measurement error was determined by
comparing the MDV
a
of amino acids with identical carbon
skeletons, and the standard deviation of these redundant
data was used for calculation of the covariance matrix C
m
of the measured individual mass intensities. Standard devi-
ations of the calculated flux ratios were determined applying
the law of error propagation C
r
¼ J*C
m
*J
T
where J is the
jacobian matrix and C
r
the covariance matrix of the output
variables. J was obtained numerically for MDV
M
after the
least-squares fitting step and calculated analytically for the
final flux ratios.
Results
Sensitivity of metabolic flux ratio analysis using
different mixtures of [U-
13
C] and unlabeled glucose
For economical reasons, low fractions of expensive
13
C-labeled substrates are desirable for labeling experiments,
provided that analytical resolution and sensitivity are
maintained. To identify an optimal compromise, we grew
E. coli MG1655 batch cultures in 5 mL M9 medium with
different mixtures of [U-
13
C] and unlabeled glucose. While
fully
13
C-labeled or unlabeled biomass contained no infor-
mation on metabolic fluxes, mixtures of 20/80, 40/60, 60/40,
and 80/20 of [U-
13
C] and unlabeled glucose, respectively,
allowed to determine flux ratios that were consistent within
the experimental error (data not shown). Although the
lowest experimental error is achieved at around equimolar
fractions of [U-
13
C] and unlabeled glucose, the 20%
[U-
13
C]glucose mixture enabled very reliable determination
of intracellular flux ratios and was thus used in the further
experiments.
Metabolic flux ratio analysis of
E. coli
under different
environmental conditions
While exponentially growing cells are initially in a physio-
logical pseudo steady state, metabolic switches occur upon
oxygen limitation or accumulation of metabolic byproducts.
To identify reproducible conditions that faithfully reflect the
physiological state of unlimited, exponentially growing cells,
Ó FEBS 2003 Metabolic flux profiling in E. coli (Eur. J. Biochem. 270) 885
biomass aliquots were harvested at different time points
from wild-type batch cultures in shake flasks growing on
100% [1-
13
C]glucose or on a 20%/80% mixture of [U-
13
C]
and unlabeled glucose. Overall, the determined origin of
metabolite pools did not change significantly with the time
of harvest (data partly shown in Fig. 3). The sole exceptions
were increasing fractions of serine derived through glyco-
lysis and OAA derived through the TCA cycle upon
approaching stationary phase (Fig. 3), as was observed
earlier [7]. Hence, all further analyses were performed with
biomass aliquots harvested at D
600
values between 0.8 and
1.5.
Next, we investigated the metabolic impact of different
levels of aeration from fully aerobic (500 mL baffled shake
flask) to suboptimally aerated (15 mL vials) and anaerobic
E. coli batch cultures (Fig. 4). With decreasing oxygen
availability, most prominently, the fraction of OAA origin-
ating through the TCA cycle decreases from 44% to 5%.
This reveals a branched, noncyclic operation of the TCA
cycle to fulfill exclusively biosynthetic requirements, as was
also shown earlier [7,16,26]. Although the oxidative PP
pathway is still active under anaerobic conditions (serine
through glycolysis), its relative contribution to glucose
catabolism is decreased from 19% to 5% (Fig. 4), which
concurs with most [7,16] but not all [26] reports. The
frequently reported upper bound on in vivo PP pathway
activity obtained from [U-
13
C]glucose experiments, in
contrast (PEP from P5P), is not sensitive to this decrease.
Unexpectedly, suboptimally aerated conditions promote
relatively high in vivo malic enzyme activity (pyruvate from
malate). Likewise, the of CO
2
originating from air in the
[U-
13
C]glucose experiments decreased with decreasing oxy-
gen availability from 20% to 0%. Thus, introduction of
unlabeled CO
2
via carboxylation reactions can be neglected
in vials or anaerobic cultures, but is significant in the better
aerated shake flask cultures. To ensure fully aerobic
conditions, all further experiments were conducted in shake
flasks.
Metabolic flux ratio analysis of
E. coli
mutants
of central metabolism
The above developed metabolic flux ratio analysis by
GC-MS was used for metabolic flux profiling of nonlethal
mutations in all major pathways of E. coli central meta-
bolism (Fig. 1). For this purpose, aerobic batch cultures
were grown in shake flasks with M9 medium containing
either [1-
13
C]glucose or a 20/80 mixture of [U-
13
C] and
unlabeled glucose, which were identified above as reliable
experimental conditions. Based on the physiological data
obtained from three different wild-type strains, maximum
specific growth rates of 0.5–0.7Æh
)1
, biomass yields of
0.4–0.5 g(CDW)Æg(glucose)
)1
, and specific glucose uptake
rates of 6.5–8.5 mmolÆg(CDW)
)1
Æh
)1
may be considered as
normal for E. coli (Table 3). Hence, only the Pgi, PfkA,
and Mae/Pck mutants exhibited clear physiological
phenotypes with significantly reduced growth and glucose
uptake rates.
While the flux profiles were similar in the three wild-type
strains with small differences in the fractions of serine
originating from glycine and OAA originating through the
TCA cycle (Fig. 5), major changes were seen in the mutants
(Fig. 6). Consistent with its severely reduced growth rate,
the phosphoglucose isomerase-deficient Pgi mutant exhi-
bited a very different flux profile without any glycolytic flux
(serine through glycolysis in Fig. 6). Unexpectedly, the ED
pathway was found to contribute about 30% to glucose
catabolism in the Pgi mutant (pyruvate through ED
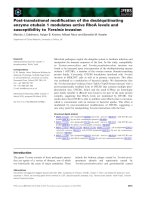
Fig. 4. Origin of metabolic intermediates in E. co li wild-type during
aerobic (white bars), suboptimally aerated (gray bars), and anaerobic
(black bars) growth. The experimental error was estimated from
redundant mass distributions. Asterisks indicate results obtained from
100% [1-
13
C] glucose experiments. All other results were from 20%
[U-
13
C] and 80% unlabeled glucose experiments. The fractions of
pyruvate originating from malate and PEP originating from OAA
could not be determined under anaerobic conditions because the OAA
pool is derived exclusively from PEP.
Fig. 3. Influence of harvest time on METAFoR analysis of E. coli
MG1655 in aerobic shake flask batch cultures. The line indicates the
exponential fit with a growth rate of 0.6 h
)1
to the D
600
readings
(closed circles). Fractions of OAA through the TCA cycle (open cir-
cles), serine from glycine (open triangles), and pyruvate from malate
(ub) (open squares) were obtained from 20% [U-
13
C] and 80%
unlabeled glucose experiments. Serine through glycolysis (open dia-
monds) was obtained from 100% [1-
13
C]glucose experiments. Error
bars indicate standard deviations of triplicate experiments.
886 E. Fischer and U. Sauer (Eur. J. Biochem. 270) Ó FEBS 2003
pathway), so that the remaining 70% are contributed by the
PP pathway, which is consistent with the upper bound of
80% PEP from P5P (Fig. 6).
The PfkA mutant is deficient in the allosterically regula-
ted, major isoform of phosphofructokinase that constitutes
about 90% of the total phosphofructokinase activity [27,28].
As phosphofructokinase is required for glucose catabolism
via both glycolysis and PP pathway, the very low specific
glucose uptake rate of the PfkA mutant and, as a
consequence, the low growth rate on glucose are expected
(Table 3). Consistently, the major fraction of serine is still
generated through glycolysis (Fig. 6), probably catalyzed by
the intact minor isoform phosphofructokinase B. However,
the flux partitioning into the PP pathway (PEP from P5P) is
significantly increased.
Flux profiles of the Zwf and PykAF mutants defective in
G6P dehydrogenase and both pyruvate kinase isoforms,
respectively, were somewhat similar to that of the wild-type.
Significant flux changes in the Zwf mutant were seen in the
reactions related to the PP pathway (data partly shown in
Fig. 6). A 93% fraction of serine originating through
glycolysis indicates residual PP pathway and/or ED path-
way fluxes for glucose catabolism in the range of 7%.
Consistent with the previously described metabolic bypass
of pyruvate kinase knockout via PEP carboxylase and malic
enzyme [7,18], the PykAF mutant exhibited lower fractions
of OAA originating through the TCA cycle and higher
fractions of pyruvate originating from malate (Fig. 6).
During the growth on glucose investigated here, simul-
taneous inactivation of the two gluconeogenic reactions
catalyzed by malic enzyme and PEP carboxykinase had no
significant effect on the flux profile of the Mae/Pck mutant
(Fig. 6). This result was expected, as the fractions of
pyruvate originating from malate and PEP originating from
OAA that are indicative of in vivo malic enzyme and PEP
carboxykinase activity, respectively, were already at detec-
tion level in the wild-type strains (Fig. 5). Disruption of the
TCA cycle in the Sdh/Mdh and FumA mutants [29,30]
reduced primarily the fraction of OAA generated through
the TCA cycle (Fig. 6). This fraction is zero in the double
knockout mutant in malate dehydrogenase and succinate
dehydrogenase, which reveals complete inactivation of the
Table 3. Aerobic growth parameters of exponentially growing E. c oli
strains in [1-
13
C] and [U-
13
C]glucose (in parentheses) experiments.
Strain
Growth
rate (h
)1
)
Biomass
yield (gÆg
)1
)
Glucose uptake
rate (mmolÆg
)1
Æh
)1
)
Wild-types
MG1655 0.61 (0.60) 0.39 (0.39) 8.5 (8.6)
W3110 0.55 (0.53) 0.41 (0.43) 7.3 (6.8)
JM101 0.69 (0.68) 0.49 (0.49) 7.7 (7.7)
Mutants
Zwf 0.68 (0.65) 0.53 (0.52) 8.8 (8.8)
Pgi 0.17 (0.15) 0.39 (0.40) 2.5 (2.0)
PfkA 0.08 (0.08) 0.41 (0.41) 1.4 (1.5)
PykAF 0.60 (0.59) 0.41 (n.d) 8.1 (n.d)
Mae/Pck 0.41 (0.44) 0.40 (0.42) 5.7 (5.8)
SdhA/Mdh 0.50 (0.51) 0.43 (0.40) 6.5 (7.1)
FumA 0.67 (0.65) 0.46 (0.45) 8.2 (8.3)
Fig. 5. Origin of metabolic intermediates in the E. c oli wild-type strains
MG1655 (white), JM101 (gray), and W3110 (black) during aerobic
exponential growth. The experimental error was estimated from
redundant mass distributions. Asterisks indicate results obtained from
100% [1-
13
C]glucose experiments. All other results were from 20%
[U-
13
C] and 80% unlabeled glucose experiments.
Fig. 6. Origin of metabolic intermediates in
E. c oli mutants during aerobic exponential
growth. The experimental error was estimated
from redundant mass distributions. Asterisks
indicate results obtained from [1-
13
C]glucose
experiments. All other results were from 20%
[U-
13
C] and 80% unlabeled glucose experi-
ments.
Ó FEBS 2003 Metabolic flux profiling in E. coli (Eur. J. Biochem. 270) 887
TCA cycle and exclusive origin of OAA through the
anaplerotic PEP carboxylase. Although knockout of the
major fumarase isoform in the FumA mutant strongly
reduced TCA cycle fluxes, a residual TCA cycle contribu-
tion to OAA synthesis of about 16% remains.
Discussion
We introduce here metabolic flux ratio analysis by GC-MS
as a novel methodology for flux profiling from
13
C-labeling
experiments. This methodology is based on probabilistic
equations that relate mass distributions in amino acids to
metabolic activities, and quantifies the relative contribution
of converging pathways or reactions to metabolic interme-
diates. While MS data were used previously to analytically
deduce individual flux ratios, for example at the G6P node
[13,19,31] and in gluconeogenesis [32], the generalized
methodology presented here simultaneously quantifies 14
flux ratios in central metabolism during growth on glucose.
The thus obtained metabolic flux profile provides compre-
hensive information on in vivo activities of all major
pathways in central carbon metabolism, hence concomi-
tantly identifies the network topology. Although similar in
scope to previously described metabolic flux ratio analysis
by NMR [16,17], GC-MS-based analysis provides a signi-
ficant advance in handling and sensitivity, so that biomass
samples as low as 1 mg cellular dry weight may be analyzed.
Without the need for time-consuming quantitative physio-
logical analysis, this methodology thus paves the road to
rapid diagnosis of metabolic changes in culture volumes
below 1 mL.
Using metabolic flux ratio analysis by GC-MS, we dissect
here flux responses of E. coli central metabolism to
environmental and genetic modifications for two reasons:
to (a) experimentally verify the accuracy of the new
methodology and to (b) identify novel metabolic response.
Estimation of in vivo PP pathway activity has received
considerable attention, due to its variability with environ-
mental conditions and relevance for NADPH metabolism.
For aerobic batch cultures of E. coli, the relative contribu-
tion of the PP pathway to glucose catabolism has long been
a matter of debate, yielding values between less than 10%
to about 50% of glucose consumption [26,33]. For three
different E. coli wild-type strains, we show here that the PP
pathway contribution to fully aerobic glucose catabolism
varies between 14% and 20% (Figs 5 and 7 A and 7B). This
contribution does not change significantly upon mutations
downstream of triose 3-phosphate. When forced to serve as
the primary route for glucose catabolism in the phospho-
glucose isomerase knockout (Fig. 7A), the PP pathway
supports only a significantly lower growth rate than that
observed for the wild-type. The strong reduction of PP and
ED pathway fluxes upon knockout of G6P dehydrogenase
(Fig. 7B) reveals the nonessential nature of both pathways
for growth on glucose, as the growth physiology of the Zwf
mutant was indistinguishable from that of the wild-type.
Noticeably, a fraction of about 7% of the serine molecules
does not originate from glycolysis in the Zwf mutant. The
13
C labeling pattern of serine is instead consistent with a low
but significant flux through either the PP or ED pathway. A
similar observation was made with other, independently
generated G6P dehydrogenase mutants (data not shown).
Such a bypass of the inactivated G6P dehydrogenase may
be catalyzed for example by the periplasmic glucose
dehydrogenase, which produces glucono-d-lactone that
can be further converted to gluconate [24].
Consistent with the reported gluconate induction [21],
in vivo activity of the ED pathway was low but not
completely absent in wild-type E. coli during aerobic growth
on glucose (Figs 4,5, and 7C). In knockout mutants of
glycolysis and TCA cycle, however, the ED pathway
catalyzes up to 30% of glucose catabolism (Figs 6 and
7C). This is surprising because the inducer of this pathway is
not present and, at least for the example of the Pgi mutant,
in vitro ED pathway enzyme activities are not significantly
higher [34]. In the Pgi mutant, this flux rerouting through
the ED pathway reduces concomitant excess NADPH
formation from exclusive glucose catabolism via the PP
pathway, which generates two NADPH compared to one in
the ED pathway per catabolized glucose. This overproduc-
tion of NADPH is deleterious, as limited capacity for
reoxidation of NADPH is one reason for the low growth
rate of phosphoglucose isomerase-deficient E. coli [34].
However, exclusive glucose catabolism via the ED pathway
does not support growth of E. coli, as double mutants in
both isoforms of phosphofructokinase cannot grow on
glucose as the sole carbon source [27].
As may be expected from the known genetic regulation,
low or absent in vivo activity of the gluconeogenic reactions
catalyzed by PEP carboxykinase and malic enzyme was seen
in our batch cultures. Consistent with previous flux analyses
based on NMR data [7,18], the sole exception was the
PykAF mutant, which bypassed the pyruvate kinase
reaction by redirecting carbon flow via PEP carboxylase
and malic enzyme (Fig. 6).
A very important flux ratio characterizing the metabolic
state of a culture is the fraction of OAA originating through
the TCA cycle, which quantifies the proportion to which the
TCA cycle is used for energy generation vs. biosynthetic
precursor supply via the anaplerotic PEP carboxylase
(Fig. 7D). Consequently, this ratio is influenced by envi-
ronmental factors such as growth phase (Fig. 3), aeration
(Fig. 4), and overflow metabolism, but to some extent
also by the genetic background of the wild-type strains
(Fig. 5), as was noted previously for different organisms
[7,16,26,35,36]. Generally, anaplerosis is high under condi-
tions that invoke overflow metabolism, as acetate formation
reduces the fraction of intact two carbon units entering the
TCA cycle. Metabolic flux ratio analysis by GC-MS
successfully captures the effective disruption of the TCA
cycle in the Sdh/Mdh mutant (Figs 6 and 7D). Although the
major fumarase isoform is inactivated in the FumA mutant,
its respiratory TCA cycle flux is still at about one third of
that in the wild-type (Fig. 6). This reveals that the two
remaining fumarase isoforms are also important during
growth on glucose.
Despite the different genetic backgrounds of the
mutants in the upper part of central metabolism and
their variations in growth rate, however, we observed
surprisingly small deviations in this fraction of OAA
originating through the TCA cycle. Thus, all mutants that
were not related to the TCA cycle maintained a similar
balance between anaplerosis and energy generation during
exponential growth.
888 E. Fischer and U. Sauer (Eur. J. Biochem. 270) Ó FEBS 2003
Most prominently among the presented data, this last
result provides experimental evidence for metabolic network
resilience to disruption [37–40]. While this was partly
predicted for E. coli from computational network analysis
[41] and is obvious from the fact that the investigated
mutants grow in minimal medium, the flux results presented
here reveal how metabolism manages intracellular flux
redistribution upon disruption of all major pathways. These
results are particularly valuable for the verification/falsifi-
cation of hypotheses generated from in silico analyses such
as flux balancing [42] or elementary flux mode analyses [43],
and will ultimately contribute to a quantitative understand-
ing of metabolic networks.
References
1. Weckwerth, W. & Fiehn, O. (2002) Can we discover novel path-
ways using metabolomic analysis? Curr. Opin. Biotechnol. 13,156–
160.
2. Wiechert, W. (2001)
13
C metabolic flux analysis. Metab. Eng. 3,
195–206.
3. Szyperski, T. (1998)
13
C-NMR, MS and metabolic flux balancing
in biotechnology research. Q. Rev. Biophys. 31, 41–106.
4. Christensen, B. & Nielsen, J. (1999) Metabolic network analysis.
Adv. Biochem. Eng. Biotechnol. 66, 209–231.
5. Varma, A. & Palsson, B.O. (1994) Metabolic flux balancing:
basic concepts, scientific, and practical use. Bio/Technol. 12, 994–
998.
6. Oliver, S.G., Winson, M.K., Kell, D.B. & Baganz, F. (1998)
Systematic functional analysis of the yeast genome. Trends Bio-
technol. 16, 373–378.
7. Sauer, U., Lasko, D.R., Fiaux, J., Hochuli, M., Glaser, R.,
Szyperski, T., Wu
¨
thrich, K. & Bailey, J.E. (1999) Metabolic flux
ratio analysis of genetic and environmental modulations of
Escherichia coli central carbon metabolism. J. Bacteriol. 181,
6679–6688.
8. Wittmann, C. (2002) Metabolic flux analysis using mass spectro-
metry. Adv. Biochem. Eng. Biotechnol. 74, 39–64.
Fig. 7. Ratios of metabolic fluxes (solid arrows) to the synthesis of boxed metabolites in E. coli MG1655 (top values), the Pgi mutant (second values),
the Zwf mutant (third values), and the Sdh/Mdh double mutant (bottom values). The values are based on the data shown in Fig. 6. (A) Relative
contributions of catabolic pathways and PEP carboxykinase to PEP formation from [U-
13
C]glucose experiments. (B) Relative contribution of the
catabolic pathways to the formation of the serine pool from [1-
13
C]glucose experiments. (C) Relative contribution of the catabolic pathways and
malic enzyme to the formation of the pyruvate pool from [1-
13
C] and [U-
13
C]glucose experiments. (D) Relative contributions of anaplerosis and the
TCA-cycle to the formation of the OAA pool from [U-
13
C]glucose experiments. Dashed arrows symbolize reactions that are not considered for a
given flux ratio.
Ó FEBS 2003 Metabolic flux profiling in E. coli (Eur. J. Biochem. 270) 889
9. Dauner, M., Bailey, J.E. & Sauer, U. (2001) Metabolic flux ana-
lysis with a comprehensive isotopomer model in Bacillus subtilis.
Biotechnol. Bioeng. 76, 144–156.
10. Petersen, S., de Graaf, A.A., Eggeling, L., Mo
¨
llney, M., Wiechert,
W. & Sahm, H. (2000) In vivo quantification of parallel and
bidirectional fluxes in the anaplerosis of Corynebacterium gluta-
micum. J. Biol. Chem. 275, 35932–35941.
11. Kelleher, J.K. (2001) Flux estimation using isotopic tracers:
common ground for metabolic physiology and metabolic engine-
ering. Metab. Eng. 3, 100–110.
12. Bacher,A.,Rieder,C.,Eichinger,D.,Arigoni,D.,Fuchs,G.&
Eisenreich, W. (1999) Elucidation of novel biosynthetic pathways
and metabolic flux patterns by retrobiosynthetic NMR analysis.
FEMS Microbiol. Rev. 22, 567–598.
13. Wittmann, C. & Heinzle, E. (2001) Application of MALDI-TOF
MS to lysine-producing Corynebacterium glutamicum:anovel
approach for metabolic flux analysis. Eur. J. Biochem. 268, 2441–
2455.
14. Sauer, U., Hatzimanikatis, V., Bailey, J.E., Hochuli, M., Szyper-
ski, T. & Wu
¨
thrich, K. (1997) Metabolic fluxes in riboflavin-pro-
ducing Bacillus subtilis. Nat. Biotechnol. 15, 448–452.
15. Walsh, K. & Koshland, D.E. Jr (1984) Determination of flux
through the branch point of two metabolic cycles. The tricar-
boxylic acid cycle and the glyoxylate shunt. J. Biol. Chem. 259,
9646–9654.
16. Szyperski, T. (1995) Biosynthetically directed fractional
13
C-label-
ing of proteinogenic amino acids. An efficient analytical tool to
investigate intermediary metabolism. Eur. J. Biochem. 232, 433–
448.
17. Szyperski, T., Glaser, R.W., Hochuli, M., Fiaux, J., Sauer, U.,
Bailey, J.E. & Wu
¨
thrich, K. (1999) Bioreaction network topology
and metabolic flux ratio analysis by biosynthetic fractional
13
C
labeling and two-dimensional NMR spectroscopy. Metab. Eng. 1,
189–197.
18. Emmerling, M., Dauner, M., Ponti, A., Fiaux, J., Hochuli, M.,
Szyperski, T., Wu
¨
thrich, K., Bailey, J.E. & Sauer, U. (2002)
Metabolic flux responses to pyruvate kinase knockout in
Escherichia coli. J. Bacteriol. 184, 152–164.
19. Christensen,B.,Christiansen,T.,Gombert,A.K.,Thykaer,J.&
Nielsen, J. (2001) Simple and robust method for estimation of
the split between the oxidative pentose phosphate pathway and
the Embden-Meyerhof-Parnas pathway in microorganisms.
Biotechnol. Bioeng. 74, 517–523.
20. Dauner, M. & Sauer, U. (2000) GC-MS analysis of amino acids
rapidly provides rich information for isotopomer balancing. Bio-
technol. Prog. 16, 642–649.
21. Peekhaus, N. & Conway, T. (1998) What’s for dinner?: Entner–
Doudoroff metabolism in Escherichia coli. J. Bacteriol. 180, 3495–
3502.
22. Fraser, J. & Newman, E.B. (1975) Derivation of glycine from
threonine in Escherichia coli K-12 mutants. J. Bacteriol. 122, 810–
817.
23. van Winden, W.A., Wittmann, C., Heinzle, E. & Heijnen, J.J.
(2002) Correcting mass isotopomer distributions for naturally
occurring isotopes. Biotechnol. Bioeng. 80, 477–479.
24. Fraenkel, D.G. (1996) Glycolysis. In Escherichia Coli and Sal-
monella: Cellular and Molecular Biology (Neidhardt, F.C., Curtiss,
R. III, Ingraham, J.L., Lin, E.C.C., Low, K.B., Magasanik, B.,
Reznikoff, W.S., Riley, M., Schaechter, M. & Umbarger, H.E.,
eds), pp. 189–198. American Society For Microbiology, Wash-
ington DC.
25. Liu, J.Q., Dairi, T., Itoh, N., Kataoka, M., Shimizu, S. &
Yamada, H. (1998) Gene cloning, biochemical characterization
and physiological role of a thermostable low-specificity 1-threo-
nine aldolase from Escherichia coli. Eur. J. Biochem. 255, 220–226.
26. Schmidt, K., Nielsen, J. & Villadsen, J. (1999) Quantitative ana-
lysis of metabolic fluxes in Escherichia coli, using two-dimensional
NMR spectroscopy and complete isotopomer models. J. Bio-
technol. 71, 175–189.
27. Fraenkel, D.G. (1986) Mutants in glucose metabolism. Annu. Rev.
Biochem. 55, 317–337.
28. Morrissey, A.T. & Fraenkel, D.G. (1972) Suppressor of phos-
phofructokinase mutations of Escherichia coli. J. Bacteriol. 112,
183–187.
29. LeMaster, D. & Kushlan, D. (1996) Dynamical mapping of E. coli
thioredoxin via
13
C NMR relaxation analysis. J.Am.Chem.Soc.
118, 9255–9264.
30. Guest, J.R. & Roberts, R.E. (1983) Cloning, mapping, and
expression of the fumarase gene of Escherichia coli K-12. J. Bac-
teriol. 153, 588–596.
31. Model, P. & Rittenberg, D. (1967) Measurement of the activity of
the hexose monophosphate pathway of glucose metabolism with
the use of [
18
O]glucose. Variations in its activity in Escherichia coli
with growth conditions. Biochemistry 6, 69–80.
32. Neese, R.A., Schwarz, J.M., Faix, D., Turner, S., Letscher, A., Vu,
D. & Hellerstein, M.K. (1995) Gluconeogenesis and intrahepatic
triose phosphate flux in response to fasting or substrate loads.
Application of the mass isotopomer distribution analysis techni-
que with testing of assumptions and potential problems. J. Biol.
Chem. 270, 14452–14466.
33. Katz, J. & Rognstad, R. (1967) The labeling of pentose phosphate
from glucose-
14
C and estimation of the rates of transaldolase,
transketolase, the contribution of the pentose cycle, and ribose
phosphate synthesis. Biochemistry 6, 2227–2247.
34. Canonaco, F., Hess, T.A., Heri, S., Wang, T., Szyperski, T. &
Sauer, U. (2001) Metabolic flux response to phosphoglucose iso-
merase knock-out in Escherichia coli and impact of overexpression
of the soluble transhydrogenase UdhA. FEMS Microbiol. Lett.
204, 247–252.
35. Dauner, M., Storni, T. & Sauer, U. (2001) Bacillus subtilis meta-
bolism and energetics in carbon-limited and excess-carbon
chemostat culture. J. Bacteriol. 183, 7308–7317.
36. Wendisch, V.F., de Graaf, A.A., Sahm, H. & Eikmanns, B.J.
(2000) Quantitative determination of metabolic fluxes during
coutilization of two carbon sources: comparative analyses with
Corynebacterium glutamicum during growth on acetate and/or
glucose. J. Bacteriol. 182, 3088–3096.
37. Bailey, J.E. (1999) Lessons from metabolic engineering for func-
tional genomics and drug discovery. Nat. Biotechnol. 17, 616–618.
38. Jeong, H., Tombor, B., Albert, R., Oltvai, Z.N. & Barabasi, A.L.
(2000) The large-scale organization of metabolic networks. Nature
407, 651–654.
39. Hartwell, L. (1997) Theoretical biology. A robust view of bio-
chemical pathways. Nature 387, 855–857.
40. Edwards, J.S. & Palsson, B.O. (2000) Robustness analysis of the
Escherichia coli metabolic network. Biotechnol. Prog. 16, 927–939.
41. Edwards, J.S. & Palsson, B.O. (2000) The Escherichia coli
MG1655 in silico metabolic genotype: its definition, character-
istics, and capabilities. Proc. Natl Acad. Sci. USA 97, 5528–5533.
42. Covert, M.W., Schilling, C.H., Famili, I., Edwards, J.S., Gorya-
nin, I.I., Selkov, E. & Palsson, B.O. (2001) Metabolic modeling of
microbial strains in silico. Trends Biochem. Sci. 26, 179–186.
43. Stelling, J., Klamt, S., Bettenbrock, K., Schuster, S. & Gilles, E.D.
(2002) Metabolic network structure determines key aspects of
functionality and regulation. Nature 420, 190–193.
44. Bachmann, B.J. (1996) Derivations and genotypes of some mutant
derivatives of Escherichia coli K-12. In Escherichia coli and
Salmonella: Cellular and Molecular Biology (Neidhardt, F.C.,
Curtiss, R. III, Ingraham, J.L., Lin, E.C.C., Low, K.B.,
Magasanik, B., Reznikoff, W.S., Riley, M., Schaechter, M. &
890 E. Fischer and U. Sauer (Eur. J. Biochem. 270) Ó FEBS 2003
Umbarger, H.E., eds), pp. 2460–2488. American Society For
Microbiology, Washington DC.
45. Yanisch-Perron, C., Vieira, J. & Messing, J. (1985) Improved M13
phage cloning vectors and host strains: nucleotide sequences of the
M13mp18 and pUC19 vectors. Gene 33, 103–119.
46. Fraenkel, D.G. (1968) Selection of Escherichia coli mutants lack-
ing glucose 6-phosphate dehydrogenase or gluconate 6-phosphate
dehydrogenase. J. Bacteriol. 95, 1267–1271.
47. Bo
¨
hringer, J., Fischer, D., Mosler, G. & Hengge-Aronis, R. (1995)
UDP-glucose is a potential intracellular signal molecule in the
control of expression of sigma S and sigma S-dependent genes in
Escherichia coli. J. Bacteriol. 177, 413–422.
48. Morrissey, A.T. & Fraenkel, D.G. (1968) Selection of fructose
6-phosphate kinase mutants in Escherichia coli. Biochem. Biophys.
Res. Commun. 32, 467–473.
49. Ponce, E., Flores, N., Martinez, A., Valle, F. & Bolivar, F. (1995)
Cloning of the two pyruvate kinase isoenzyme structural genes
from Escherichia coli: the relative roles of these enzymes in pyru-
vate biosynthesis. J. Bacteriol. 177, 5719–5722.
50. Hansen, E.J. & Juni, E. (1975) Isolation of mutants of Escherichia
coli lacking NAD- and NADP-linked malic enzymes. Biochem.
Biophys. Res. Commun. 65, 559–566.
Supplementary material
The following material is available from ck
wellpublishing.com/products/journals/suppmat/EJB/EJB3448/
EJB3448sm.htm
Table S1. Mass distributions of metabolite fragments in
E. coli mutants grown on [1-
13
C]glucose.
Table S2. Mass distributions of metabolite fragments in
E. coli mutants grown on 20% [U-
13
C] and 80% unlabeled
glucose.
Ó FEBS 2003 Metabolic flux profiling in E. coli (Eur. J. Biochem. 270) 891