Tài liệu Báo cáo khoa học: Phenol hydroxylase from Acinetobacter radioresistens S13 Isolation and characterization of the regulatory component docx
Bạn đang xem bản rút gọn của tài liệu. Xem và tải ngay bản đầy đủ của tài liệu tại đây (269.36 KB, 7 trang )
Phenol hydroxylase from
Acinetobacter radioresistens
S13
Isolation and characterization of the regulatory component
Ersilia Griva
1
, Enrica Pessione
1
, Sara Divari
1
, Francesca Valetti
1
, Maria Cavaletto
2
, Gian Luigi Rossi
3
and Carlo Giunta
1
1
Dipartimento di Biologia Animale e dell’Uomo, Universita
`
di Torino, Italy;
2
Dipartimento di Scienze e Tecnologie Avanzate,
Universita
`
del Piemonte Orientale, Alessandria, Italy;
3
Dipartimento di Biochimica e Biologia Molecolare,
Universita
`
di Parma, Italy
This paper reports the isolation and characterization of
the regulatory moiety of the multicomponent enzyme
phenol hydroxylase from Acinetobacter radioresistens S13
grown on phenol as the only carbon and energy source.
The whole enzyme comprises an oxygenase moiety
(PHO), a reductase moiety (PHR) and a regulatory
moiety (PHI). PHR contains one FAD and one iron-
sulfur cluster, whose function is electron transfer from
NADH to the dinuclear iron centre of the oxygenase. PHI
is required for catalysis of the conversion of phenol to
catechol in vitro, but is not required for PHR activity
towards alternative electron acceptors such as cyto-
chrome c and Nitro Blue Tetrazolium. The molecular
mass of PHI was determined to be 10 kDa by SDS/
PAGE, 8.8 kDa by MALDI-TOF spectrometry and
18 kDa by gel-permeation. This finding suggests that the
protein in its native state is a homodimer. The isoelectric
point is 4.1. PHI does not contain any redox cofactor
and does not bind ANS, a fluorescent probe for hydro-
phobic sites. The N-terminal sequence is similar to those
of the regulatory proteins of phenol hydroxylase from
A. calcoaceticus and Pseudomonas CF 600.
In the reconstituted system, optimal reaction rate was
achieved when the stoichiometry of the components was 2
PHR monomers: 1 PHI dimer: 1 PHO (abc)dimer.PHI
interacts specifically with PHR, promoting the enhancement
of FAD fluorescence emission. This signal is diagnostic of a
conformational change of PHR that might result in a better
alignment with respect to PHO.
Keywords: regulatory proteins; multicomponent mono-
oxygenase; phenol hydroxylase.
Acinetobacter radioresistens S13 is able to grow on phenol
as the sole carbon and energy source via the ortho-pathway
(b-ketoadipate pathway). The first enzyme involved in
phenol degradation is phenol hydroxylase (PH), a mono-
oxygenase utilizing NADH as electron donor.
In previous studies we have found that the enzyme is
composed of three moieties which are readily separated by
chromatographic steps: the oxygenase (PHO), composed of
two heterotrimers (abc) (S. Divari, F. Valetti, P. Caposio, E.
Pessione, M. Calvaletto, E. Griva, G. Gribaudo, G. Gilardi
& C. Giunta, unpublished observation), the reductase
(PHR) [1] and a third protein (PHI) that is described in
this work.
A similar molecular composition has been found in
phenol hydroxylases from Pseudomonas CF 600 [2] and
A. calcoaceticus NCIB 8250 [3] and in toluene-2-mono-
oxygenase from Burkholderia cepacia [4], as well as in the
soluble methane monooxygenases (MMOs) from Methylo-
coccus capsulatus [5], Methylosinus trichosporium [6], Meth-
ylocystis sp.M [7] and in alkene monooxygenase from
Nocardia corallina [8].
In phenol hydroxylase of A. radioresistens S13, the third
component is needed for the overall enzyme activity; in
phenol hydroxylase from Pseudomonas CF 600, it promotes
substrate–oxygenase interaction [9]; in MMOs it alters the
local environment and the redox potential of the catalytic
centre [6,10–12].
Interestingly, in other aromatic monooxygenases (i.e.
toluene-4-monooxygenase from Pseudomonas mendocina
[13], toluene/o-xylene monooxygenase from Pseudomonas
stutzeri [14] and alkene monooxygenase from Xantobacter
Py2 [15]), two proteins, rather than one, are present besides
the oxygenase and the reductase moieties. In this case one has
a regulatory function, the other is a Rieske-type ferredoxin.
The question was asked whether, in A. radioresistens
S13, PHI promotes the overall catalytic activity of the
Correspondence to C. Giunta, Via Accademia Albertina,
13, 10123 Torino, Italy. Fax: + 39 0116704692,
E-mail:
Abbreviations: ANS, 8-anilinonaphtalene-1-sulfonic acid ammonium
salt; CV, circular voltammetry; DPV, differential pulse voltammetry;
MCD, magnetic circular dicroism; MMO, methane monooxygenase;
MMOB, methane monooxygenase regulatory component; MMOH,
methane monooxygenase hydroxylase; MMOR, methane mono-
oxygenase reductase component; NBT, nitro blue tetrazolium;
PH, phenol hydroxylase; PHI, phenol hydroxylase regulatory protein;
PHR, phenol hydroxylase reductase; PHO, phenol hydroxylase
oxygenase; T2M, toluene-2-monooxygenase.
Enzymes: Phenol hydroxylase (EC 1.14.13.7); benzoate dioxygenase
(EC 1.14.12.10); toluene 4-monooxygenase (EC 1.14.14.1); toluene
2-monooxygenase (EC 1.14.13 ); alkene monooxygenase
(EC 1.14.13 ); xylene monooxygenase (EC 1.14.14.1); phthalate
dioxygenase (EC 1.14.12.7); p-hydroxybenzoate hydroxylase
(EC 1.14.13.2); toluene dioxygenase (EC 1.14.12.11); methane
monooxygenase (EC 1.14.13.25).
(Received 18 December 2002, accepted 6 February 2003)
Eur. J. Biochem. 270, 1434–1440 (2003) Ó FEBS 2003 doi:10.1046/j.1432-1033.2003.03505.x
enzyme by: (a) PHI–phenol interaction, possibly facilita-
ting substrate-binding to the active site of PHO; (b) PHI–
PHR interaction, possibly resulting in an altered confor-
mation of PHR more suitable for electron transfer to
PHO; (c) PHI–PHO interaction, possibly causing a
conformational change leading to the opening of the
PHO active site.
Materials and methods
Bacterial strain
The A. radioresistens S13 strain used in this work was
isolated as previously described [16,17]. This bacterium
bears several natural plasmids and is able to grow on either
phenol or benzoate as the only carbon source.
Culture conditions
The culture media used were Luria-Bertani (LB) broth
(peptone 10 gÆL
)1
,NaCl10 gÆL
)1
, yeast extract 5 gÆL
)1
)and
the Sokol and Howell [18] minimal medium, where phenol
was the only carbon source. The fed-batch fermentation
procedure was used. The acclimation method was the same
as previously reported [19]. Cells were harvested when
growth reached the stationary phase and were stored frozen
()80 °C).
Preparation of crude extract
Cells were washed twice in 50 m
M
Hepes/NaOH buffer,
pH 7.0, and then resuspended (1 g biomassÆmL
)1
)in50 m
M
Hepes/NaOH buffer, pH 7.0. The biomass (about 200 g)
was sonicated (Microsonix Sonicator Ultrasonic Liquid
Processor XL2020) for a total time of 40 min at 20 kHz
with intervals of 1 minute, keeping the cells on ice, and then
centrifuged at 100 000 g for 1 h at 4 °C (ultracentrifuge
LB60M, Beckman).
The supernatant was assayed for phenol hydroxylase
activity, that resulted to be present. This supernatant will be
referred to as the enzyme crude extract. The pellet was
further processed but no membrane-bound enzyme activity
could be detected.
Enzyme activity test
Phenol hydroxylase activity was estimated polarographically
modified from [2] by means of a Clark-type electrode (YSI
Model 5300). The phenol hydroxylase reaction was moni-
tored by evaluating the oxygen consumption due to PHO
activity. The standard assay contained: 1.7 m
M
NADH,
100 lL of crude extract in 0.1
M
Mops/NaOH buffer,
pH 7.4 at 24 °C. The reaction was started by adding 1 m
M
phenol (Fluka).
Both in the crude extract and after separation from the
oxygenase, PHR activity was monitored by the reduction of
cytochrome c in the presence of NADH at 550 nm [1].
Protein determination
Protein content was determined by the Bradford test [20],
using bovine serum albumin as standard.
PHI purification
An anion exchange DE-52 cellulose column (Whatman)
(2.6 · 20 cm) was equilibrated with 50 m
M
Hepes/NaOH
buffer, pH 7.0. The crude extract was eluted with a 0–0.5
M
sodium sulfate gradient in 50 m
M
Hepes/NaOH buffer,
pH 7.0 (final volume 1.1 L). This procedure allowed us to
separate the oxygenase moiety. Fractions showing reduc-
tase activity were applied on a second anion exchange
column Source Q15 (Pharmacia) (1 · 5 cm) equilibrated
with 50 m
M
Hepes/NaOH buffer, pH 7.0 containing
0.05
M
sodium-sulfate. PHR and PHI were coeluted from
this column with a 0.05–0.5
M
sodium sulfate gradient in
50 m
M
Hepes/NaOH buffer, pH 7.0 (final volume
120 mL). After concentration by ultrafiltration (membrane
Diaflo, cut off 3 kDa, Amicon), the enzyme-containing
fractions (total volume 2 mL) were applied on a gel
permeation Superdex 75-FPLC column (2.6 cm · 60 cm)
(Pharmacia) equilibrated with 50 m
M
Hepes/NaOH buffer,
pH 7.0, containing 0.05
M
sodium sulfate to obtain separ-
ation of PHR and PHI. All steps were performed at 4 °C.
Monomers isolation by reverse-phase HPLC
PHI was resuspended in 80 lL of 50% water/50% aceto-
nitrile solution and 1% formic acid at a final concentration
of 30 l
M
. The reaction was allowed to proceed at room
temperature for 10 min modified from [21]. PHI monomers
were purified using a HPLC Merk-Hitachi L6200 with a
Diode Array L4500, equipped with a column Lichorosphere
100RP-8(Merk).Theflowratewas1mLÆmin
)1
.The
column was equilibrated with solvent A [water and 0.08%
(v/v) trifluoroacetic acid] and the monomers were eluted
using a linear gradient of 20–90% solvent B (water/
acetonitrile/trifluoroacetic acid 10 : 90 : 0.08, v/v/v) over
50 min.
Hydrophobic interaction chromatography
In order to inquire whether PHI could interact directly with
phenol, PHI was dissolved in 50 m
M
Hepes/NaOH buffer,
pH 7.0, containing 0.15
M
sodium sulfate and was loaded
on a Phenyl-Sepharose column (2.5 · 8cm)(Pharmacia)
equilibrated in the same buffer. The flow rate was
2mLÆmin
)1
.
Molecular mass determination
The molecular mass was determined by means of SDS/
PAGE, size exclusion chromatography and mass spectro-
metry.
SDS/PAGE was carried out in separating gels containing
15% acrylamide. The following proteins were used as
standards: phosphorylase B (97 kDa), bovine serum albu-
min (67 kDa), ovalbumin (45 kDa), carbonic anhydrase
(31 kDa), trypsin inhibitor (21 kDa) and lysozyme
(14 kDa). In addition, molecular mass peptide standards
(Pharmacia) were used: globin (16.9 kDa), globin I + II
(14.4 kDa), globin I + III (10.7 kDa) and globin I
(8.2 kDa). Proteins were detected by silver staining.
A Superdex 75-FPLC column (2.6 · 60 cm) (Pharma-
cia) was equilibrated with 50 m
M
Hepes/NaOH buffer,
Ó FEBS 2003 A. radioresistens S13 phenol hydroxylase regulatory component (Eur. J. Biochem. 270) 1435
pH 7.0, containing 0.05
M
sodium sulfate. The column
was calibrated with blue dextran 2000 and the following
reference proteins (Pharmacia): bovine serum albumin
(67 kDa), hen egg ovalbumin (43 kDa), chimotrypsinogen
A (25 kDa) and bovine pancreas ribonuclease A (13.7), at
4 °C. The molecular masses of the calibration proteins
were plotted semilogarithmically vs. the partition coeffi-
cient K
av
to determine the apparent molecular mass of the
sample. K
av
is defined as the ratio (V
e
) V
o
)/(V
t
) V
o
). V
e
,
V
t
, V
o
represent the elution, void and total column
volume, respectively. The same experiment was repeated
using 50 m
M
Hepes/NaOH buffer, pH 7.0, as eluent.
PHI molecular mass was confirmed by matrix-assisted
laser desorption/ionization time-of-flight (MALDI-TOF)
mass spectral analysis, using a Biflex mass spectrometer
(Bruker). The sample (3 nmol) was desalted, lyophilyzed and
resuspended in 50 lL acetonitrile/water solution (70 : 30,
v/v) and mixed with 50 lL sinapinic acid matrix. One lL
of the resulting solution ( 30 pmol of PHI) was loaded.
Isoelectric focusing
The isoelectric point was determined by analytical IEF
electrophoresis (Phast System, Pharmacia); the markers
were those supplied by Pharmacia (pI calibration kit).
NH
2
-terminal sequence
After SDS/PAGE, the protein band was blotted onto
Immobilon P (Millipore) membrane. The N-terminus was
sequenced using the Applied Biosystems 470A automatic
microsequencer, following the Edman degradation [22].
Optical spectroscopy
The UV/Vis absorption spectrum of purified protein in
50 m
M
Hepes/NaOH buffer, pH 7.0, was determined from
200 to 700 nm using a DU-70 Spectrophotometer (Beck-
man), at 20 °C. Fluorescence emission spectra of protein in
the same buffer were collected at 20 °C, by means of a
Luminescence Spectrometer LS 50 B-Perkin Elmer; using a
3-mL quartz cuvette (path length 10 mm).
CD measurements were performed by a Jasco Spectro-
polarimeter J-715 equipped with temperature-controlled
Peltier Jasco PTC-348WI, using a 0.1-cm quartz cuvette. All
spectra were recorded under nitrogen flow and the baseline
was corrected by calibration with the dialysis buffer. The
PHI concentration was 10 l
M
. Actual protein concentra-
tions were verified by A
280
measurements made on CD
samples. Spectra were recorded from 260 to 190 nm at a
speed of 50 nmÆmin
)1
, band-width of 1.0 nm, and a
resolution of 0.1 nm in the temperature range between
10 °Cand70°C, after preincubation for 10 min at each
temperature. Three runs were accumulated and averaged.
CD measurements were reported as mean residue ellipticity,
Q, in degreesÆcm
2
Ædmol
)1
.
Metal content
The possible presence of an iron-sulfur cluster was inves-
tigated by colorimetric analysis, following procedures
modified from Lovenberg [23] and Beinert [24], respectively.
Kinetic constants
The catalytic activity of PHR was evaluated both in the
presence and in the absence of PHI.
K
m
and k
cat
were determined from Hanes–Haldane plot
for the two electron acceptors cytochrome c and NBT,
using 0.24 m
M
NADH as electron donor in 50 m
M
Tris/
sulfate buffer, pH 8.5, at 30 °C.
Reconstitution of PH activity ‘
in vitro
’
Reconstitution of the complex from the purified fractions
was studied by investigating the overall PH activity in the
presence of variable amounts of each component. The assay
was performed with a Clark type electrode in the presence
of 1.7 m
M
NADH in 100 m
M
Mops/NaOH buffer, pH 7.4
at 24 °C. The basal oxygen consumption was subtracted
from the consumption recorded after addition of 1 m
M
phenol. The effects of PHI and PHR concentrations on the
overall PH activity were evaluated by systematic variation
of PHI concentration (0.3; 0.6; 1.2 l
M
)overarangeof
PHR/PHOratios(upto6),keepingfixedaPHOconcen-
tration of 0.6 l
M
.
Results
PHI purification
None of the fractions eluted from the first anion exchange
column (DE 52-cellulose) exhibited the overall PH activity
(i.e. oxygen consumption promoted by the presence of
phenol). Individual fractions were tested for PHR activity,
using cytochrome c as substrate. The fractions showing
PHR activity were found to contain a second component
that could be separated by gel permeation chromatography
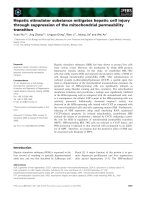
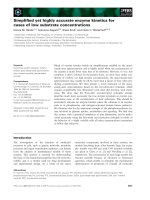
on Superdex 75, as shown in Fig. 1. The 18 kDa protein
present in the elution pattern was identified as the PHI
component on the basis of its ability to complement the
Fig. 1. SDS/PAGE of PHI at different steps of purification. The
numbers on the left represent the molecular masses (kDa). Lane A: low
molecular mass standards; lane B: crude extract; lane C: after anion
exchange chromatography on a DE 52-cellulose column; lane D: after
anion exchange chromatography on a Source Q15 column; lane E:
after gel filtration. The arrows point to PHR and PHI.
1436 E. Griva et al. (Eur. J. Biochem. 270) Ó FEBS 2003
PHO- and PHR-containing fractions in restoring the overall
PH activity.
The yield of the PHI component suggested that it
accounts for 0.25–0.3% of the soluble cellular protein.
Molecular mass and isoelectric point
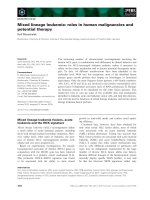
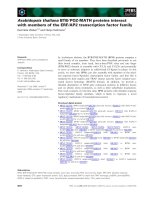
The molecular mass of PHI, determined by SDS/PAGE,
was 10 kDa. A similar result (8.8 kDa) was obtained by
mass spectrometry (MALDI-TOF) analysis (Fig. 2). A
twice as large value (18 kDa) was found by gel-permeation
chromatography on Superdex 75. Therefore, it is likely that
the native protein occurs as a dimer. The isoelectric point,
determined by analytical isoelectrofocusing on ampholyte
gels, was 4.1.
Absence of redox centres
The UV/Vis absorption spectrum of PHI at pH 7.0 and at
20 °C exhibited the typical protein peak at 280 nm.
Neither in native samples nor in samples treated with
reducing or oxidizing agents were detected chromophoric
groups absorbing in the interval between 300 and 800 nm.
These results were confirmed by the Lovenberg [23] and
Beinert analyses [24] which failed to show iron- or sulfur-
containing redox-centres in the pure protein. In agreement
with these findings, the emission spectrum of PHI,
determined by spectrofluorimetry in the same conditions,
exhibited a maximum at 345 nm on excitation at either 280
or 295 nm.
N-terminal sequence
The first 11 aminoacids at the N-terminus of PHI (sequence:
SKVYLALQDND) were compared with the sequences of
the so called ‘intermediate components’ from two other
PHs. The N-terminal sequence of PHI from A. radioresis-
tens S13 is identical (from residue number 3) to the sequence
of the corresponding component of PH from A. calcoace-
ticus NCIB 8250 (11/11 identity) [3] and very similar to that
of the corresponding component of PH from Pseudomonas
CF600] (8/11 identity) [25] (residue number 1 being the
starting methionine).
Secondary structure and thermal denaturation studies
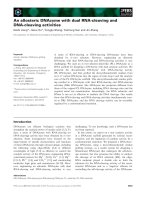
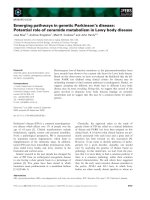
Figure 3 shows the far-UV CD spectrum of PHI in 10 m
M
sodium-phosphate buffer, pH 7.0. The CDNN deconvolu-
tion programme indicates that this spectrum results from
the presence of both helices and b-sheets.
PHI was submitted to progressive heating. The CD
spectrum was recorded in the temperature range 10–70 °C
after reaching thermal equilibrium. As shown in the inset,
the progressive decrease of the molecular ellipticity at
k ¼ 200 nm (the absorption region of the peptide bond)
reflects the occurrence of a transition between 35° and
55 °C.
PHI does not interact with phenol
The emission spectrum of the protein at 350 nm (on
tryptophan excitation at 280 nm) is not affected by phenol
addition. This result suggests that no interaction between
phenol and PHI takes place. To confirm the lack of a
hydrophobic site on the PHI surface, we investigated the
possible interaction with the hydrophobic probe ANS: no
fluorescence emission associated with ANS binding could be
detected. Furthermore, PHI does not bind to a Phenyl-
Sepharose column, confirming a low affinity for hydro-
phobic sites in general.
PHI is essential for the catalytic activity
of the reconstituted PH system
A stoichiometry 2 PHR monomers: 1 PHI dimer: 1 PHO
(abc) dimer was found to provide optimal phenol reaction
rates.
PH activity in function of PHR concentration follows a
Michaelian behaviour at fixed concentrations of PHO and
PHI (Fig. 4). When the latter components are present at
0.6 l
M
, in terms of dimeric units, a maximum turnover
number of 70 min
)1
was obtained upon increasing PHR
concentration: the plateau is reached at 1.2 l
M
PHR (in
terms of monomeric units) (Fig. 4, continuous line with
triangles). Excess of PHI over PHO does not alter the
overall enzyme activity (Fig. 4, broken line with asterisks),
in contrast to what observed in MMO from Methylosinus
trichosporium [26].
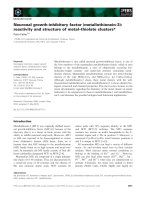
The emission intensity of the PHR flavin shows a 17%
increase after addition of PHI to either the complex PHR-
PHO or to PHR alone, in the stoichiometry ratio
PHR : PHO : PHI 2 : 1 : 1 (Fig. 5). On the contrary, the
emission spectrum of PHO-bound ANS is not affected by
the addition of PHI, suggesting no specific PHI interaction
with the substrate binding site of PHO.
PHI is not required for PHR activity towards alternative
electron acceptors
The kinetic constants for the two artificial electron acceptors
cytochrome c and NBT, using NADH as the electron
donor, were determined from Hanes–Haldane plot in the
presence of either PHR alone or the couple PHR + PHI,
as reported in Table 1. The differences in K
m
and k
cat
are
not significant, suggesting that the catalytic activity of PHR
does not depend on the presence of the regulatory protein.
Fig. 2. MALDI-TOF spectrum of PHI. The protein was dissolved in
70% acetonitrile/water solution. Thirty pmol were mixed with 50 lL
sinapinic acid matrix and were injected into the mass spectrometer.
Ó FEBS 2003 A. radioresistens S13 phenol hydroxylase regulatory component (Eur. J. Biochem. 270) 1437
Discussion
The small size of the PHI monomer ( 9 kDa) is consistent
with both a ferredoxin-like [13,15] and a regulatory protein-
like role in the overall PH catalyzed reaction [3,9]. The
absence of redox centres (FAD, Fe/S) excludes the first
hypothesis and therefore a direct involvement of PHI in
electron transfer. This conclusion is consistent with the very
low degree of identity between the N-terminal sequence of
PHI and those of ferredoxin-like proteins belonging to other
oxygenases. On the contrary, the N-terminus of PHI is
identical to that of MopN from A. calcoaceticus NCIB 8250
and very similar to that of P2 from Pseudomonas CF600,
both regulatory components of PHs. PHI has been found
to be strictly necessary for the phenol to catechol conversion,
Fig. 4. Reconstitution of PH activity in vitro in the presence of variable
amounts of each component. The assay was performed with a Clark-
type electrode in the presence of 1.7 m
M
NADH in 100 m
M
Mops/
NaOHbuffer,pH 7.4,at24 °C. Data were obtained with 1 m
M
phenol
as a substrate and are corrected by subtraction of the basal oxygen
consumption. PHI concentration (0.3, 0.6 and 1.2 l
M
, i.e. PHI/PHO
ratios: 0.5, 1 and 2) was varied over a range of PHR/PHO ratios (up to
6), keeping fixed a PHO concentration of 0.6 l
M
. The data were fitted
to Michaelis–Menten curves. Squares and dotted line: data and fitting
with PHI/PHO ratio of 0.5. Triangles and continuous line: data and
fitting with PHI/PHO ratio of 1. Asterisks and broken line: data and
fitting with PHI/PHO ratio of 2.
Fig. 5. Effect of PHI on the flavin fluorescence of the complex PHR–
PHO. Dotted line: fluorescence emission spectrum of the couple PHR–
PHO (2 : 1) in Hepes/NaOH buffer, pH 7.0. Solid line: fluorescence
emission spectrum after the addition of PHI to the above mentioned
mixture. k excitation 450 nm.
Fig. 3. Temperature dependence of PHI far-UV circular dichroism spectra. Conditions: 10 l
M
PHI in 10 m
M
sodium-phosphate buffer, pH 7.0;
spectra were registered at scan speed of 50 nmÆmin
)1
, with 3 accumulations. The inset shows the progressive decrease of molecular ellipticity at
k ¼ 200 in the temperature range of 10–70 °C. Before circular dichroism analysis, the samples were preincubated at the indicated temperatures, for
10 min, in sealed quartz cuvettes.
1438 E. Griva et al. (Eur. J. Biochem. 270) Ó FEBS 2003
as the corresponding regulatory proteins are in the reactions
catalyzed by xylene monooxygenase from Pseudomonas
stutzeri [14] and alkene monooxygenase from Xantobacter
Py2 [15]. In other enzymes (MMO from M. capsulatus and
Methylocistis [5,7], T2M from Burkolderia cepacia [4]), the
regulatory protein acts as an enhancer, but it is not
absolutely required for the reaction.
The optimal ratio reductase: regulatory: oxygenase
component, as observed in M.capsulatus MMO [27],
involves equimolar concentrations (in terms of monomeric
units) of the various components. Excess of PHI over the
oxygenase component does not cause inhibition of the
overall enzyme activity, in contrast to what observed
for M. trichosporium MMO [26].
PHI coelutes with PHR in the chromatographic step
that separates PHO. From the gel filtration column that
separates it from PHR, PHI elutes as an 18-kDa dimer.
The mechanism by which PHI activates PH is still poorly
understood. One possibility is that PHI interacts with one
PHR and one PHO (abc) protomer. The hypothesis of a
direct PHI–phenol interaction is quite unlikely, because of
the fact that the addition of phenol does not alter the
emission spectrum of PHI. Moreover, PHI does not bind
ANS (a probe for hydrophobic sites) and is not retained by
the phenyl Sepharose column (a ligand for phenolic-
recognizing sites and for hydrophobic sites in general).
These results differ from those reported for the regulatory
protein P2 of Pseudomonas CF600 phenol hydroxylase [9],
a molecule with an N-terminus sequence very similar to
that of PHI. NMR studies on P2 have suggested the
presence of a hydrophobic cavity [9] that is likely to bind
phenol and thus favour its interaction with the oxygenase
moiety. The data here reported do not provide any
evidence for the presence of a phenol-binding or other
hydrophobic sites. However, we cannot exclude binding of
the aromatic substrate to a buried cavity in case such an
interaction would not cause changes in the protein
fluorescence signal.
An interaction between PHI-PHR is a likely candidate
to explain the regulatory effect. In fact, on addition of PHI,
the fluorescence of PHR-bound flavin increases. This
finding points to a PHI-induced conformational change
of PHR, possibly resulting in a more pronounced exposure
of FAD to the aqueous solvent. The most important
functional consequence of this PHI-induced conformational
transition of PHR might be: (a) a better exposure of the
Fe/S cluster involved in the electron transfer to PHO; (b) a
favourable orientation of a specific PHR domain allowing
for optimal interaction with PHO. If the former hypothesis
were true, one could expect a more efficient electron
transfer not only to PHO but also to artificial electron
acceptors. However, the reduction of either cytochrome c
or NBT is nearly independent of the presence of PHI.
Furthermore, preliminary CV experiments do not seem to
evidence any change in PHR redox potential on addition
of PHI (G. Gilardi, Dept of Biological Sciences, Imperial
College of Science, Technology and Medicine, London,
UK, personal communication). On the other side, on the
basis of X-ray scattering data, Gallagher and coworkers
[11] suggested that a correct orientation of the reductase
and oxygenase components of methane monooxygenase is
strictly necessary to facilitate intramolecular electron
transfer. PHI might similarly play the role of properly
orienting the other components with respect to each other.
A third mechanism of action, that has been proposed for
the regulatory component of monooxygenases [28], involves
its direct interaction with the oxygenase. On the basis of
MCD studies, it was found that in methane monooxygenase
from M.capsulatus the complexation of the regulatory
component (MMOB) with the oxygenase (MMOH) induces
a conformational change in the active site pocket of the
MMOH a-subunit, leading to a better substrate interaction
with the dinuclear iron centre [28]. This finding was
confirmed by NMR spectroscopic studies, revealing that
MMOB is embedded in the canyon between the two
moieties of the oxygenase component (MMOH) [29]. As
revealed by DPV data, the MMOH a subunit conforma-
tional change-induced by MMOB, causes a decrease of the
redox potential of the dinuclear iron centre [12]; further-
more, EPR studies evidenced a change in M. trichosporium
MMOH signal upon addition of MMOB [30]. This model is
not operating in the case of PH from A. radioresistens S13,
as shown by the lack of alteration in the PHO-ANS
fluorescence upon addition of PHI.
In summary, while the regulatory components of MMOs
act via an interaction with the oxygenase [28–30], and, in the
case of Pseudomonas CF600 phenol hydroxylase, via a
direct interaction with the substrate itself [9], in the case of
A. radioresistens S13 phenol hydroxylase, PHI appears to
interact with the reductase moiety. This PHI–PHR interac-
tion promotes the PHR conformational changes that are
necessary to optimize the mutual orientation of PHR and
PHO and thus electron transfer between them.
Acknowledgements
This work is supported by the EC Biotechnology programme, contract
BIO-960413. We are grateful to D. Corpillo (University of Turin) for
mass spectroscopy analysis, to A. Conti and G. Giuffrida (CNR-
Torino) for N-terminal sequence determination and to D. Cavazzini
(University of Parma) for helpful discussion and CD technical
assistance.
Table 1. Catalytic parameters of A. radioresistens S13 PHR, alone and in the presence of PHI, determined with two artificial electron acceptors. The
K
m
and k
cat
values were determined at 30 °C, in 50 m
M
Tris/sulfate buffer, pH 8.5, using NADH as the electron donor.
Cytochrome c NBT
K
m
(l
M
) k
cat
(s
)1
) k
cat
/K
m
(s
)1
Æl
M
)1
) K
m
(l
M
) k
cat
(s
)1
) k
cat
/K
m
(s
)1
Æl
M
)1
)
PHR 1.3 ± 0.3 61 ± 6 47 10 ± 3 0.63 ± 0.08 0.063
PHR + PHI 1.5 ± 0.2 55 ± 7 36 9 ± 3 0.66 ± 0.05 0.070
Ó FEBS 2003 A. radioresistens S13 phenol hydroxylase regulatory component (Eur. J. Biochem. 270) 1439
References
1. Pessione, E., Divari, S., Griva, E., Cavaletto, M., Rossi, G.L.,
Gilardi, G. & Giunta, C. (1999) Phenol hydroxylase from Acine-
tobacter radioresistens is a multicomponent enzyme: purification
and characterization of the reductase moiety. Eur. J. Biochem. 265,
549–555.
2. Powlowski, J. & Shingler, V. (1990) In vitro analysis and
polypeptide requirements of multicomponents phenol hydroxy-
lase from Pseudomonas sp. strain CF600. J. Bacteriol. 172, 6834–
6840.
3. Ehrt,S.,Schirmer,F.&Hillen,W.(1995)Geneticorganization,
nucleotide sequence and regulation of expression of genes
encoding phenol hydroxylase and catechol 1,2 dioxygenase in
Acinetobacter calcoaceticus NCIB 8250. Molec. Microb. 18, 13–20.
4. Newman, L.M. & Wackett, L.P. (1995) Purification and char-
acterization of toluene-2-monooxygenase from Burkholderia
cepacia. Biochemistry 34, 14066–14076.
5. Green, J. & Dalton, H. (1985) Protein B of soluble methane
monooxygenase from Methylococcus capsulatus (Bath). A novel
regulatory protein of enzyme activity. J. Biol. Chem. 260, 15795–
15801.
6. Fox, B.G., Liu, Y., Dege, J.E. & Lipscomb, J.D. (1991) Complex
formation between the protein components of methane mono-
oxygense from Methylosinus trichosporium OB3b. J. Biol. Chem.
266, 540–550.
7. Shinohara, Y., Uchyama, H., Yagi, O. & Kusakabe, I. (1998)
Purification and characterization of component B of soluble
methane monooxygenase from Methylocystis sp.M.J. Fermen-
tation Bioengineering 85, 37–42.
8. Gallagher, S.C., Cammack, R. & Dalton, H. (1998) Sequence-
alignment modelling and molecular docking studies of the epoxy-
genase component of alkene monooxygenase from Nocardia
corallina B-276. Eur. J. Biochem. 254, 480–489.
9. Qian, H., Edlund, U., Powlowski, J., Shingler, V. & Sethson, I.
(1997) Solution structure of phenol hydroxylase protein compo-
nent P2 determined by NMR spectroscopy. Biochemistry 36, 495–
504.
10. Liu,Y.,Neisheim,J.C.,Lee,S.K.&Lipscomb,J.D.(1995)Gating
effects of component B on oxygenase activation by the methane
monooxygenase hydroxylase component. J. Biol. Chem. 42,
24662–24664.
11. Gallagher, S.C., Callaghan, A.J., Zhao, J., Dalton, H. &
Trewhella, J. (1999) Global conformational changes control
the reactivity of methane monooxygenase. Biochemistry 38, 6752–
6760.
12. Kazlauskaite, H., Hill, A., Wilkins, P.C. & Dalton, H. (1996)
Direct electrochemistry of the hydroxylase of soluble methane
monooxygenase from Methylococcus capsulatus (Bath). Eur. J.
Biochem. 241, 552–556.
13. Pikus, J.D., Studts, J.M., Achim, C., Kauffmann, K.E., Munch,
E., Steffan, R.J., McClay, K. & Fox, B.G. (1996) Recombinant
toluene-4-monooxygenase: catalytic and Mossbauer studies of the
purified diiron and Rieske components of four-protein complex.
Biochemistry 35, 9106–9119.
14. Bertoni, G., Martino, M., Galli, E. & Barbieri, P. (1998) Analysis
of the gene cluster encoding toluene/o-xylene monooxygenase
from Pseudomons stutzeri OX1. Appl. Environ. Microbiol. 64,
3626–3632.
15. Small, F.J. & Ensign, S.A. (1997) Alkene monooxygenase from
Xanthobacter strain Py2. Purification and characterization of a
four-component system central to the bacterial metabolism of
aliphatic alkenes. J. Biol. Chem. 272, 24913–24920.
16. Pessione,E.,Bosco,F.,Specchia,V.&Giunta,C.(1996)Acine-
tobacter radioresistens metabolizing aromatic compounds I Opti-
mization of the operative conditions for phenol degradation.
Microbios 88, 213–221.
17. Pessione, E. & Giunta, C. (1997) Acinetobacter radioresistens
metabolizing aromatic compounds. II. Biochemical and micro-
biological characterization of strain. Microbios 89, 105–117.
18. Sokol, W. & Howell, J.A. (1981) Kinetics of phenol oxidation by
washed cells. Biotechn. Bioeng. 23, 2039–2049.
19. Briganti, F., Pessione, E., Giunta, C. & Scozzafava, A. (1997)
Purification, biochemical properties and substrate specificity of a
catechol 1,2 dioxygenase from a phenol degrading Acinetobacter
radioresistens. FEBS Lett. 416, 61–64.
20. Bradford, M. (1976) A rapid sensitive method for the quantitation
of microgram quantities of protein utilizing the principle of pro-
tein-dye binding. Anal. Biochem. 72, 248–254.
21. Buzy, A., Miller, A.L., Legros, V., Wilkins, P.C., Dalton, H. &
Jennings, K.R. (1998) The hydroxylase component of soluble
methane monooxygenase from Methylococcus capsulatus (Bath)
exists in several forms as shown by elecrospray-ionisation mass
spectrometry. Eur. J. Biochem. 254, 602–609.
22. Edman, P. (1950) Method for determination of the amino acid
sequence in peptides. Acta Chem. Scand. 4, 283–293.
23. Lovenberg, W., Buchanan, B.B. & Rabinowitz, J.C. (1963) Studies
on the chemical nature of clostridial ferredoxin. J. Biol. Chem. 238,
3899–3913.
24. Beinert, H. (1983) Semi-micro methods for analysis of labile sul-
fide and labile sulfide plus sulfane sulfur in unusually stable iron-
sulfur proteins. Anal. Biochem. 131, 373–378.
25. Nordlund, I., Powlowski, J. & Shingler, V. (1990) Complete
nucleotide sequence and polypeptide analysis of multicomponent
phenol hydroxylase from Pseudomonas sp. strain CF600. J. Bac-
teriol. 172, 6826–6833.
26. Lipscomb, J.D. (1994) Biochemistry of the soluble methane
monooxygenase. Annu. Rev. Microbiol. 48, 371–399.
27. Gassner, G.T. & e Lippard, S.J. (1999) Component interactions in
the soluble methane monooxygenase system from Methylococcus
capsulatus (Bath). Biochemistry 38, 12768–12785.
28. Pulver, S.C., Froland, W.A., Lipscomb, J.D. & Solomon, E.I.
(1997) Ligand field circular dichroism and magnetic circular
dichroism studies of component B and substrate binding to the
hydroxylase component of methane monooxygenase. J. Am.
Chem. Soc. 119, 387–395.
29. Walters, K.J., Gassner, G.T., Lippard, S.J. & Wagner, G. (1999)
Structure of the soluble methane monooxygenase regulatory
protein B. Prot.NatlAcad.Sci.96, 7877–7882.
30. Fox, B.G., Liu, Y., Dege, J.E. & Lipscomb, J.D. (1991) Com-
plex formation between the protein components of methane
monooxygenase from Methylosinus trichosporium OB3b.Identi-
fication of sites of component interaction. J. Biol. Chem. 266,
540–550.
1440 E. Griva et al. (Eur. J. Biochem. 270) Ó FEBS 2003