Ionization methods in organic mass spectrometry
Bạn đang xem bản rút gọn của tài liệu. Xem và tải ngay bản đầy đủ của tài liệu tại đây (18.02 MB, 190 trang )
www.pdfgrip.com
www.pdfgrip.com
IONIZATION METHODS IN
ORGANIC MASS SPECTROMETRY
www.pdfgrip.com
RSC Analytical Spectroscopy Monographs
Series Editor: Neil W. Barnett, Deakin University, Victoria, Australia
Advisory Panel: F. Adams, Universitaire Instelling Antwerp, Wirijk,
Belgium; M. Adams, University of Wolverhampton, UP, R. Browner,
Georgia Institute of Technology, Atlanta, Georgia, USA; J. Chalmers, ICI
Research & Technology, Wilton, UK; B. Chase, DuPont Central Research,
Wilmington, Delaware, USA; M. S . Cresser, University of Aberdeen, U .
J. Monaghan, University of Edinburgh, UR,A. Sanz Medel, Universidad
de Oviedo, Spain; R. Snook, UMIST, Manchester, UK
The series aims to provide a tutorial approach to the use of spectrometric and
spectroscopic measurement techniques in analytical science, providing guidance and advice to individuals on a day-to-day basis during the course of
their work with the emphasis on important practical aspects of the subject.
Flame Spectrometry in Environmental Chemical Analysis: A Practical
Guide, by Malcolm S. Cresser, Department of Plant and Soil Science,
University of Aberdeen, UK
Chemometrics in Analytical Spectroscopy, by Mike J. Adams, School of
Applied Sciences, University of Wolverhampton, UK
Inductively Coupled and Microwave Induced Plasma Sources for Mass
Spectrometry, by E. Hywel Evans, Department of Environmental
Sciences, University of Plymouth, UK; Jeffrey J. Giglio, Theresa M.
Castillano and Joseph A. Caruso, University of Cincinnati, Ohio, USA
Industrial Analysis with Vibrational Spectroscopy, by John M . Chalmers, ICI Research & Technology, Wilton, UK, Geoffrey Dent, Zenecca
Specialities, Blackley, UK
Ionization Methods in Organic Mass Spectrometry, by Alison E.
Ashcroft, formerly Micromass UK Ltd., Ahincham, UK; now School of
Biochemistry & Molecular Biology, University of Leeds, UK
How to obtainfuture titles on publication
A standing order plan is available for this series. A standing order will bring delivery of each new
volume immediately upon publication. For further information, please write to:
Turpin Distribution Services Ltd., Blackhorse Road, Lxtchworth, Hertfordshire SG6 1HN, UK.
Telephone: +44(0) 1462 672555; Fax: + 44(0) 1462 480947
www.pdfgrip.com
RSC
ANALYTICAL
SPECTROSCOPY
MONOGRAPHS
Ionization Methods in
Organic Mass
Spectrometry
Alison E. Ashcroft
Formerly of Micromass UK Ltd., Tudor Road, Altrincham,
Cheshire, UK
Now with the Centrefor Biomolecular Sciences,
School of Biochemistry & Molecular Biology, University of Leeds,
Leeds, UK
THE ROYAL
SOCIETY OF
C H EM1STRY
lnformation
Services
www.pdfgrip.com
A catalogue record for this book is available from the British Library
ISBN 0-85404-570-8
0The Royal Society of Chemistry 1997
All rights reserved
Apart from any fair dealingfor the purposes of research or private study, or criticism or review
as permitted under the terms of the UK Copyright, Designs and Patents Act, 1988, this
publication may not be reproduced, stored or transmitted, in any form or by any means,
without the prior permission in writing of The Royal Society of Chemistry, or in the case of
reprographic reproduction only in accordance with the terms of the licences issued by the
Copyright Licencing Agency in the UK,or in accordance with the terms of the licences issued
by the appropriate Reproduction Rights Organization outside the UK.Enquiries concerning
reproduction outside the terms stated here should be sent to The Royal Society of Chemistry at
the address printed on this page.
Published by The Royal Society of Chemistry,
Thomas Graham House, Science Park, Milton Road, Cambridge CB4 4WF, UK
Typeset by Computape (Pickering) Ltd, Pickering, North Yorkshire, UK
Printed by Bookcraft (Bath) Ltd
www.pdfgrip.com
Preface
The aim of this monograph was to produce an introductory guide to ionization
methods which could be referred to on a daily basis during the practice of
organic mass spectrometry.There are numerous ionization methods available
to the modern organic mass spectroscopist, and it can be difficult to choose the
most appropriate one for the analysis in question. This book attempts to
describe the main features of these methods so that the mass spectroscopist can
decide which to use for a particular application, and much of the information
provided herein has been transposed into readily accessible tabular form to
meet this aim.
Although the book was not intended to be a treatise on mass spectrometers
or mass spectrometry in general, a brief introduction was deemed necessary if
only to clarify nomenclature and highlight which instruments can be used with
the various ionization techniques. I make no apology for omitting references
to Ion Trap mass spectrometers which are also used very successfully with
many of the ionization methods described; my reasoning is that as I have had
no practical experience of this type of mass spectrometer, I am not qualified to
advise others how to use them!
After the introductory chapter, the remaining chapters are each dedicated to
a particular ionization method, some more popular than others in modern
times. For each method of ionization, there is a list of common application
areas, a short description of the technique, and a section on how to set up and
obtain the best performance with the method in question. Finally some
examples of sample analyses are highlighted. The references for each chapter
are certainly not intended to be a complete literature search in that particular
area; they are simply supplied as examples of different aspects of the ionization
methods (my favourites if you like). The reason for this is twofold; not only
would a literature search covering thousands of references be quite out of place
in a book of this size, it would almost certainly be out of date before the book
was printed. Most mass spectroscopists have access to good library facilities
and it is recommended that a literature search is performed at the time that it is
required to generate the most up-to-date references.
As a practising mass spectroscopist for 14 years, I have tried to create the
type of book that I would have welcomed over the years; not too bulky a
treatise, enough theory to enable one to understand a method so that it can be
used successfully, but not so much that may unnerve a relative newcomer to
mass spectrometry. After all, mass spectrometry, at least in the author’s
opinion, is a practical analytical technique, and the whole point in having a
mass spectrometer is to use it, and to use it well. Hopefully this book will help
V
www.pdfgrip.com
vi
Preface
users get over the initial hurdle of dealing with sometimes complicated
equipment and become sufficiently proficient to solve real, analytical problems.
Acknowledgements
I would like to thank my employers, Micromass UK Ltd., for allowing me to
use data for many of the figures, and in particular Dr Charles Smith for
reading through the manuscript. I would also like to thank colleagues past and
present from both Micromass UK Ltd. and Kratos Analytical Ltd. for
providing me with much beneficial advice over the years. Lastly I would like to
thank Bill and Helen for their support during this work.
Alison E. Ashcroft
January 1997
www.pdfgrip.com
Contents
Chapter 1 Introduction
1
An Introduction to Mass Spectrometers
2
The Mass Analyser
Introduction
Resolution
Isotope Distributions
Accurate Mass Measurements
Methods of Using the Mass Analyser
Magnetic Sector Mass Spectrometers
Quadrupole Mass Spectrometers
Time-of-Flight Mass Spectrometers
Tandem Mass Spectrometry
Maintenance
3
Ionization Methods in Organic Mass Spectrometry
Which Ionization Methods are Compatible with the
Mass Spectrometers?
Which Ionization Methods are Appropriate for Different
Sample Classes?
A Comparison of Liquid Chromatography-Mass
Spectrometry Methods
Sample Analysis, Data Acquisition and Spectral
Interpretation
Chapter 2 Atmospheric Pressure Ionization Techniques- Electrospray
Ionization and Atmospheric Pressure Chemical Ionization
1
What Type of Compounds can be Analysed by
Atmospheric Pressure Ionization Techniques?
2
Electrospray Ionization
The Principles of Electrospray Ionization
Practical Operation of Electrospray Ionization
Essential Requirements for Operation
Setting up Electrospray Mass Spectrometry
The Analysis of ‘Low’ Molecular Weight, Singly
Charged Samples (up to ca. 132 da)
Molecular Weight Determination
Structural Elucidation
The Analysis of ‘High’ Molecular Weight, Multiply
Charged Samples
vii
1
3
3
3
5
8
10
11
13
15
17
19
20
20
22
23
24
27
28
28
30
30
30
32
32
33
37
www.pdfgrip.com
viii
3
4
Contents
Atmospheric Pressure Chemical Ionization
The Principles of Atmospheric Pressure Chemical
Ionization
Practical Operation of Atmospheric Pressure Chemical
Ionization
Essential Requirements for Operation
Setting up APCI-MS
The Analysis of Samples
Separation Methods Coupled to Atmospheric Pressure
Ionization Techniques
Liquid Chromatography
HPLC Column Selection
HPLC Solvent Delivery Pump Selection
HPLC-API-MS with In-line UV Detection
HPLC-ES-MS with Flow Splitting
Solvent Selection
Examples of HPLC-API-MS
A Peptide Separation
A Pesticide Separation
Capillary Electrophoresis
Interfacing CE to ES-MS
CE-ES-MS Operation
Chapter 3 Electron Impact and Chemical Ionization
1
What Type of Compounds can be Analysed by Electron
Impact and Chemical Ionization Techniques?
2
Electron Impact Ionization
The Principles of Electron Impact Ionization
Practical Operation of Electron Impact Ionization
Essential Requirements for Operation
Setting up Electron Impact Ionization-Mass
Spectrometry
The Filament and the Trap
Tuning and Optimizing the EI Source
Accurate Mass Measurements
The Analysis of Samples Using Direct Introduction
Methods
The Reservoir Inlet System
The Direct Insertion Probe
Spectral Interpretation
Chemical Ionization
3
The Principles of Chemical Ionization
Practical Operation of Chemical Ionization
Essential Requirements for Operation
Setting up Chemical Ionization-Mass Spectrometry
44
44
45
45
45
46
46
46
46
49
50
50
51
52
53
54
54
54
56
60
61
61
63
63
64
64
65
66
69
69
69
71
74
74
76
76
77
www.pdfgrip.com
ix
Contents
4
The Analysis of Samples Using Direct Introduction
Methods
The Direct Insertion Probe
The Desorption Chemical Ionization Probe
Separation Methods Coupled to Electron Impact
and Chemical Ionization
Gas Chromatography
GC-MS Interfacing
GC Columns
GC Injectors
GC Oven
GC-MS Operation and Analyses
Liquid Chromatography Using the Particle Beam Interface
Supercritical Fluid Chromatography
Chapter 4 Fast AtondIon Bombardment Ionization, Continuous Flow
Fast AtondIon Bombardment Ionization
1
What Type of Compounds can be Analysed by Fast Atom/
Ion Bombardment Ionization Techniques?
2
Fast AtodIon Bombardment
The Principles of Fast Atom/Ion Bombardment Ionization
Practical Operation
Requirements for Operation
Setting up and Using Fast Atom/Ion Bombardment
Ionization Mass Spectrometry with the FAB Direct
Insertion Probe
The Analysis of Samples
Choice of Matrix
Interpretation of Spectra
Limitations of FAB
3
Continuous Flow Fast Atom Bombardment
A Description of Continuous Flow and Frit FAB
Practical Operation
Requirements for Operation
Setting up and Using Continuous Flow Fast AtodIon
Bombardment Ionization
4
Separation Methods Coupled to Continuous Flow Fast
AtodIon Bombardment Ionization
Liquid Chromatography
HPLC Solvent Selection
HPLC Column Selection
Capillary Electrophoresis
Interfacing CE to FAB-MS
82
82
82
83
83
83
84
85
86
86
93
95
97
98
98
101
101
102
107
107
109
109
110
110
112
112
112
116
116
116
117
120
120
www.pdfgrip.com
X
Contents
Chapter 5 Field Desorption and Field Ionization
1
What Type of Compounds can be Analysed by Field
Desorption and Field Ionization Techniques?
2
Field Desorption and Field Ionization
The Principles of Field Desorption and Field Ionization
Practical Operation of Field Desorption and Field
Ionization
Essential Requirements for Operation
Setting up Field Desorption and Field Ionization
The Analysis of Samples
Chapter 6 Thermospray Ionization
What Type of Compounds can be Analysed by
1
Thermospray Ionization?
2
Thermospray Ionization
The Principles of Thennospray Ionization
Practical Operation of Thermospray Ionization
Essential Requirements for Operation
Setting up and Using Thermospray
The Analysis of Samples
Separation Methods Coupled to Thermospray
3
Liquid Chromatography
Supercritical Fluid Chromatography
Chapter 7 Matrix Assisted Laser Desorption Ionization
1
What Type of Compounds can be Analysed by Matrix
Assisted Laser Desorption Ionization?
2
Matrix Assisted Laser Desorption Ionization
The Principles of Matrix Assisted Laser Desorption
Ionization
Practical Operation of Matrix Assisted Laser Desorption
Ionization
Essential Requirements for Operation
Choice of Matrix
Sample Preparation and Analysis
Peptides and Proteins
Oligosaccharides
Oligonucleotides
Synthetic Polymers
A Comparison of MADLI-TOF and Electrospray
122
123
123
125
125
125
127
132
132
132
135
135
136
139
143
143
148
151
151
151
156
156
157
158
161
162
163
163
164
Appendix 1 Some Common Abbreviations
166
Appendix 2 Some Common Reference Compounds
168
Subject Index
174
www.pdfgrip.com
CHAPTER 1
Introduction
1 An Introduction to Mass Spectrometers
Although it is beyond the scope of this book to delve deeply into the theory
and physics of mass spectrometers, a brief introduction would appear to be
necessary, not only to clarify the nomenclature used for the various techniques
and hardware described in the remainder of this monograph, but also to
encourage the reader to turn to more complete texts on the subject.
A mass spectrometer, like Caesar’s Gaul, can be divided into three fundamental parts, namely the ionization source, the analyser, and the detector (see
Figure 1.1). Mass spectrometers are used primarily to provide information
concerning the molecular weight of a compound, and in order to achieve this,
the sample under investigation has to be introduced into the ionization source
of the instrument. In the source, the sample molecules are ionized (because
ions are easier to manipulate than neutral species) and these ions are extracted
into the analyser region of the mass spectrometer where they are separated
according to their mass (rn) to charge ( z ) ratios (rnlz). The separated ions are
detected and the signal fed to a data system where the results can be studied,
processed, and printed out. The whole of the mass spectrometer (except for
Atmospheric Pressure Ionization sources) is maintained under vacuum to give
the ions a good chance of travelling from one end of the instrument to the
other without any interference or hindrance. Nowadays the entire operation of
the mass spectrometer and often the sample introduction process are usually
under complete data system control and the operator hardly needs to move
away from the computer terminal to perform the sample analyses.
Many ionization methods are available and each has its own advantages and
disadvantages. The method of ionization used depends on the sample under
investigation, the type of mass spectrometer being used, and the available
equipment. This book describes the more commonly encountered ionization
methods, and aims to provide an account of their set-up and basic operation.
Once the ionization method has been set up and has been shown to be
operating at its optimum performance, then the operator can start to develop
the technique for the particular samples under scrutiny. The optimum performance of any ionization method will depend on the performance and condition
of the mass spectrometer, the reliability of any other equipment and materials
involved, including gas and liquid chromatographs and chromatography
columns, the purity of any solvents or gases used, and the quality of the
1
www.pdfgrip.com
2
data system
ionization
source
analyser
Chapter 1
1
detector
T
sample
[via interface
fromLC or GC]
Figure 1.1 Simplified schematic diagram of a mass spectrometer
standard samples. However, it should be remembered that the optimum
performance must be established before any sample analyses are undertaken,
and this performance should be verified every day, or more frequently if
laboratory procedures dictate or if problems are suspected. If the performance
is not as good as expected then steps should be taken to retrieve any losses in
sensitivity or resolution.
As well as there being a good choice of ionization methods, there are also
many different ways of introducing samples into the ionization source
depending on the ionization method being used and the type of samples under
investigation. For example, single-substance samples can be inserted directly
into the ionization source by means of a probe whereas complex mixtures will
benefit from some kind of chromatographic separation en route to the
ionization source, and this could involve interfacing liquid chromatography
(LC), gas chromatography (GC), supercritical fluid chromatography (SFC), or
capillary electrophoresis (CE) to the mass spectrometer. The methods of
interfacing to the various ionization methods are described in more detail in
the relevant chapters.
After the ionization source, the ions proceed to the analyser region, and a
mass spectrometer is generally classified by the type of analyser it accommodates. There is a variety of analysers, and the ones referred to in this book are
those that are most frequently encountered in organic mass spectrometry,
namely the magnetic sector, the quadrupole, and the time-of-flight. Each will be
discussed in a little more detail later in this Chapter (see Chapter 1, Section 2).
Not all ionization methods are compatible with all of these analysers, as will be
revealed where appropriate in the text.
The detector could be one of several possibilities including inter aka photomultipliers, electron multipliers, microchannel plates, and diode array detectors. On a day-to-day basis, the detector gain should be set at the appropriate
level for acquiring data.
The remainder of this Chapter aims to provide a brief overview of a range of
mass spectrometers and indicate which ionization methods are appropriate. I
have tried to summarize the various ionization methods, instruments, and
sample introduction methods in several different ways so that these summaries
www.pdfgrip.com
3
100961
10%I
I
Figure 1.2 Mass resolution illustrated with the lo?? valley deJinition
can be referred to at a later date when reading the more detailed chapters to
help put the various topics in perspective. The summaries may appear to
overlap, and if this is so, I apologize; it was simply my intention to display the
data in a readily accessible manner, emphasizing different significant aspects so
that the text would appeal to a variety of readers.
2 The Mass Analyser
Introduction
Resolution
The main function of the mass analyser is to separate, or resolve, the ions
formed in the ionization source by their mass to charge ratios (rnlz).
The resolution (R)' of a mass analyser, or its ability to separate two peaks, is
defined as the ratio of the mass of a peak ( M I )to the difference in mass between
this peak and the adjacent peak of higher mass (M2)(see Figure 1.2), Le.:
R=
Ml
M2 - M
1
where R = resolution,
M I = the mass of a peak, and
A42 = the mass of an adjacent, higher mass peak.
In the simplest terms, a singly charged ion at m/z 1000 could be separated
' W. H. McFadden, Techniques of Combined Gas ChromatographylMass Spectrometry: Applica-
tions in Organic Analysis, Wiley-Interscience,New York, 1973.
This book is recommended for its detailed explanation of resolution, and also its descriptions of
different mass analysers.
www.pdfgrip.com
4
Chapter 1
1O(
298.3
299.3
300.3
0'
ttlk
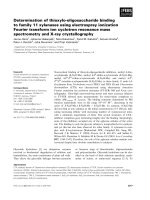
Figure 1.3 Molecular ion (M+') for the compound of molecular formula C19H3802,
showing the isotope distribution
(Reproduced with permission from Micromass UK Ltd.)
from another singly charged ion at mlz 1001 if a resolution of 1000 is available.
Similarly, a singly charged ion at mlz 2000 would require a resolution of 2000
to separate it from a second singly charged ion at mlz 2001, whereas a singly
charged ion at rnlz 100 would need only 100 resolution to separate it from
another singly charged ion at mlz 101.
Resolution, when referring to magnetic sector mass spectrometers, is often
described by the 'valley definition' where a 'resolution of 10% valley' (see
Figure 1.2) means that two peaks of equal intensity are considered resolved
when the height of the valley between the peaks is 10% of the peak height.
Alternatively, and less frequently, one may allude to a resolution of 50%
valley. Quadrupole and time-of-flight mass spectrometers are generally less
able to provide high (or better than unit) resolution, although recent advances
with time-of-flight instruments have led to improvements. In such cases, a
peak width can be described instead; for example, one might say the sample
was analysed with a peak width of 0.5 amu measured at half of the maximum
height of the peak, or 0.5 amu FWHM (full width half maximum).
www.pdfgrip.com
Introduction
5
Is0tope D istr ibu t ions
In general the resolution actually required for most analyses is such that the
singly charged isotope patterns of the detected ions are readily discernible, and
for applications involving molecular weights ca. 1500 da or less, this can be
provided by magnetic sector, quadrupole, and time-of-flight mass spectrometers.
If one considers a small organic compound of molecular formula C19H3802,
then under electron impact (EI) ionization conditions (see Chapter 3) with unit
resolution set for the analyser, a molecular ion (M+') is generated at rnlz 298
(see Figure 1.3) which relates to the intact molecules (less one electron) in
which all the atoms are the lowest mass (and in this case the most abundant)
isotopes (i.e. 12C, 'H, and l 6 0 ) . This value can be taken to be the molecular
weight of the compound. There will also be lower intensity ions at rnlz 299,
which correspond to molecules of the same compound in which one 12Catom
has been replaced by a less abundant, and therefore less probable, 13Cisotope.
The relative intensities of these two ions should relate to the natural
abundances of the isotopes multiplied by the number of carbon atoms in the
molecule. In other words, the intensity of the rnlz 299 ion compared to the rnlz
298 ion should be equal to 1.11 (because the natural abundance of 13Cis 1.11%
of the natural abundance of 12C)multiplied by 19, which equals 21.09%. For
higher molecular weight samples which contain more carbon atoms, the
probability of one of the 12C atoms having been replaced by a 13C atom
increases, and indeed when the number of carbon atoms in a molecule reaches
90, it becomes more probable to find a molecule with one 12Catom replaced by
a 13C atom, than to find a molecule with all its carbon atoms of the 12Ctype.
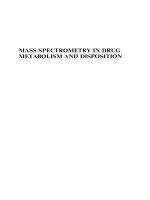
The isotope distribution for a compound of theoretical molecular formula
C100H202 is shown in Figure 1.4 to illustrate t h k 2
If the sample under investigation is already known, then the theoretical
molecular weight can be calculated from the molecular formula of the
compound. If the average atomic masses from the periodic table are used for
this purpose, an accurate, but average molecular weight of 298.5095 daltons
(da) results for the above sample of molecular formula C19H3802. If unit
resolution has been set, this will not be the mass of the ion detected and
reported by the mass spectrometer. Remember that because mass spectrometers separate ions according to their rnlz ratio, so the isotopes of the atoms
should be taken into account when calculating the molecular formula of a
compound. The dominant ion in this particular molecular weight cluster is the
'2C191H381 6 0 2 ion, whose accurate but monoisotopic molecular weight is
298.2872 da. Figure 1.5 presents a list of some of the most commonly
encountered atoms together with their monoisotopic and average masses.
If a mass spectrometer has been properly calibrated, then the mass accuracy
*
D. H. Williams and I. Fleming, Spectroscopic Methods in Organic Chemistry, McGraw-Hill
Book Company (UK) Ltd., Berkshire, UK, 2nd edn, 1973.
This book provides a good basis not only for an explanation and examples of isotope patterns,
but also for general spectral interpretation.
www.pdfgrip.com
6
Chapter 1
1.11
Figure 1.4 Theoretical isotope distribution for the molecular formula CImH202
(Reproduced with permission from Micromass UK Ltd.)
should be good to at least 0.1 da. In the sample described previously,
C19H3802,the difference between the average and monoisotopic molecular
weights is not great and indeed both have the same nominal mass; in this case
the spectrum could have been interpreted equally well regardless of whether
the operator had used monoisotopic or average values for the calculations.
This is not always the case though, and so care should be exercised, especially
when dealing with high molecular weight samples (> 2000 da), or with samples
that exhibit irregular isotope patterns such as those containing chlorine,
bromine, or transition metal atoms such as nickel and zinc. As an example, if
the average and monoisotopic accurate masses are calculated for a sample of
molecular formula C18H12Cl2FNO4S,values of 428.2674 and 426.9848 respectively are obtained. Now there is a significant difference between the two
calculations, and a mass spectrum that produced a molecular ion at mlz 427
would quite correctly be consistent with the monoisotopic calculation, but
would indicate (mistakenly) that the sample was not as expected if the average
masses had been used.
www.pdfgrip.com
Introduction
Atom
7
Is0 tope
Natural
abundance
Mono is0 topic
mass
A verage mass
hydrogen
99.985
0.01 5
1.0078
2.0141
1.0079
carbon
98.90
1.10
12.0000
13.0034
12.0110
14.0031
15.0001
14.0067
15.9949
16.9991
17.9992
15.9994
100
18.9984
18.9984
100
22.9898
22.9898
100
30.9738
30.9738
95.02
0.75
4.21
0.02
31.9721
32.97 15
33.9679
35.967 1
32.0660
chlorine
75.77
24.23
34.9689
36.9659
35.4527
potassium
93.26
0.01
6.73
38.9637
39.9640
40.961 8
39.098 3
bromine
50.69
49.31
78.9183
80.9163
79.9040
100
126.9045
126.9045
100
132.9054
132.9054
nitrogen
oxygen
fluorine
sodium
phosphorus
sulfur
iodine
caesium
99.63
0.37
99.76
0.04
0.20
Figure 1.5 Some frequently encountered atoms with their monoisotopic and average
atomic masses3
The two halides chlorine and bromine each have two isotopes separated by
two mass units; chlorine consists of 35Cland 37Clin the approximate ratio 3:1,
and bromine consists of 79Br and *lBr in approximately equal ratios. This
produces in both cases a distinctive and readily recognisable pattern which is a
good aid for compound identification. If a compound has more than one
bromine or chlorine atom, or one or more of each, then the isotope pattern
increases in complexity and distinction, as shown in Figure 1.6.
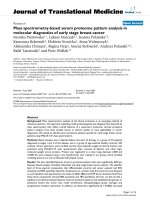
Finally, the expected isotope pattern for an organometallic compound of
molecular formula C24H54Br2NiP2is illustrated in Figure 1.7 to give an idea of
the complexity involved with some samples, and to emphasize the necessity for
correctly calculating the masses of the isotopes in order to be able to interpret
the data properly.
J. R. De Laeter, K. G. Heumann, R. C. Barber, I. L. Barnes, J. Cesario, T. L. Chang and T. B.
Coplen, Pure Appl. Chem., 1991,63,975, and references cited therein.
www.pdfgrip.com
8
Chapter 1
Figure 1.6 Theoretical isotope distributions for compoundr containing multiple chlorine
andtor bromine atoms
Most mass spectrometers will resolve ions with unit resolution up to at least
2000 da, and so monoisotopic atomic masses are used in these cases. Above
2000 da, the resolution should be checked and if it is insufficient to resolve
adjacent isotopes, then average atomic masses are used in calculations.
Accurate Mass Measurements
Occasionally the nominal molecular weight of a sample, as determined with an
accuracy of say, 0.1 da from the mass spectrum, is not sufficient to characterize
the sample. This is especially true if the sample is an original one whose
www.pdfgrip.com
9
Introduction
1’2
.I
IIUI
h2
/
621.1
1
J
Figure 1.7 Theoretical isotope distribution for the organometallic compound of molecular
formula C24H54Br2NiPz
(Reproduced with permission from Micromass UK Ltd.)
molecular formula has to be validated, or if there is a chance that the sample
could have one or more structures which have the same nominal but different
accurate masses. For example, the formulae C21H3603and C19H32N203have
monoisotopic masses of 336.2664 and 336.2413, respectively. The mass spectrum for this sample could indicate a molecular weight for the compound of
336.2 da, but from this information, it is not possible to say which formula is the
correct one; both fit the data equally well. Therefore an accurate mass measurement is required, which should provide a measurement within 5 parts per million
(ppm) error of the correct answer. Accurate mass measurements require due
care and attention in their operation. A suitable reference material needs to be
used, and a means of maintaining the reference in the source simultaneously
with the sample must be sought. For electron impact analyses a volatile
reference material such as heptacosa is often admitted into the ionization source
through a permanently sited reference inlet, whilst the sample is introduced
into the source by means of a probe, or eluting from a GC column.
www.pdfgrip.com
Chapter I
10
If two alternative formulae can be proposed from the nominal molecular
weight obtained from the mass spectrum of the compound, and if both are
expected to be present in the same sample, then the resolution required for
their mlz separation should be calculated so that the resolution on the mass
spectrometer can be set before the experiment is initiated. In the example
above, the resolution R needed is given by:
336.2413
= 13396
336.2664 - 336.2413
The mass spectrometer should be set to provide at least this amount of
resolution if the experiment is to separate these two structures. In general,
resolution above 2000 (10% valley definition) requires the use of a magnetic
sector mass spectrometer.
Accurate mass measurements can be made at any resolution; resolution is the
criterion to be considered when separating masses.
Methods of Using the Mass Analyser
There are different methods of acquiring data when using a mass spectrometer,
and these should be taken into account when designing an experiment. The
most usual method of acquiring data is by scanning the mass analyser over an
appropriate mlz range, thus producing a mass spectrum from which (hopefully)
molecular or quasimolecular (molecular related) ions will provide an indication
of the molecular weight of the sample. If the sample has fragmented (fallen to
pieces) in the ionization source, then these ions will also have been collected,
and often the fragment ions can be studied and information regarding the
structure of the sample pieced together. Almost all samples are analysed with a
full scanning experiment initially to produce as much information as possible
about the sample, and full scanning acquisitions are possible with magnetic
sector, quadrupole, and time-of-flight mass spectrometers. Under appropriate
conditions, accurate mass measurements can also be carried out.
If the analyst is investigating known compounds which have been characterized previously, and wants to ascertain whether or not the expected compound
is present, or needs to determine the concentration level of the sample in a
biological or ecological matrix, then often a selected ion recording (SIR)
analysis is performed. Before this can be carried out, one or more significant
and characteristic ions from the sample must be specified in the acquisition
parameters. These ions could be the molecular or quasimolecular ions, for
example, and/or intense, diagnostic fragment ions. The mass analyser will then
monitor the specified ions by switching from one to the next. This technique is
more sensitive than a full scanning one, because all the available time is spent
on the ions of interest rather than monitoring all the ions over a stipulated mlz
range. The sensitivity is highest if only one ion is monitored, but care must be
taken to ensure that no other isomeric or isobaric compounds are present in
the same sample. A good compromise is to monitor two or three ions for each
www.pdfgrip.com
11
Introduction
compound under scrutiny, as this gives good sensitivity while providing more
credence to the results.
SIR acquisitions are often performed in the pharmaceutical industry where
low levels of drugs and metabolites need to be ascertained in complex
biological matrices which give rise to a high level of background ions. Both
magnetic sector and quadrupole mass spectrometers are used for SIR analyses
but not, in general, time-of-flight instruments. Magnetic sector mass spectrometers, with their high resolution capabilities, can also perform SIR at high
resolution whereby the accurate, monoisotopic mass ions are specified and
monitored, thus producing very much more specific results. High resolution
SIR is used in the field of dioxin analysis, for example.
By far the best method of performing SIR is to use a means of sample
introduction, such as liquid or gas chromatography, which generates sample
peaks of relatively short peak widths that can be integrated, as opposed to the
probe methods of sample introduction which deliver the sample into the
ionization source at a near constant rate over long periods of time.
Magnetic Sector Mass Spectrometers
If a mass spectrometer is considered as comprising a source, an analyser, and a
detector, then the mass spectrometers described in this particular section all
have a magnet as the analyser. Magnetic sector mass spectrometers can have
simply a magnet, or (more frequently) a magnet together with an electrostatic
analyser (ESA), and in the latter case the magnet can either be followed by or
preceded by the electrostatic analyser.
The magnet serves to separate the ions produced in the ionization source
and in this case the separation is achieved by magnetic deflection. In order to
pass the ions from the ionization source into the magnetic analyser, the source
is held at a high voltage, typically between 2000 V and 8000 V, which causes
acceleration of the sample ions out of the source with a high velocity. The
effect of the magnetic field is to deflect the ions in a curved trajectory. The ions
of smaller mass are deflected more than those of larger mass. For an ion to
reach the detector at the end of the mass spectrometer, it must follow a path of
a certain radius (r) through the magnetic field (of strength B), Figure 1.8. The
equation for the path of the ions through the magnet is as fol10ws:~
B2r2
mlz = 2v
where m = mass of an ion,
z = the number of charges on the ion,
B = the strength of the magnetic field,
r = the radius of curvature of the ion’s path, and
Y = the accelerating (source) voltage.
J. R. Chapman, Practical Organic Mass Spectrometry, John Wiley & Sons, Chichester, UK, 2nd
edn, 1994.
This book presents full details of the geometry of magnetic sector mass spectrometers.
www.pdfgrip.com
12
Chapter I
5
Ion Beam
Magnet
1
Deflected Ions
Figure 1.8 Ion’spath through a magnetic analyser of a mass spectrometer
(Reproduced with permission from Micromass UK Ltd.)
From this equation, it can be seen that if the magnetic field is scanned while
the accelerating voltage and the radius of curvature are held constant, then in
turn all the ions of different masses will pass through the magnet in succession
and emerge from the exit, pass through the collector slit and reach the detector.
One scan of the magnet results in the production of one mlz spectrum.
If it is necessary to differentiate between ions that have the same nominal but
different exact masses, higher resolution is required, and for this reason most
commercial magnetic sector mass spectrometers are usually designed with an
electrostatic analyser that operates in conjunction with the magnetic sector to
improve resolution (see Figure 1.9). The mass spectrometer is now termed a
double focusing instrument, and resolutions in excess of 150000 (10% valley
definition)can be achieved on some such instruments.
When ;he ions exit the ionization source, they will have a spread of energies
which contributes to their peak widths. The ESA focuses the velocity, and
hence kinetic energy of the ions. The ESA does not mass analyse. The path of
an ion through the ESA is expressed by the following e q ~ a t i o n : ~
mv2
-=eE
rt
where rn = the mass of an ion,
v = the velocity of an ion,
e = the charge on an electron,
E = the ESA field strength, and
r’ = the radius of the ion’s path in the ESA.
The combination of a magnetic and an electrostatic analyser is termed
double focusing because it is both directional (or angular) and energy focusing.
A well-designed double focusing mass spectrometer has both high resolution
and high sensitivity. Such high specifications often result in an expensive
instrument, but for some specific applications, e.g. dioxin analyses and high
resolution accurate mass measurements, these instruments are irreplaceable
and invaluable. The mass range of the magnetic sector instrument depends on
www.pdfgrip.com
Introduction
13
O U E R ESA
I
’’
I-SOOACE
EllCl
Figure 1.9 Double focusing magnetic sector mass spectrometer with the magnet preceded
by the electrostatic analyser
(Reproduced with permission from Micromass UK Ltd.)
the design of the magnet and this will vary from one mass spectrometer to
another. Although proteins of molecular weight above 20000 da have been
analysed suc~essfully,~
in general very little is cited in the literature for samples
above 10000 da, and with the advent of electrospray ionization6 (see
Chapter 2), large mass ranges are not now an important issue. Magnetic sector
mass spectrometers are often considered to be more difficult to operate then
quadrupole and time-of-flight mass spectrometers, and certainly the high
voltage source is less forgiving to erroneous usage and more demanding to LC
interfacing technology.
Quadrupole Mass Spectrometers
Mass spectrometers with quadrupole analysers have the reputation of being
easier to use than magnetic sector mass spectrometers, and are popular
instruments for a diverse range of applications. Quadrupole mass spectrometers are ideal for coupling with both liquid and gas chromatography and so
their usage includes drug metabolism studies, pharmacokinetic analyses,
pesticide work, the detection of flavours and fragrances, and many other
application areas. Their reliability and robustness makes them the instrument
of choice for multi-user systems such as those of the ‘open a c ~ e s s ’type.
~’~
B. N. Green and R. S. Bordoli, in ‘The Molecular Weight Determination of Large Peptides by
Magnetic Sector Mass Spectrometry’, Mass Spectrometry of Peptides, ed. D. M. Desiderio, CRC
Press, Florida, USA,1991.
J. Fenn, J. Phys. Chem., 1984,88,4451.
D. V. Bowen, F. S.Pullen and D. S. Richards, Rapid Commun. Mass Spectrom., 1994,8,632.
L. C . E. Taylor, R. L. Johnson and R. Raso, J. Am. SOC.Muss Spectrom., 1995,6,387.