Tài liệu Chromatography in the petroleum industry docx
Bạn đang xem bản rút gọn của tài liệu. Xem và tải ngay bản đầy đủ của tài liệu tại đây (21.51 MB, 452 trang )
JOURNAL
OF
CHROMATOGRAPHY LIBRARY-
volume
56
chromatography
in
the
petroleum industry
This Page Intentionally Left Blank
JOURNAL
OF
CHROMATOGRAPHY LIBRARY-volume
56
chromatography
in
the
petroleum
industry
edited
by
E.
R.
Adlard
Burton,
South
Wirral,
UK
ELSEVIER
Amsterdam-Lausanne-New
York-Oxford-Shannon -Tokyo
1995
ELSEVIER SCIENCE B.V.
Sara Burgerhartstraat 25
P.O.
Box
21 1,1000AE Amsterdam, The Netherlands
Library
of
Congress Cataloging-in-Publication Data
Chromatography
in
the petroleum industry
/
edited
by
E.R.
Adlard.
cm.
(Journal
of
chromatography library
;
v.
56)
p.
Includes bibliographical references and index.
ISBN
0-444-89776-3
(acid-free)
1.
Petroleum-Analysis.
2.
Chromatographic analysis-Industrial
applications.
I.
Adlard,
E.R.
11.
Series.
TP691.C58 1995
665.5’028’7 dc?O
95-30628
CIP
ISBN
0-444-89776-3
0
1995 Elsevier Science B.V. All rights reserved.
No part of this publication may be reproduced, stored in a retrieval system or transmitted in any
form or by any means, electronic, mechanical, photocopying, recording or otherwise, without
the prior written permission of the publisher, Elsevier Science B.V., Copyright
&
Permissions
Department,
P.O.
Box
521,1000 AM Amsterdam, The Netherlands.
Special regulations for readers in the U.S.A.
-
This publication has been registered with the
Copyright Clearance Center Inc. (CCC), Salem, Massachusetts. Information can be obtained from
the CCC about conditions under which photocopies of parts of this publication may be made in
the
U.S.A.
All other copyright questions, including photocopying outside
of
the
U.S.A.,
should be
referred to the publisher.
No
responsibility is assumed by the publisher for any injury and/or damage to persons or
property as a matter of products liability, negligence or otherwise, or from any use or operation
of
any methods, products, instructions or ideas contained
in
the material herein.
This book is printed
on
acid-free paper.
Printed in The Netherlands
V
Contents
Foreword
XV
List
of
Contributors
XVII
Chapter
1
.
The analysis
of
hydrocarbon gases
C.J.
Cowper
1.1
Introduction
1.2
Natural gas
1.2.1
Analytical requirements
1.2.1.2
Hydrocarbon dewpoint calculation
1.2.2
Analytical procedures
1.2.2.3
C6+ detail
1.2.2.4
Temperature programming
1.2.2.6
Separation
in
backflush
1.2.3
Quantitative measurement
1.2.1.1
CV measurement
1.2.2.1
Isothermal methods
1.2.2.2
Two detectors
1.2.2.5
Combined systems
1.2.2.7
Rapid analysis
1.2.3.1
Comprehensive analysis
1.2.3.2
Air
contamination
1.2.3.3
Resolution
1.2.3.4
Precision
1.2.4.5
Response function
1.3
Refinery gas
1.3.1
Analytical requirements
1.3.2
Analytical procedures
1.3.3
Sample handling
1.4
Conclusions
1.5
Acknowledgements
1.6
References
1
1
2
5
5
8
10
10
16
16
18
19
19
21
25
25
25
26
26
27
28
29
30
37
38
39
40
Chapter
2
.
Advances in simulated distillation
41
2.1
Introduction
41
2.2
Middle distillates and lube oils
42
2.2.1
Precision
42
D.J.
Abbott
2.2.2
Capillary
columns
44
VI
Contents
2.2.3
Aromatics and heteroatoms
2.2.4
Multi-element speciation.,
2.3
Gasolines and gasoline fractions
2.4
Heavy lube oils and residues
2.5
Crude oils
2.6
Process control and other applications
2.1.
Conclusions
2.8
References
Chapter
3
.
The chromatographic analysis
of
refined and synthetic waxes
3.1
3.2
3.3
3.4
3.5
3.6
A
.
Barker
Introduction
Gas liquid chromatography
3.2.1
Establishing present technology
3.2.2
The
1980s
revolution
3.2.2.1
Sample introduction
3.2.2.2
Detection
3.2.2.3
High temperature
GLC
columns
Quantitative gas liquid chromatography separation of waxes
3.2.3.1
3.2.3
Carbon number distribution analysis
Supercritical fluid chromatography
of
waxes
Size exclusion chromatography
3.4.
I
Early work on the
SEC
analysis
of
waxes
3.4.2
Present day technology
Conclusions
References
Chapter
4
.
4.1
Introduction
4.2
Microcapillary hydrodynamic chromatography
4.2.1
The0
ry
4.2.2
Expressing the size
of
macromolecules
4.2.3
Instrumentation
4.2.3.1
General aspects
4.2.3.2
Detection
4.2.3.3
The column
4.2.4
Applications
4.3.1
From hydrodynamic chromatography to tubular pinch
4.3.2
Coiling effects
4.3.3
Applications
4.4
4.5
Conclusions
4.6
References
Hydrodynamic chromatography
of
polymers
J
.
Bos
and
R
.
Tijssen
4.3
Capillary hydrodynamic chromatography
Hydrodynamic chromatography in packed columns
44
45
46
47
50
51
52
52
55
55
57
57
59
60
64
65
70
75
78
81
82
84
89
90
95
95
96
96
99
100
100
102
103
104
111
111
117
119
120
124
125
Contents
VII
Chapter
5
.
Chromatography in petroleum geochemistry
127
S.J.
Rowland and
A.T.
Revill
5.1
5.2
5.3
5.4
5.5
Introduction
5.1.1
Recent reviews
Kerogen and other petroleum macromolecules
Geochemistry of petroleum
5.3.1
LC, TLC and TLC-FID
5.3.2
HPLC
5.3.3
GC
5.3.4
GC-MS
5.3.6
LC-MS
5.3.5
GC-isotope ratio-MS
5.3.7
SFC, GPC and SEC
Summary
References
Chapter
6
.
The
O-FID
and its applications in petroleum product analysis
Oxygenates as components of motor gasoline
Determination of oxygenates in unleaded fuels
6.3.1
Cracking reactor
6.3.2
Hydrogenation microreactor
6.4
Analytical procedure
6.4.1
Quantitative analysis
6.4.2
Total oxygen determination
Selectivity for oxygenates and sensitivity
6.5
O-FID applications
A
.
Sironi and G.R. Verga
6.1
Introduction
6.2
6.3
O-FID analyser
6.3.1.1
Low temperature cracker
6.2.1
6.4.2.1
6.6
Conclusion
6.7
References
Chapter
7
.
Microwave plasma detectors
Principle of operation
of
an atomic emission detector (AED)
Historical development of the plasma detector
Description and evaluation of a home-built atomic emission detector
A
.
de Wit and
J
.
Beens
7.1
Introduction
7.2
7.3
7.4
7.4.1
Description of the apparatus
7.4.1.1
Microwave cavities
7.4.1.2
Microwave power supply
7.4.1.3
Spectrometer
7.4.1.5
Sample introduction system
7.4.1.4
Optical system
127
127
128
130
131
132
133
135
137
137
138
138
139
143
143
144
146
147
147
150
151
152
152
154
155
156
157
157
159
159
160
162
164
164
164
166
167
168
169
VllI
Contents
7.4.2
Plasma start-up
7.4.3
Operating limits of the detector
7.4.3.1
Emission line intensity
7.4.3.2
Plasma pressure
7.4.3.3
Microwave power
7.4.3.4
Quartz tube diameter
7.4.3.5
Optical system
7.4.3.6
Slit width
7.4.3.7
Upper limit of detection
7.4.3.8
Type and amount of scavenger gas
7.4.3.9
Linear dynamic range of the detector
7.4.3.10
Linear dynamic range for hydrogen
7.4.4
Selectivity
7.4.4.1
Selectivity to
H,
0
and
N
7.4.4.2
Selectivity to carbon
7.5
Conclusions
7.6
Description of the Hewlett Packard
592
1
A AED
7.6.1
Gas chromatograph and transfer line
7.6.2
Microwave cavity, discharge tube and gas flow system
7.6.3
The photodiode array spectrometer
7.6.4
Computerized control and data treatment
7.6.5
Characteristics
7.7
Typical applications
7.7.1
Multi-element SimDist ses
7.7.1.1
Multi-element SimDist sohare
7.7.1.2
Linear dynamic ranges
7.7.1.3
Simdist results
Determination of chlorine-containing compounds
in
the ethylene
oxide process
Determination of oxygenates in gasoline
Determination of metal porphyrins in crude oils
7.7.2
7.7.3
7.7.4
7.7.5
Determination of noble gases in natural gas
7.5
Conclusion
7.9
References
Chapter
8
.
The sulfur chemiluminescence detector
R.S.
Hutte
8.1
Introduction
8.2
Sulfur-selective detectors for gas chromatography
8.3
The sulfur chemiluminescence detector
8.4
Performance characteristics of the
SCD
8.5
Factors influencing the sensitivity and selectivity
of
the
SCD
8.6
Flameless sulfur chemiluminescence
8.7
Column selection and sampling techniques
8.8
ADdications
169
170
171
172
172
173
173
174
174
176
177
179
180
180
181
184
184
185
187
189
190
190
191
191
192
194
195
197
197
197
197
197
200
201
201
202
203
207
209
211
213
215
Contents
IX
8.8.1
Refinery gases
8.8.1.2
Gasoline
8.8.1.3
Diesel fuels
8.8.1.4
High temperature gas chromatography
8.9
Conclusions
8.10
Acknowledgments
8.11
References
Chapter
9
.
Multi-column systems in gas chromatography
H
.
Mahler.
T
.
Maurer and
F
.
Mueller
9.1
Introduction
Limitations of single-column systems
9.1.1
9.1.2
Multi-column systems
9.1.3
Multi-column chromatography
9.1.3.1
Definition
9.1.3.2
Variants of column switching
Selectivity tuning
in
series-coupled columns
9.2
9.3
Column switching techniques
9.3.1
General
9.3.2
Backflushing
9.3.3
cutting
9.3.4
Distribution cutting
9.3.5
Special switching techniques
Summation of backflushed compounds
9.3.5.2
Stopped flowlstuttering
9.3.5.3
Recycle chromatography
9.3.5.1
9.4
Practical aspects
9.4.1
Valve switching
9.4.2
Valveless flow switching
9.4.2.2
Live-switching
Column-switching as a sampling technique
9.4.3.1
Sampling fiom a capillary pre-column to a main capillary
column
9.4.3.2
Coupling of columns of different type with intermediate
9.4.2.1
Deans-switching
9.4.3
trapping
Strategies for the application of multi-column systems
9.5.1
General remarks
9.5.2
Guidelines for the use of single- or multi-column systems
9.6
References
9.5
Chapter
10
.
Supercritical fluid extraction
T.P.
Lynch
10.1
Introduction
10.2
Why use supercritical fluid extraction?
215
218
218
218
227
227
227
231
231
231
232
233
233
234
238
241
241
244
245
246
249
249
250
250
250
251
252
253
255
258
260
262
263
263
266
266
269
269
271
x
10.3
10.4
10.5
10.6
10.7
Contents
10.2.1
Technical advantages
10.2.1.2
Selectivity
10.2.1.3
Volatility
10.2.1.4
Matrix penetration
Environmental and safety advantages
ms
10.3.2
Sample vessels and temperature control
10.3.4
Extract collection
SFE techniques
10.4.1
Static extraction
.
10.42
Dynamic extract
10.4.3
Recirculating extraction
10.4.4
Extraction of liquids
10.4.5
Reactive extraction
10.4.6
Off-line extraction
10.4.7
On-line extraction
Petroleum-based applications
10.5.1
Off-line applications
10.5.1.1
Residual oil on drill cuttings
10.5.1.2
Drilling mud characterization
10.5.1.3
Petroleum core and rock extractions
10.5.1.4
Refinery catalysts, deposits and sludges
10.5.1.5
Automotive engine particulates
10.5.1.6
Environmental analysis
10.5.2
On-line applications
10.5.2.1
On-line SFE-GC
10.5.2.2
On-line SFE-HPLC
Conclusion
References
10.2.1
.
1
Solubility
10.2.2
10.3.3
Depressurization
27 1
271
271
274
274
275
275
276
277
278
278
280
280
280
281
281
283
283
284
284
284
284
286
287
288
288
290
291
291
299
301
301
Chapter
11
.
Supercritical fluid chromatography
1
.
Roberts
1
1.1
Introduction
1
1.2
Instrumentation
Mobile phase pumps
1
1.2.1.2
Syringe pumps
I
1.2.2
Ovendtemperature control
11.2.3
Injectors
1
1.2.4
Detectors
.
11.2.4.1
Universal detectors
1
1.2.4.2
Spectroscopic detectors
1
I
.
2.1
1
1.2.
I
.
1
Reciprocating pumps
305
305
306
307
308
308
309
309
310
311
314
Contents
XI
11.2.4.3
Element specific detection
1 1.2.5
Restrictors
11.2.5.1
Fixed restrictors
11.2.5.2
Variable restrictors
1
1.3
Applications
11.3.1
Simulated distillation
1 1.3.2
Hydrocarbon group type analysis
1 1.3.2.1
Gasolines
11.3.2.2
Kerosenes and naphthas
11.3.2.3
Diesel fuels
11.4
References
Chapter
12
.
HPLC and column liquid chromatography
A.C.
Neal
12.1
Introduction
12.2
Apparatus
12.2.1
Solvent reservoirs
12.2.2
Pumps
12.2.3
Sample injectors
12.2.4
Columns
12.2.5
Detectors
12.2.6
Selective property detectors
12.2.6.1
UV-visible spectrophotometers
12.2.6.2
Diode array detectors (DAD)
12.2.6.3
Fluorescence detectors
12.2.6.4
Electrochemical detectors
12.2.6.5
Flame ionization detector
12.2.6.6
Mass spectrometers
12.2.6.7
Infrared and
NMR
12.2.7
Bulk
property detectors
12.2.7.1
Refractive index detector
12.2.7.2
Evaporative light scattering detectors
12.2.7.3
Dielectric constant detector
12.4
Applications
12.4.1.1
Polycyclic aromatic hydrocarbons (PAHs)
12.4.1.2
Other indigenous compounds
12.4.1.3
Additives and contaminants
12.4.1.4
Compound classes
12.5
Preparative HPLC and column liquid chromatography
12.5.1
Standard methods
12.7
Future trends
12.8
References
12.3
Quantitation
12.4.1
Individual compounds
12.6
Individual publications
318
320
320
321
322
322
328
330
334
336
343
347
347
348
348
348
350
351
353
353
353
354
355
355
356
356
357
358
358
359
360
361
362
362
362
365
366
368
370
370
371
372
3 72
XI1
Contents
Chapter
13.
Modern data handling methods
375
The role ofthe data processor
13.2.1 The modem integrator has four distinct roles
376
13.2.3
Prepare and distribute data, information and reports
378
13.3 Limitations
of
the detector signal
378
13.3.1
Injector fractionation
is
uniform
378
13.3.2 All solutes of inte
379
13.3.3
Column resolution is
379
13.3.4
All solutes
of
interest
379
13.3.5 Signalinoise ratio
379
13.3.6 Detector is linear
380
13.4
Detector signal processing
380
13.4.1 Improving signal to
380
13.4.2 Electronic filtering
381
N.
Dyson
1
3.1
Introduction
375
13.2
376
13.2.2 Lab economics
378
13.4.3 Software smoothing
13.4.4 Measurement of pe
381
13.4.5 Baseline placement
developments
382
13.4.7 Selective extraction
383
13.4.7.2 Signal subtraction
383
13.4.8 Resolution enhancement.
384
13.5.2 Errors crea
385
13.5.4
Errors created by asymmetry
386
13.5.5
Transmission of systematic errors through oups
387
13.5.7 Errors of tangent/perpendicular peak splitting
390
33.5.8
Ease
of
use
390
13.6
Calibration
390
13.6.1
Use
of
area
or
height for quantitation
390
I
3.4.6
Mathematical separation (deconvolution)
of
peaks
and integrator
13.4.7.1 Peak model1
383
13.5 Measurement errors
384
13.5.1
Accuracy
13.5.3 Errors crea
13.5.6
Baseline construction errors
390
13.6.2
13.6.3 Limitations of the standard calculations
391
391
392
13.6.4
Calibration curves
392
Calculations and response factors
1
3.6.3.3 External standard
13.6.5
Empirical correction of analysis errors
393
13.7 Validation and standard chromatograms
393
Contents
XI11
13.7.1
Meaning of validation
13.7.2
System suitability
13.7.3
Validation and standard chromatograms
Strategies for peak measurement
13.8.1
Noise
13.8.2
Baseline drift
13.8.3
Peak overlap
13.8.4
Asymmetry
13 3.6
Integrators
Checking the analysis results
13.8.7.1
Checking the chromatogram
Checking the analysis rep0
rt
Accepting the results
13.8
13.8.5
Detectors
13.8.7
13 3.7.2
13 X7.3
13.9
References
Chapter
14
.
Capillary electrophoresis in the petroleum industry
T
.
Jones and
G
.
Bondoux
14.1
Introduction
14.2
Separation techniques
14.2.1
Free-zone capillary electrophoresis (FZCE)
14.2.2
Micellar electrokinetic chromatography (MEKC)
14.2.3
Gel filled capillary electrophoresis (GFCE)
14.2.4
Capillary isoelectric focusing (CIEF)
14.2.5
Instrumentation
14.2.6
Capillary
14.2.7
High voltage power supply
14.2.8
Temperature control
14.2.9
Injection
14.2.10
Detection
14.2.10.1
UV detection
14.2.10.2
Fluorescence, indirect fluorescence, laser-induced fluo-
rescence
14.2.10.3
Amperometric detection, conductometric detection, MS
detection
14.3
14.4
Conclusion
14.5
References
Applications of capillary electrophoresis
393
394
394
395
396
396
396
396
397
397
397
397
398
398
398
401
401
404
404
408
411
412
412
412
413
413
414
415
416
418
419
421
424
425
Subject Index
427
This Page Intentionally Left Blank
XV
Foreword
Although the spectacular development of gas chromatography in the
1950s
and
1960s
is now a fading memory of a golden era, there are still advances being
made in apparatus, technique and applications. The petroleum industry makes
use of all the variants of chromatography as should be clear from the present
volume, but gas chromatography in particular is the most important analytical
technique in petroleum analysis and has been since its first announcement by
James and Martin in
1952.
Indeed it is no exaggeration to claim that many of the
major advances in gas chromatography in that golden era emanated from the
laboratories of the petroleum industry.
This book is intended primarily for those concerned with the analysis of crude
oil and its products but many of the chapters have much broader applications. It
is hoped, therefore, that many outside the immediate sphere of petroleum analy-
sis will find sufficient of interest to make it a worthwhile purchase.
In multi-author books there will be inevitable variations in the style and con-
tent of each contribution. There
is
no reason why this should be regarded as a
weakness since as William Cowper pointed out “variety’s the very spice of life”.
Likewise a small amount
of
overlap between some chapters is not a drawback if
it
allows each chapter
to
be a freestanding account of a particular topic.
It was interesting to reread the comments of the editors of the only other book
dedicated to the subject of petroleum analysis by chromatography published
15
years ago. These editors spent some time describing the reasons for the
choice of the title of their book. In this context, it is interesting that the original
title intended for their book was the one used here.
In concluding this foreword,
I
should like to thank all the contributors and El-
sevier for their efforts to make this both a useful and an interesting volume.
E.
R.
Adlard
This Page Intentionally Left Blank
XVII
List
of
Contributors
D.J. ABBOTT
A. BARKER
J.
BEENS
G.
BONDOUX
J.
BOS
C.J.
COWER
A. DE WIT
N.
DYSON
R.S.
HUTTE
T. JONES
T.P. LYNCH
H.
MAHLER
T. MAURER
F.
MUELLER
A.C.
NEAL
Esso Research Centre, Analytical Group, Abingdon, Oxford-
shire
OX1
3 6AE, UK
Dussek Campbell Ltd, Thames Road, Crayford, Dartford, Kent
DAI 4Q.J UK
Koninklijke/ShelI-Laboratorium,
Amsterdam {Shell Research
B.
K),
Badhuisweg 3, 1031 CMAmsterdam, The Netherlands
Waters Chromatography Division, Millipore S.A., 6 Rue Jean-
Pierre Timbaud, BP 307, 78054
St.
Quentin-en- yvelines,
France
Koninkl~~/SheII-Laboratorium,
Amsterdam {Shell Research
B.
K),
Badhuisweg 3,
1031
CMAmsterdam, The Netherlands
84, West Grove, Walton
on
Thames, Surrey KT12 5PD, UK
KoninklijkdShell-Laboratorium,
Amsterdam (Shell Research
B.
K),
Badhuisweg 3, 1031 CMAmsterdam, The Netherlands
@son
Instruments Ltd, Hatton Lyons Industrial Estate, Hatton,
Houghton-le-Spring, Tyne and Wear DH5
Om,
UK
Sievers Instruments Inc., 1930 Central Avenue, Suite
C,
Boul-
der, CO 80301, USA
Waters Chromatography Division, MiIlipore (CK) Ltd, Winster
House, Heronsway, Chester Business Park, Wrexham Road,
Chester CH4 SQR,
UK
Analytical
&
Applied Science Division, BP Research
&
Engi-
neering Centre, Sunbury-on-Thames, Middlesex,
TWI
6 7LN
UK
Siemens AG, Abt AUT 35 CHR, Postfach 21 12 62, 76187
Karlsruhe, Germany
Siemens AG, Abt AUT 35 CHR, Postfach 21
12
62, 76187
Karlsruhe, Germany
Siemens AG, Abt AUT 35 CHR, Postfach 21
12
62,
76187
Karlsruhe, Germany
Esso
Research Centre, Milton Hill, Abingdon, Oxfordshire
OX13 6AE.
UK
XVIII
1.
ROBERTS
A.T.
REVILL
S.J.
ROWLAND
A.
SIRONI
R.
TIJSSEN
G.R. VERGA
List
of
contributors
Analytical
&
Applied Science Division, BP Research
&
Engi-
neering Centre, Sunbury-on-Thames, Middlesex,
TW16
7LN,
UK
CSIRO Division
of
Oceanography, Castray Esplanade, Hobart,
Tasmania, Australia
Petroleum and Environmental Geochemistry Group, Depart-
ment
of
Environmental Sciences, Universily
of
Plymouth, Drake
Circus, Plymouth, PL4
8AA,
UK
Fisons Instruments, Strada Rivoltana,
20090
Rodano (Milan),
Italy
KoninklijkdShell-Laboratorium,
Amsterdam (Shell Research
B.
V.),
Badhuisweg
3,
I03
I
CM
Amsterdam, The Netherlands
Fisons instruments, Strada Rivoltana,
20090
Rodano (Milan),
Italy
E.R.
Adlard
(Ed.),
Chromatography
in
the Petroleum Industry
Journal
of
Chromatography
Library
Series,
Vol.
56
0
1995
Elsevier Science
B.V.
All
rights
reserved
1
CHAPTER
1
The
analysis
of
hydrocarbon
gases
C.J.
Cowper”
British Gas pfc,
London
Research Station, Michael Road,
London
SW6
ZAD,
UK
“That
man
sat
down
to write
a
book, to tell the world what the world had
all
his
life been
telling him.”
Boswell’s Life
of
Johnson
1.1
INTRODUCTION
Hydrocarbon gases can be categorized in a number of ways, one of which is to
define them as natural or man-made.
Natural gas is a major energy source for domestic, commercial and industrial
consumers, and is used,
so
far as possible, with minimum change to the compo-
sition found in the reservoir. It consists generally of methane and other saturated
hydrocarbons and some non-flammable gases. Man-made gases arise from refin-
ing operations on liquid hydrocarbon feedstocks, and their compositions vary
widely according to the process from which they are derived. Those components
found in natural gas are likely to be present, in addition to unsaturated hydrocar-
bons.
Gas chromatography is the principal analytical method used for hydrocarbon
gases. Particular components can be measured by spectroscopic or chemical
means, but for analysis of the bulk of components, the separating power of
chromatography is both essential and well developed.
Although gases are often considered to be simple mixtures, their analysis has
frequently tested the ability
of
gas chromatography, either because of the range
of components present (boiling range, or concentration spread, or both), or be-
cause of the need to use highly specific stationary phases to separate apparently
intractable pairs of components. The different separating requirements relating
to groups of components within the same gas mixture has led to the use of multi-
column systems, with columns being isolated or reversed,
or
their order changed
*
Current
address:
84,
West
Grove,
Walton
on
Thames,
Surrey
KT12
SPD,
UK.
References
p.
40
2
Chapter
I
by means
of
valves. This complexity, which
is
more daunting in prospect than in
use, has led to a number of ready-configured chromatographic systems for many
of the application areas.
The thermal conductivity detector (TCD) and flame ionization detector (FID)
are the
two
most commonly used for hydrocarbon gases in the petroleum indus-
try.
Because many of the gases contain non-hydrocarbon components, the TCD,
as
a
universal detector,
is
essential. Its dynamic range allows it to be used also
for all the major and many of the minor components of most mixtures. The FID,
while the most commonly used detector in gas chromatography generally, can be
regarded as a specialist and specific detector
in
gas analysis. Process chroma-
tographs frequently use the TCD alone, to reduce the need for the extra facilities
needed
for
the use
of
the FID.
1.2
NATURAL
GAS
Hydrocarbon gases arise naturally from a variety
of
sources. Bacterial fermen-
tation under anaerobic conditions produces methane
or
marsh gas in great pro-
fusion, about 109 tonnes per year worldwide. Small accumulations
of
this type
of
gas can be found during tunnelling
or
other operations, and the same mecha-
nisms produce landfill gas from waste. Mine drainage gas is a methane-rich
mixture found where coal measures have been worked. However, the term natu-
ral gas is normally taken
to
refer to the fossil-based gaseous equivalent to oil and
coal, abstracted from ancient, large, deeply buried accumulations. This is the
sense in which the term is used in this chapter.
Natural gases can vary considerably in composition, from nearly pure nitrogen
to
nearly pure carbon dioxide to nearly pure methane. Fortunately for the indus-
try and the consumer, most natural gases consist mainly of methane, with small
amounts of inert gases (helium, nitrogen and carbon dioxide) and ethane and
higher alkanes in concentrations which diminish as their carbon number in-
creases.
By far the largest
use
of natural gas
is
as a fuel, where its accessibility via
wide-ranging distribution systems and its cleanness in terms of handling and
combustion products make it a popular choice for both domestic and industrial/
commercial markets. Other uses are as a chemical feedstock, as a source of pure
single hydrocarbon gases
or
(if present in sufficient quantities) of helium, and
as
a
moderator in nuclear reactors.
Current estimates indicate that the world has more reserves of natural gas than
of
oil at the present rate of consumption. Recent measures of worldwide produc-
tion give a figure of around
lo9
tonnes per year, which is comparable
to
the bac-
terial production referred to earlier.
The analysis
of
hydrocarbon gases
3
Natural gas is part of a continuum of hydrocarbons, ranging from methane to
the heaviest ends of oil, which are found in geological accumulations. Pressure
and temperature conditions in the reservoir are such that there is no distinction
between what we regard as gases and liquids; this only occurs when the fluid has
been extracted and is subject to conditions at which this discrimination is possi-
ble. Whether an accumulation is regarded as a gas or oil field is only a matter of
the relative proportions of the hydrocarbons. Natural gas fields always contain
liquids, usually in the form of a lightish condensate, and oil fields always contain
associated gases.
Gas separated from a natural gas field will burn in that form, but is usually
treated to remove or to control the levels of particular components, for opera-
tional, or contractual, or legislative reasons. Hydrogen sulphide, being toxic and
corrosive, is invariably subject to very low
(parts
per million) specification lim-
its,
and is typically removed in an amine plant. Carbon dioxide is
less
acidic,
but
still potentially corrosive at the pressures used for gas transmission, and its con-
centration is also controlled, usually to low percentage levels. It can be removed
by an alkali scrubbing process. Water is removed by glycol scrubbing, since the
presence of liquid water increases the corrosive effect of acid gases, and because
it can form solid methane hydrate, a clathrate compound, under certain pressure
and temperature conditions. Potential hydrocarbon liquids are also removed,
usually by chilling, sometimes by adsorption. This is to prevent their condensa-
tion downstream of the processing plant.
The fact that natural gas, once processed at the wellhead
or
reception termi-
nal, is in the form which virtually every consumer can accept without modifica-
tion has given rise to very complex and detailed pipeline systems, which cross
international boundaries and finally enter the consumer’s premises.
In
Western
Europe,
most
countries have access to pipeline supplies from Holland, the North
Sea, Siberia and Algeria in addition to their own indigenous sources. In the
United States, which is the home of long-distance natural gas transmission,
pipeline systems include Canada and Mexico as well as extensive offshore net-
works.
Properties and behaviour of natural gas have been reviewed by Melvin
[
13.
A
large number of papers on quality specifications, physical properties, sampling,
odorization and analysis of natural gas, and on calibration gases and standardi-
zation are collected in the proceedings of the
1986
Gas Quality Congress [2].
Analysis of natural gas is carried out for a range of purposes, and the choice
of analytical method is often dictated by the reason for the analysis being re-
quired. There are three basic purposes for analysis:
-
identification of source,
-
calculation of physical properties, and
-
measurement of specific minor components because of their particular
characteristics.
References
p.
40
4
Chapter
I
For identification of source, the concentrations of the inert components and
the ratios of a small number of hydrocarbons are good indicators; the analysis
need not be detailed. An example of specific minor component analysis is the
measurement
of
odorants; the analysis
is
clearly targeted upon
a
few compo-
nents, probably using a selective detector, and the composition of the main com-
ponents is without interest, except insofar as they may interfere with the meas-
urement. Calculation of properties
is
the most common need for analysis, with
calorific value the most usual target.
The following is a list of some of the properties of natural gas which are cal-
culable from analysis. It is not comprehensive, but describes those most fre-
quently used. Most properties can be measured directly, but independently of
each other; a properly configured analytical method allows calculation of all.
1.
Culorijic value
(CV):
Natural gas
is
bought and sold in units of volume, as
a
source of energy, hence the importance of
CV
as energy per unit of volume.
2.
Relative
density
(RD):
This is the density of a gas relative
to
dry air
(=
1.000).
It
is used in metering calculations and for the Wobbe index (see be-
low).
3.
Wobbe index
(WI):
Gases from different sources must be assessed for their
inter-changeability, which represents the effectiveness with which a gas of com-
position
B
will burn on an appliance designed for a gas of composition
A.
WI
is
an empirical measure of the ability to supply heat to
a
burner, and is the most
important characteristic in determining interchangeability. It
is
calculated by di-
viding the CV by the square root of the
RD.
4.
Compression factor
(Z):
Compression factor appears in the modified ideal
gas equation
PV=
nZRT,
and arises from gas phase interactions. For hydro-
carbon gases and their mixtures over normal temperature and pressure ranges,
Z
is
always less than
1,
which means that a defined volume of gas at a defined
pressure
will
contain more moles than predicted from ideal behaviour by a factor
of
1/Z.
At ambient conditions,
Z
for most natural gases is around 0.997, but the
correction is much more significant at higher pressures. At 70 bar, typical of
transmission pressures,
Z
is usually less than 0.9. Metering at high pressure is
therefore very dependent upon accurate measurement or calculation of
Z.
5.
Hydrocarbon dewpoint:
Retrograde condensation is the phenomenon
whereby a liquid phase can separate from a hydrocarbon gas mixture
as
it is de-
pressurized at a constant temperature. It is another feature of gas phase interac-
tions, and may be regarded as a form of “gas phase solubility”, with components
coming out of solution as the pressure binding the molecules together is re-
leased.
6.
.Joule-Thomson coefficient:
This property influences the extent of cooling
as
a
gas is expanded.
As
the pressure of natural gas
is
reduced, the amount of
pre-heating necessary to avoid hydrocarbon condensation can be calculated.
The analysis
of
hydrocarbon gases
5
1.2.1
Analytical requirements
Although distributed natural gases consist mostly of methane, they are in fact
complex mixtures of a dominant major component (methane), a small number
of
components in the range
0.1-15%,
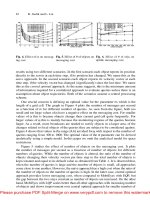
and a large number of trace components. Fig-
ure 1.1 shows the boiling points of both major and minor components from he-
lium to n-decane, indicating a boiling range of over
400°C.
While gases are not
often considered in terms of their boiling points, it is a good illustration
of
the
potential chromatographic problem.
As
a simple rule
of
thumb, an isothermal
separation will handle components with a boiling range of about
100°C.
The ap-
proach
to
natural gas analysis, therefore, can be to split it up into a series
of
separations
of
groups
of
components, a temperature programming approach,
or
a
column switching method. Analytical needs are considered below in respect of
two
important properties:
CV
and dewpoint calculation.
1.2.1.1
CVmeasurement
The
CV
of
a gas mixture is an additive property, with inert gases contributing
zero, and flammable gases contributing in proportion to their concentration and
individual
CV.
A
small correction is necessary for compression factor
(2)
at
ambient conditions.
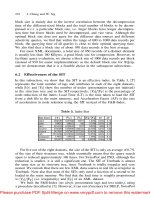
Figure
1.2
shows, for a typical North Sea gas, the component contributions in
terms of molar
%,
and of
CV
and
RD
as percentages
of
the total. Nitrogen, pres-
ent at
2.5%,
contributes nothing to the
CV,
but
4%
to the
RD.
The Y-axis of the
figure
is
limited to
6%
so
that component contributions can be clearly seen.
Methane, of course, contributes far more than the figure indicates.
B.R.
deg
C
200
I
I
-300
I
1
He N2 02 C02 C1 C2 C3 C4 C5 C6 C7 C8 C9 C10
Component
Fig.
1.
I.
Component boiling points.
References
p.
40
6
%
Contribution
Chapter
I
N2
C02
C1
C2
C3
164
nC4
nee=
IC5
n-C5
C6+
Component
IMoiar
%
BCal Value =Re1 Density
Fig.
1.2.
Component contributions.
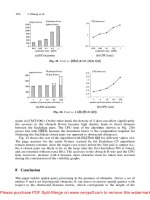
Figure
1.3
expands the information
for
the higher hydrocarbons
(C,
and
above). It
is
clear that the relative contribution to
CV
and
RD
is
greater with in-
creasing carbon number, but the diminishing concentrations means that the ac-
0.2
0.15
0.1
0.05
0
%
contribution
17
nC5
C6
Benr cyC6
C7
To1
MecyC6
CB
C9
C10
Component
mMolar
%
BCal
Value
BRel
Denslty
Fig.
1.3.
Component contributions.