Tài liệu Trade Reforms and Crisis in India’s Plantation Agriculture: Reflections on Tea and Rubber Plantation Sectors pdf
Bạn đang xem bản rút gọn của tài liệu. Xem và tải ngay bản đầy đủ của tài liệu tại đây (571.92 KB, 32 trang )
Trade Reforms and Crisis in India
Trade Reforms and Crisis in India
’
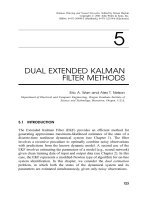
’
s
s
Plantation Agriculture:
Plantation Agriculture:
Reflections on Tea and Rubber Plantation Sectors
Reflections on Tea and Rubber Plantation Sectors
P K Viswanathan, Amita Shah
P K Viswanathan, Amita Shah
Gujarat Institute of Development Research,
Gujarat Institute of Development Research,
Ahmedabad, India
Ahmedabad, India
Outline
Outline
¾
¾
Context of the study
Context of the study
¾
¾
Objectives, data and methods
Objectives, data and methods
¾
¾
Growth in plantation sectors: India
Growth in plantation sectors: India
vs
vs
major countries
major countries
¾
¾
Trade reforms and impacts on two plantation sectors
Trade reforms and impacts on two plantation sectors
¾
¾
Policy perspectives: revamping plantation sectors
Policy perspectives: revamping plantation sectors
¾
¾
In the backdrop of the
In the backdrop of the
‘
‘
crisis
crisis
’
’
affecting India
affecting India
’
’
s plantation sector in recent
s plantation sector in recent
years
years
¾
¾
Triggering factors of the
Triggering factors of the
‘
‘
crisis
crisis
’
’
–
–
both exogenous and endogenous
both exogenous and endogenous
¾
¾
Exogenous: Asian financial crisis, casualties of the changing ex
Exogenous: Asian financial crisis, casualties of the changing ex
ternal trade
ternal trade
regimes in the post
regimes in the post
-
-
WTO scenario: removal of trade barriers enabling easy
WTO scenario: removal of trade barriers enabling easy
market access through NAMA (level playing field with windows of
market access through NAMA (level playing field with windows of
opportunities
opportunities
…
…
for whom? )
for whom? )
¾
¾
Endogenous:
Endogenous:
‘
‘
crisis
crisis
’
’
opens up an array of issues, challenges and internal
opens up an array of issues, challenges and internal
contradictions in the sectors
contradictions in the sectors
…
…
needing thorough revamping and
needing thorough revamping and
interventions
interventions
¾
¾
Little empirical evidence as
Little empirical evidence as
‘
‘
how the crisis spread far and wide and with what
how the crisis spread far and wide and with what
micro level implications on the plantation sector and its sustai
micro level implications on the plantation sector and its sustai
nable future
nable future
’
’
I. The study
I. The study
I. Backdrop
I. Backdrop
¾ India’s plantation sector, viz. tea, coffee, natural rubber, cashew and spices,
though is insignificant in the country’s agri. trade (<5%), has pivotal role in
the regional contexts: coffee, rubber & spices concentration in the South; tea
concentrated in the North, NE and Southern regions
¾ Turmoil in the plantation sector means collapse of the regional economies…
¾ Loss of profitability/ viability to the corporate/ private sector plantation
entities…affecting future investments and sustainability…
¾ Questions on survival of the smallholder producers and plantation labour
communities…. affecting livelihoods of small producers (rubber & tea)
and plantation dependent workforce (tea and rubber) and households
¾ Collapse in the growth dynamism evinced by the plantation sectors since
the colonial times…
I. Backdrop (contd )
I. Backdrop (contd )
¾
¾
Plantation production system emerged under colonial patronage (E
Plantation production system emerged under colonial patronage (E
uropean
uropean
capital and indigenous resources) had a smooth sailing with stro
capital and indigenous resources) had a smooth sailing with stro
ng state
ng state
support and policies until the launching of WTO and the trade re
support and policies until the launching of WTO and the trade re
forms
forms
¾
¾
Tea and rubber are distinct: Tea has always been promoted as an
Tea and rubber are distinct: Tea has always been promoted as an
export crop
export crop
(perhaps under conditions of lower domestic demand) and rubber h
(perhaps under conditions of lower domestic demand) and rubber h
as always
as always
been a strategic raw material catering the growth of the domesti
been a strategic raw material catering the growth of the domesti
c automotive
c automotive
industry with a
industry with a
‘
‘
net importer status
net importer status
’
’
¾
¾
While almost 80% of tea production comes from the large and medi
While almost 80% of tea production comes from the large and medi
um
um
private/ corporate plantations, almost 90% of rubber production
private/ corporate plantations, almost 90% of rubber production
comes from
comes from
small/ marginal holders with an average holding of 0.5
small/ marginal holders with an average holding of 0.5
–
–
2 ha
2 ha
¾
¾
Protective state policies have been highly rewarding in terms of
Protective state policies have been highly rewarding in terms of
sustaining
sustaining
the growth of the sectors, which also forms mainstay of about 4
the growth of the sectors, which also forms mainstay of about 4
million
million
livelihoods of smallholders and plantation workers
livelihoods of smallholders and plantation workers
I. Backdrop (contd )
I. Backdrop (contd )
¾
¾
Outcome: India emerged and continues to be one of the top five p
Outcome: India emerged and continues to be one of the top five p
layers in
layers in
both tea (area
both tea (area
-
-
18%; production
18%; production
-
-
25%) and rubber sectors (area
25%) and rubber sectors (area
-
-
6%;
6%;
production
production
-
-
8%) in the world
8%) in the world
¾
¾
WTO and the subsequent trade reforms has resulted in phased remo
WTO and the subsequent trade reforms has resulted in phased remo
val or
val or
dilution in tariff and non
dilution in tariff and non
-
-
tariff protective measures leading to decline in
tariff protective measures leading to decline in
international commodity prices
international commodity prices
¾
¾
The magnitude of price decline from the peak reported during 199
The magnitude of price decline from the peak reported during 199
1 has been
1 has been
highest for tea (33%) and rubber (11%): Tea
highest for tea (33%) and rubber (11%): Tea
-
-
US$ 0.213/kg (1991) to $0.143/kg
US$ 0.213/kg (1991) to $0.143/kg
(1995); Rubber
(1995); Rubber
–
–
0.6 $/kg
0.6 $/kg
–
–
0.54 $/kg
0.54 $/kg
¾
¾
Low prices triggered adverse effects on the tea and rubber secto
Low prices triggered adverse effects on the tea and rubber secto
rs leading to
rs leading to
an unprecedented crisis prices were ruling below production co
an unprecedented crisis prices were ruling below production co
sts
sts
…
…
I. Backdrop (contd )
I. Backdrop (contd )
¾
¾
Tea planters and rubber growers responded vehemently to the cris
Tea planters and rubber growers responded vehemently to the cris
is: a) cost
is: a) cost
saving measures; b) neglect of plantation management activities;
saving measures; b) neglect of plantation management activities;
c) close
c) close
down/ lockouts; d) abandoning of plantations, etc
down/ lockouts; d) abandoning of plantations, etc
¾
¾
For bigger tea planters, majority of whom own plantations of 250
For bigger tea planters, majority of whom own plantations of 250
-
-
400 ha,
400 ha,
labour displacement, cut down in wage and non
labour displacement, cut down in wage and non
-
-
wage benefits were the
wage benefits were the
immediate workable options to tide over the crisis (mystified
immediate workable options to tide over the crisis (mystified
notion that
notion that
labour was the triggering factor for the crisis)
labour was the triggering factor for the crisis)
¾
¾
Real issues and challenges causing the crisis have been ignored:
Real issues and challenges causing the crisis have been ignored:
issues
issues
pertaining to structure and organisation of production, marketin
pertaining to structure and organisation of production, marketin
g and
g and
institutional impediments, etc
institutional impediments, etc
¾
¾
Hardly any attempt to understand the crisis from a holistic pers
Hardly any attempt to understand the crisis from a holistic pers
pective (other
pective (other
than the conventional supply/ demand/ trade frameworks) of the p
than the conventional supply/ demand/ trade frameworks) of the p
lantation
lantation
system, per se, which has lost its relevance as a production sys
system, per se, which has lost its relevance as a production sys
tem in the
tem in the
context of global economic integration and new trade reform meas
context of global economic integration and new trade reform meas
ures
ures
II. Objectives
II. Objectives
¾
¾
Understand the macro scenarios of production,
Understand the macro scenarios of production,
employment and trade and changing policy environments
employment and trade and changing policy environments
¾
¾
Examine differential responses from the plantation sector
Examine differential responses from the plantation sector
and their implications on sustainable production systems
and their implications on sustainable production systems
and livelihoods of the dependent communities
and livelihoods of the dependent communities
¾
¾
Suggest policy perspective on new institutional model for
Suggest policy perspective on new institutional model for
sustaining the growth dynamism of the tea plantation
sustaining the growth dynamism of the tea plantation
sector in the emerging context (could tea sector take
sector in the emerging context (could tea sector take
lessons from rubber in the Indian context?)
lessons from rubber in the Indian context?)
II. Data and methods
II. Data and methods
¾
¾
Macro analysis of the aggregate level performance of tea and rub
Macro analysis of the aggregate level performance of tea and rub
ber in the
ber in the
dominant producing countries in historic perspective: trends in
dominant producing countries in historic perspective: trends in
area,
area,
production, productivity, trade flow and employment (subject to
production, productivity, trade flow and employment (subject to
data
data
availability), trade relations, etc
availability), trade relations, etc
–
–
Time frame
Time frame
–
–
1960
1960
-
-
2007, with special
2007, with special
reference to 1990s
reference to 1990s
¾
¾
Micro level analysis of the stakeholder responses towards the cr
Micro level analysis of the stakeholder responses towards the cr
isis
isis
-
-
cross
cross
section of tea planters and rubber growers and plantation worker
section of tea planters and rubber growers and plantation worker
s in
s in
Southern India (Kerala, Tamilnadu)
Southern India (Kerala, Tamilnadu)
¾
¾
Analytical methods: qualitative and quantitative, indicators of
Analytical methods: qualitative and quantitative, indicators of
relative
relative
performance on various counts: production, trade, prices, compar
performance on various counts: production, trade, prices, compar
ative
ative
advantages, cost
advantages, cost
-
-
price
price
-
-
wage relatives
wage relatives
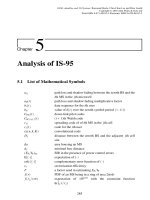
Tea and rubber growing regions in India
Tea and rubber growing regions in India
Tea production (%)
Tea production (%)
Year
Year
North
North
India
India
South
South
India
India
All India
All India
(
(
‘
‘
000 tons)
000 tons)
2007
2007
77
77
23
23
944.7
944.7
615200
615200
(100)
(100)
64883 (11)
64883 (11)
547508
547508
(89)
(89)
502240
502240
(82)
(82)
2007
2007
All India
All India
(Ha)
(Ha)
North
North
East India
East India
South
South
India
India
Kerala
Kerala
Year
Year
TEA PLANTATIONS
TEA PLANTATIONS
RUBBER PLANTATIONS
RUBBER PLANTATIONS
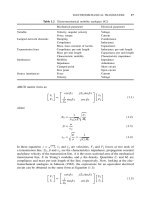
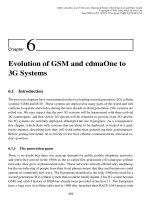
III. Growth of Tea plantations: India vs others, 2007
III. Growth of Tea plantations: India vs others, 2007
Tea area harvested
Tea area harvested
Tea production
Tea production
(000 ha)
(000 ha)
(% share)
(% share)
(000 tons)
(000 tons)
% share
% share
1
1
China
China
1117.50
1117.50
41.21
41.21
1049.50
1049.50
28.83
28.83
939
939
2
2
India
India
490.00
490.00
18.07
18.07
892.73
892.73
24.52
24.52
1822
1822
3
3
Sri Lanka
Sri Lanka
212.72
212.72
7.84
7.84
310.80
310.80
8.54
8.54
1461
1461
4
4
Kenya
Kenya
147.08
147.08
5.42
5.42
310.58
310.58
8.53
8.53
2112
2112
5
5
Viet Nam
Viet Nam
122.70
122.70
4.53
4.53
142.30
142.30
3.91
3.91
1160
1160
6
6
Indonesia
Indonesia
116.20
116.20
4.29
4.29
171.41
171.41
4.71
4.71
1475
1475
7
7
Turkey
Turkey
77.00
77.00
2.84
2.84
204.60
204.60
5.62
5.62
2657
2657
8
8
Bangladesh
Bangladesh
53.24
53.24
1.96
1.96
57.58
57.58
1.58
1.58
1082
1082
9
9
Japan
Japan
48.50
48.50
1.79
1.79
91.80
91.80
2.52
2.52
1893
1893
10
10
Argentina
Argentina
36.34
36.34
1.34
1.34
67.87
67.87
1.86
1.86
1868
1868
Sub total
Sub total
2421.27
2421.27
89.29
89.29
3299.17
3299.17
90.63
90.63
1647
1647
World
World
2711.58
2711.58
100.00
100.00
3640.19
3640.19
100.00
100.00
1343
1343
Productivity
Productivity
(Kg/ha)
(Kg/ha)
No
No
Country
Country
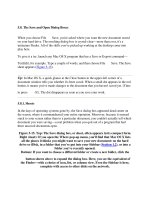
III. Growth of rubber plantations: India vs others, 2007
III. Growth of rubber plantations: India vs others, 2007
Rubber area harvested
Rubber area harvested
Rubber production
Rubber production
('000 ha)
('000 ha)
% share
% share
(000 Tons)
(000 Tons)
% share
% share
1
1
Indonesia
Indonesia
2660.00
2660.00
32.21
32.21
2350.00
2350.00
23.69
23.69
883
883
2
2
Thailand
Thailand
1743.51
1743.51
21.11
21.11
3156.96
3156.96
31.83
31.83
1811
1811
3
3
Malaysia
Malaysia
1237.00
1237.00
14.98
14.98
1283.60
1283.60
12.94
12.94
1038
1038
4
4
India
India
450.00
450.00
5.45
5.45
831.00
831.00
8.38
8.38
1847
1847
5
5
China
China
470.00
470.00
5.69
5.69
538.00
538.00
5.42
5.42
1145
1145
6
6
Viet Nam
Viet Nam
511.90
511.90
6.20
6.20
546.10
546.10
5.51
5.51
1067
1067
7
7
Nigeria
Nigeria
339.50
339.50
4.11
4.11
142.50
142.50
1.44
1.44
420
420
8
8
Liberia
Liberia
123.00
123.00
1.49
1.49
115.00
115.00
1.16
1.16
935
935
9
9
Sri Lanka
Sri Lanka
116.47
116.47
1.41
1.41
109.14
109.14
1.10
1.10
937
937
10
10
Brazil
Brazil
102.40
102.40
1.24
1.24
103.71
103.71
1.05
1.05
1013
1013
Sub total
Sub total
7753.78
7753.78
93.88
93.88
9176.01
9176.01
92.51
92.51
1109
1109
World
World
8259.00
8259.00
100.00
100.00
9918.74
9918.74
100.00
100.00
1201
1201
Productivity
Productivity
(Kg./ha)
(Kg./ha)
No
No
Country
Country
Trends in tea plantation sector
Trends in tea plantation sector
-
-
India
India
vs
vs
others
others
Year
Year
China
China
India
India
Sri
Sri
Lanka
Lanka
Kenya
Kenya
Indon
Indon
esia
esia
Five
Five
count
count
ries
ries
(
(
‘
‘
000
000
ha
ha
)
)
Tea
Tea
harvested
harvested
area
area
(%
(%
share
share
)
)
1961
1961
26
26
24.2
24.2
17.4
17.4
1.3
1.3
7.8
7.8
76.8
76.8
1366.13
1366.13
2006
2006
41.2
41.2
18.1
18.1
7.8
7.8
5.4
5.4
4.3
4.3
76.8
76.8
2711.58
2711.58
% Change
% Change
58.5
58.5
-
-
25.2
25.2
-
-
55.2
55.2
315.4
315.4
-
-
44.9
44.9
0
0
98.5
98.5
Tea production (% share/
Tea production (% share/
‘
‘
000 tons)
000 tons)
1961
1961
9.9
9.9
36
36
21
21
1.3
1.3
7.8
7.8
76
76
.
.
0
0
983.79
983.79
2006
2006
28.8
28.8
24.5
24.5
8.5
8.5
8.5
8.5
4.71
4.71
75.1
75.1
3640.19
3640.19
% Change
% Change
191.2
191.2
-
-
31.9
31.9
-
-
59.3
59.3
556.2
556.2
-
-
39.6
39.6
-
-
1.1
1.1
270
270
Tea
Tea
productivity
productivity
(
(
Kg
Kg
.
.
/
/
ha
ha
)
)
1961
1961
273
273
1070
1070
869
869
712
712
721
721
0
0
720
720
2006
2006
939
939
1822
1822
1461
1461
2112
2112
1475
1475
0
0
1343
1343
Increase
Increase
(
(
times
times
)
)
3.44
3.44
1.7
1.7
1.68
1.68
2.97
2.97
2.05
2.05
0
0
1.87
1.87
Trends in rubber plantation sector: India
Trends in rubber plantation sector: India
vs
vs
others
others
Year
Year
Indonesia
Indonesia
Thailand
Thailand
Malaysia
Malaysia
India
India
China
China
Sri Lanka
Sri Lanka
World
World
Rubber harvested area (
Rubber harvested area (
‘
‘
000 ha)
000 ha)
1961
1961
34.9
34.9
10.3
10.3
33.5
33.5
1.2
1.2
Na
Na
5.5
5.5
3880
3880
2006
2006
32.2
32.2
21.1
21.1
15
15
5.5
5.5
5.7
5.7
1.4
1.4
8259
8259
% change
% change
-
-
7.7
7.7
104.8
104.8
-
-
55.2
55.2
358.3
358.3
0.0
0.0
-
-
74.5
74.5
112.8
112.8
Rubber Production (
Rubber Production (
‘
‘
000 Tonnes)
000 Tonnes)
1961
1961
32.7
32.7
8.8
8.8
37.3
37.3
1.3
1.3
0.2
0.2
4.6
4.6
2121
2121
2006
2006
23.7
23.7
31.8
31.8
12.9
12.9
8.4
8.4
5.4
5.4
1.1
1.1
9919
9919
% change
% change
-
-
27.52
27.52
261.36
261.36
-
-
65.42
65.42
546.15
546.15
2600.0
2600.0
-
-
76.09
76.09
367.66
367.66
Rubber productivity (kg./ha)
Rubber productivity (kg./ha)
1961
1961
512
512
465
465
607
607
600
600
Na
Na
454
454
546
546
2006
2006
883
883
1811
1811
1038
1038
1847
1847
1145
1145
937
937
1201
1201
Increase
Increase
(times)
(times)
1.72
1.72
3.89
3.89
1.71
1.71
3.08
3.08
2.06
2.06
2.2
2.2
Trends in tea exports: India vs others
Trends in tea exports: India vs others
Year
Year
Sri
Sri
Lanka
Lanka
India
India
China
China
Kenya
Kenya
Indonesia
Indonesia
Five
Five
countries
countries
(% share)
(% share)
World
World
(Million US $)
(Million US $)
1961
1961
34.3
34.3
38.0
38.0
6.0
6.0
1.8
1.8
3.8
3.8
83.8
83.8
682.75
682.75
1975
1975
26.8
26.8
28.4
28.4
7.9
7.9
6.2
6.2
5.0
5.0
74.3
74.3
1032.40
1032.40
1985
1985
18.6
18.6
23.3
23.3
14.4
14.4
10.5
10.5
6.3
6.3
73.2
73.2
2365.56
2365.56
1996
1996
23.9
23.9
12.4
12.4
15.2
15.2
17.4
17.4
4.9
4.9
73.8
73.8
2281.50
2281.50
2000
2000
24.3
24.3
15.4
15.4
13.9
13.9
16.4
16.4
4.0
4.0
74.0
74.0
2810.16
2810.16
2004
2004
23.9
23.9
12.3
12.3
15.2
15.2
15.1
15.1
3.8
3.8
70.3
70.3
3064.79
3064.79
Despite a significant decline, India continues to be a major pla
Despite a significant decline, India continues to be a major pla
yer in the global tea
yer in the global tea
sector in terms of contributions to area, production and exports
sector in terms of contributions to area, production and exports
of tea, though it
of tea, though it
has been losing its relative position in recent times
has been losing its relative position in recent times
Emergence of China and Kenya and the continued presence of Sri L
Emergence of China and Kenya and the continued presence of Sri L
anka may have
anka may have
significant impact on India
significant impact on India
’
’
s trade performance in the emerging scenario
s trade performance in the emerging scenario
Structure of Tea Plantations in India
Structure of Tea Plantations in India
Structural features
Structural features
2000
2000
2001
2001
2002
2002
2003
2003
2004
2004
2005
2005
2006
2006
1. Share of small growers (
1. Share of small growers (
upto
upto
10.12
10.12
ha) in total no. of plantations (%)
ha) in total no. of plantations (%)
98.6
98.6
98.6
98.6
98.7
98.7
98.7
98.7
98.7
98.7
98.8
98.8
98.8
98.8
2. Number of Tea plantations
2. Number of Tea plantations
including big plantations ('000 nos)
including big plantations ('000 nos)
112.01
112.01
115.26
115.26
127.8
127.8
129.03
129.03
129.03
129.03
140.71
140.71
143.22
143.22
3. Share of small planters in total tea
3. Share of small planters in total tea
planted area (%)
planted area (%)
16.96
16.96
19.88
19.88
20.58
20.58
21.02
21.02
21.25
21.25
25.68
25.68
27.13
27.13
4. Total Tea planted area ('000 ha)
4. Total Tea planted area ('000 ha)
490.2
490.2
509.81
509.81
515.83
515.83
519.6
519.6
521.4
521.4
556.81
556.81
568
568
5. Share of small Planters in total tea
5. Share of small Planters in total tea
production
production
14.31
14.31
19.16
19.16
21.24
21.24
20.85
20.85
20.57
20.57
19.47
19.47
19.21
19.21
6. Total Tea production ('000 Tonnes)
6. Total Tea production ('000 Tonnes)
935.94
935.94
853.92
853.92
838.47
838.47
878.13
878.13
892.97
892.97
945.97
945.97
981.81
981.81
Trends in growth of plantation sectors
Trends in growth of plantation sectors
•
•
India continues to be a major player in the global tea sector in
India continues to be a major player in the global tea sector in
terms of contributions to
terms of contributions to
area, production and exports of tea, though it has been losing i
area, production and exports of tea, though it has been losing i
ts competitive edge in
ts competitive edge in
recent times.
recent times.
•
•
It also reveals that the dominance of Sri Lanka and emergence of
It also reveals that the dominance of Sri Lanka and emergence of
China and Kenya
China and Kenya
would have significant impact on India
would have significant impact on India
’
’
s performance in the global tea industry.
s performance in the global tea industry.
•
•
A drop in tea prices lead to serious repercussions on the produc
A drop in tea prices lead to serious repercussions on the produc
tion sector as evident
tion sector as evident
from the crisis in recent years
from the crisis in recent years
•
•
India has emerged as a dominant player in rubber with fourth pos
India has emerged as a dominant player in rubber with fourth pos
ition in production
ition in production
and first in productivity (impact of technology)
and first in productivity (impact of technology)
•
•
But, unlike Thailand and Malaysia; like China, it continues to b
But, unlike Thailand and Malaysia; like China, it continues to b
e a net importer to feed
e a net importer to feed
the fast growing automotive sector
the fast growing automotive sector
•
•
Rubber prices have been highly volatile and a drop in prices aff
Rubber prices have been highly volatile and a drop in prices aff
ects millions of small
ects millions of small
producers and their livelihoods
producers and their livelihoods
IV. Trade reforms impacting the crisis
IV. Trade reforms impacting the crisis
¾
¾
Tea crisis began in the late 1990s Many estates were closed do
Tea crisis began in the late 1990s Many estates were closed do
wn in Kerala
wn in Kerala
and West Bengal
and West Bengal
¾
¾
The immediate cause of the crisis in the plantation sector has b
The immediate cause of the crisis in the plantation sector has b
een the
een the
downfall of the international market prices of plantation produc
downfall of the international market prices of plantation produc
ts
ts
¾
¾
The trends reveal that India is losing its competitive position
The trends reveal that India is losing its competitive position
to producers
to producers
such as Indonesia, Kenya, Sri Lanka and China
such as Indonesia, Kenya, Sri Lanka and China
¾
¾
The import of tea from Sri Lanka under ISFTA and from Kenya and
The import of tea from Sri Lanka under ISFTA and from Kenya and
other
other
destinations by the EOUs has been creating further pressure on I
destinations by the EOUs has been creating further pressure on I
ndia
ndia
’
’
s
s
economy this had also resulted in the decline of tea auction p
economy this had also resulted in the decline of tea auction p
rices in India
rices in India
¾
¾
India may stand to lose further, as the tariff rates for tea and
India may stand to lose further, as the tariff rates for tea and
rubber are
rubber are
higher than that of its counterparts
higher than that of its counterparts
Crisis and corporate responses
Crisis and corporate responses
¾
¾
Increase in abandoned plantations in Kerala as the prevailing pl
Increase in abandoned plantations in Kerala as the prevailing pl
antation
antation
labour laws does not permit a closure
labour laws does not permit a closure
…
…
¾
¾
Lowering or stagnation in wages
Lowering or stagnation in wages
¾
¾
Non
Non
-
-
provision of bonus; increase in workloads
provision of bonus; increase in workloads
-
-
a hike in the minimum
a hike in the minimum
quantity of tea leaves to be collected and increase in tapping t
quantity of tea leaves to be collected and increase in tapping t
ask (no of
ask (no of
rubber trees to be tapped in rubber)
rubber trees to be tapped in rubber)
¾
¾
Curtailment of non
Curtailment of non
-
-
wage or extra
wage or extra
-
-
wage benefits and incentives; non
wage benefits and incentives; non
-
-
compliance of provisions of welfare measures as provided by the
compliance of provisions of welfare measures as provided by the
PL Act,
PL Act,
1951
1951
¾
¾
Non
Non
-
-
functioning/ closure of cresche, health centres; non
functioning/ closure of cresche, health centres; non
-
-
maintenance of
maintenance of
labour lines
labour lines
Crisis and employment decline
Crisis and employment decline
Tea Plantations (
Tea Plantations (
‘
‘
000 nos)
000 nos)
Rubber Plantations (
Rubber Plantations (
‘
‘
000 nos)
000 nos)
Avg. daily
Avg. daily
employment
employment
-
-
Total
Total
Share of
Share of
women
women
(%)
(%)
Avg. daily
Avg. daily
employment
employment
-
-
Total
Total
Share of
Share of
women (%)
women (%)
1990
1990
1024.98
1024.98
51.72
51.72
282.67
282.67
38.08
38.08
1996
1996
1012.7
1012.7
51.52
51.52
328.9
328.9
39.06
39.06
2000
2000
903.02
903.02
50.05
50.05
347.7
347.7
40.37
40.37
2003
2003
615.2
615.2
53.61
53.61
372.77
372.77
42.17
42.17
TGR (1990
TGR (1990
-
-
2003)
2003)
-
-
48.34
48.34
3.65
3.65
5.95
5.95
10.74
10.74
Year
Year
The aggregate level increase in employment as reported in rubber
The aggregate level increase in employment as reported in rubber
to be related with the
to be related with the
corresponding rise in area under rubber, especially that under t
corresponding rise in area under rubber, especially that under t
he smallholder sector
he smallholder sector
Disaggregate level analysis of employment growth in rubber in th
Disaggregate level analysis of employment growth in rubber in th
e organised plantation
e organised plantation
sector (comprising corporate, private and public sector plantati
sector (comprising corporate, private and public sector plantati
ons) reveals a different story
ons) reveals a different story
of drastic reduction in employment
of drastic reduction in employment
Employment decline in organised rubber plantations
Employment decline in organised rubber plantations
Total employment ('000 nos)
Total employment ('000 nos)
Tapping employment ('000 nos)
Tapping employment ('000 nos)
All work
All work
-
-
Total
Total
Kerala
Kerala
’
’
s share (%)
s share (%)
Tapping
Tapping
-
-
Total
Total
Kerala
Kerala
’
’
s share (%)
s share (%)
1990
1990
1738
1738
67.3
67.3
970
970
59.9
59.9
2000
2000
1308
1308
62.1
62.1
759
759
56
56
2002
2002
1175
1175
62.8
62.8
687
687
58.9
58.9
2006
2006
953
953
66.0
66.0
603
603
60.1
60.1
% Change
% Change
-
-
45.2
45.2
-
-
1.93
1.93
-
-
37.8
37.8
0.4
0.4
Year
Year
Note: Research based on 40 rubber plantations owned by corporate
Note: Research based on 40 rubber plantations owned by corporate
, private and public sector entities.
, private and public sector entities.
Performance of corporate plantations (HML ltd.)
Performance of corporate plantations (HML ltd.)
Financial indicators (Rs. million)
Financial indicators (Rs. million)
Revenue from
Revenue from
Total
Total
Expenditure
Expenditure
Staff
Staff
expenses
expenses
Total
Total
Revenue
Revenue
Profit
Profit
after
after
tax
tax
Tea (%)
Tea (%)
Rubber
Rubber
(%)
(%)
2001
2001
1065
1065
567
567
1068
1068
108
108
51.36
51.36
22.03
22.03
53.04
53.04
2005
2005
1198
1198
605
605
1460
1460
484
484
61.64
61.64
52.53
52.53
41.45
41.45
2007
2007
1840
1840
657
657
2105
2105
141
141
55.01
55.01
52.25
52.25
31.22
31.22
(%)
(%)
change
change
72.9
72.9
16
16
97
97
30.6
30.6
7.1
7.1
137.2
137.2
-
-
41.1
41.1
Staff exp.
Staff exp.
as % of
as % of
Revenue
Revenue
Year
Year
Note: HML – Harrison Malayalam Plantations, a largest tea & rubber company based in
Kerala
Corporate responses: Case of Tata Tea Company,
Corporate responses: Case of Tata Tea Company,
1995
1995
-
-
96 to 2006
96 to 2006
-
-
07
07
Financial indicators (Rs. million)
Financial indicators (Rs. million)
Share in Total income (%)
Share in Total income (%)
Total
Total
income
income
Profit
Profit
after
after
taxes
taxes
Employee
Employee
payment
payment
Employee
Employee
payment
payment
Profit after
Profit after
taxes
taxes
1995
1995
-
-
96
96
5433
5433
461
461
1331
1331
58387
58387
24.5
24.5
8.48
8.48
1999
1999
-
-
00
00
9745
9745
1246
1246
2095
2095
59740
59740
21.5
21.5
12.78
12.78
2005
2005
-
-
06
06
10401
10401
1869
1869
1763
1763
34596
34596
16.95
16.95
17.97
17.97
2006
2006
-
-
07
07
11461
11461
3065
3065
1791
1791
34506
34506
15.63
15.63
26.74
26.74
% change
% change
110.95
110.95
564.86
564.86
34.56
34.56
-
-
40.9
40.9
-
-
36.2
36.2
215.33
215.33
No of
No of
employees
employees
Year
Year
Internal contradictions: plantation sectors
Internal contradictions: plantation sectors
¾
¾
Production sector dominated by small producers (98%) with only 2
Production sector dominated by small producers (98%) with only 2
7 % share in area
7 % share in area
19% share in production (sharp contrast to rubber: SH
19% share in production (sharp contrast to rubber
: SH
-
-
88%, estates
88%, estates
-
-
12%)
12%)
¾
¾
Auction driven pricing system is beset with varied problems
Auction driven pricing system is beset with varied problems
-
-
it reflects a rigid
it reflects a rigid
marketing system for the Indian small tea producers who have no
marketing system for the Indian small tea producers who have no
stake in the entire
stake in the entire
process, but to accept the auction set price (rubber an exceptio
process, but to accept the auction set price (rubber an exceptio
n with high FGP
n with high FGP
realisation).
realisation).
¾
¾
Quality of Indian tea is also considered as an important factor
Quality of Indian tea is also considered as an important factor
in the international
in the international
market, as the world import demand is gradually shifting from
market, as the world import demand is gradually shifting from
CTCs
CTCs
to orthodox and
to orthodox and
other types of specialty teas
other types of specialty teas
-
-
green tea. India has not kept pace with this trend.
green tea. India has not kept pace with this trend.
¾
¾
Thus, India has been lagging behind Kenya and Sri Lanka (and Chi
Thus, India has been lagging behind Kenya and Sri Lanka (and Chi
na too) in terms of
na too) in terms of
the quality upgradation that has been taking place in the global
the quality upgradation that has been taking place in the global
tea sector
tea sector
–
–
almost
almost
68% is in the form of CTC which mostly caters to the domestic ma
68% is in the form of CTC which mostly caters to the domestic ma
rket
rket
¾
¾
India
India
’
’
s production costs are the highest among the major exporters. Re
s production costs are the highest among the major exporters. Re
lative costs
lative costs
per kg were reported as $1.60
per kg were reported as $1.60
-
-
1.62 in India vis $1.16 in Sri Lanka, $1.40 in Kenya and
1.62 in India vis $1.16 in Sri Lanka, $1.40 in Kenya and
below 90 cents in Vietnam and Indonesia (rubber is also not an e
below 90 cents in Vietnam and Indonesia (rubber is also not an e
xception)
xception)
New Regionalism and commodity trading
New Regionalism and commodity trading
¾
¾
Explosive growth in the number of RTAs and PTAs and its impacts
Explosive growth in the number of RTAs and PTAs and its impacts
on the
on the
crop producing regions, including India
crop producing regions, including India
’
’
s plantation sectors
s plantation sectors
¾
¾
These TAs assume more diversified scenarios of regional integrat
These TAs assume more diversified scenarios of regional integrat
ion and
ion and
delve into issues much deeper than the trade liberalisation, per
delve into issues much deeper than the trade liberalisation, per
se
se
¾
¾
Specific to plantation products, the most decisive are the Indo
Specific to plantation products, the most decisive are the Indo
-
-
Sri Lanka;
Sri Lanka;
SAFTA and ASEAN; Pan Asian FTA similar to NAFTA or EU
SAFTA and ASEAN; Pan Asian FTA similar to NAFTA or EU
¾
¾
South India, particularly, Kerala to face larger consequences as
South India, particularly, Kerala to face larger consequences as
trade related
trade related
crops, including tea and rubber, occupy 80% of TCA
crops, including tea and rubber, occupy 80% of TCA