Deborah hughes hallett, andrew m gleason, william g mccallum, david o lomen, david lovelock, jeff tecosky feldman, thomas w tucker, daniel e flath, joseph thrash, karen r rhea, andrew p
Bạn đang xem bản rút gọn của tài liệu. Xem và tải ngay bản đầy đủ của tài liệu tại đây (21.78 MB, 739 trang )
www.pdfgrip.com
www.pdfgrip.com
❇
✄
☞
✒
Triangle
❭
✄ ✙
☞ ✜
✒
❇
✂
✁ ✬☎✄
✙
✌
✠
✒
Sphere
❇
❨
✄ ☞ of Circle
Sector
✡
✄
☞
✄
in radians
❜
✡
✄
✄ in radians
❜
✒
☛
✒
✡
❱
✒
☞
✆
✝
❡
✐❫❜
❇
✐❫❜
◗
✐❫❜
✡
✆
✍❨
✒
✒
✟
❞
✞
Circle ☞
✄
✌ Cone
✒
☞
❭
✌ Cylinder
✒
☞
✐❫❜
✡
☞
❭
❨ ✐❫❜
✐❫❜
✡ ✝
✡
✎
✝ ✎
✟
✟
✏
✏
✝
✡
Trigonometric Functions
✂
✬☎✄
✒
❜
✑✓✒ ✄
❜
✒
✞
✚
✘
✁
✂
✬☎✄
✑✓✒ ✄
☞
✂✬ ✄ ✒
✒
☞
✑✓✒ ✄
✚
✁
✒
✔✖✕ ✗
✬ ✄
✔✖✕ ✗
✬ ✄
✛ ✶✢✜ ✷✤✣
✙ ✎
✞
✝
✶
❈❇
✑✓✒
✷
✆
✞
✂✬
✑✓✒
✏
❈❇
✂✬
❉❋✡
❙
❉❋✡
❙
✷
✷✹✸
✷✹✸
✧
❝
✂✁
✚
✂✁✘✓
✵
✩✫✼✪ ✻✛✶
✵
★✧
✑✓✒
❉
❉
❙
❉
✧
❝
✰ ✡
☞
✴✳
✁
✁
✳
☞
★
☞
✞
★
✵ ✵
✚
✞
☞
✶
★✧
✵
✰ ✡
✰✲❃✱ ✻✽✶
✷
✬✮✭✯✣✩ ✶
✷✹✸
✶
The Binomial Theorem
✓
✄
✫✳ ✒ ✁✴✳
✁✴✳ ★
✞
✵ ✵
✚ ✵
✚
✰✷✶ ◗
✓
✄
✞❲✡ ✳ ✒
✁ ✳ ✓
✁ ✳ ★
✞
✵ ✵
✵
✚
✰✷✶ ◗
✞❲✡
✒
◗
✒
✑✓✒ ❇ ✂ ✬
✑✓✒ ❇ ✑✓✒ ❉✦✥ ✂ ✬ ❇ ✂ ✬
❇
✂ ❇
◗
☞ ✬ ✑✓✒
☞
✑✓✒ ❇✗✓ ✰✲✒ ✰ ✓ ◗ ✂ ✬ ❇
❇
✰
✷
✵
✒
◗ ❇✹✡
◗ ❇✹✡
✂✬
✒
✓
✓
❝
✰ ✡❳
✵
✰✷✶ ◗ ✹
✶✸
✓
❳
✡
✰
✵ ✵
✵
✰✷✶ ◗ ✶✹✸
◗ ✡
✓
✓
◗ ✡
✴✳
★ ❨ ✞ ❨
✳
★ ❨❁✞✠❨
✁
✁
✶
✧
✧
✄
✻✳
★
✳
★
✚
✶✺✶✺✶
✚
✵
✁❬✞
✚
✶✺✶✺✶
❙
✵
✁❬✞
✻✳
✞
✚
✄
✥
✞
✳
www.pdfgrip.com
We dedicate this book to Andrew M. Gleason.
His brilliance and the extraordinary kindness and
dignity with which he treated others made an
enormous difference to us, and to many, many people.
Andy brought out the best in everyone.
Deb Hughes Hallett
for the Calculus Consortium
www.pdfgrip.com
CALCULUS
Fifth Edition
Produced by the Calculus Consortium and initially funded by a National Science Foundation Grant.
Deborah Hughes-Hallett
University of Arizona
William G. McCallum
University of Arizona
Andrew M. Gleason
Brad G. Osgood
Harvard University
Stanford University
Daniel E. Flath
Douglas Quinney
Macalester College
University of Keele
Patti Frazer Lock
Karen Rhea
St. Lawrence University
University of Michigan
David O. Lomen
University of Arizona
Jeff Tecosky-Feldman
Haverford College
David Lovelock
University of Arizona
Thomas W. Tucker
Colgate University
with the assistance of
Otto K. Bretscher
Sheldon P. Gordon
Colby College
Andrew Pasquale
SUNY at Farmingdale
Joe B. Thrash
Chelmsford High School
University of Southern Mississippi
Coordinated by
Elliot J. Marks
John Wiley & Sons, Inc.
www.pdfgrip.com
PUBLISHER
Laurie Rosatone
ACQUISITIONS EDITOR
ASSOCIATE EDITOR
David Dietz
Shannon Corliss
EDITORIAL ASSISTANT
DEVELOPMENTAL EDITOR
Pamela Lashbrook
Anne Scanlan-Rohrer/Two Ravens Editorial
MARKETING MANAGER
Jaclyn Elkins
MEDIA EDITOR
SENIOR PRODUCTION EDITOR
Melissa Edwards
Ken Santor
COVER DESIGNER
COVER AND CHAPTER OPENING PHOTO
Madelyn Lesure
c Patrick Zephyr/Patrick Zephyr Nature Photography
Problems from Calculus: The Analysis of Functions, by Peter D. Taylor (Toronto: Wall & Emerson, Inc., 1992). Reprinted with permission of
the publisher.
This book was set in Times Roman by the Consortium using TeX, Mathematica, and the package AsTeX, which was written by Alex Kasman.
It was printed and bound by R.R. Donnelley / Jefferson City. The cover was printed by R.R. Donnelley.
This book is printed on acid-free paper.
The paper in this book was manufactured by a mill whose forest management programs include sustained yield harvesting of its timberlands.
Sustained yield harvesting principles ensure that the numbers of trees cut each year does not exceed the amount of new growth.
✁
Copyright c 2009 John Wiley & Sons, Inc. All rights reserved.
No part of this publication may be reproduced, stored in a retrieval system or transmitted
in any form or by any means, electronic, mechanical, photocopying, recording, scanning
or otherwise, except as permitted under Sections 107 or 108 of the 1976 United States
Copyright Act, without either the prior written permission of the Publisher, or
authorization through payment of the appropriate per-copy fee to the Copyright
Clearance Center, 222 Rosewood Drive, Danvers, MA 01923, (508) 750-8400, fax
(508) 750-4470. Requests to the Publisher for permission should be addressed to the
Permissions Department, John Wiley & Sons, Inc., 111 River Street, Hoboken, NJ
07030, (201) 748-6011, fax (201) 748-6008, E-Mail:
This material is based upon work supported by the National
Science Foundation under Grant No. DUE-9352905. Opinions
expressed are those of the authors and not necessarily those
of the Foundation.
ISBN 978-0470-08915-6
Printed in the United States of America
10 9 8 7 6 5 4 3 2 1
www.pdfgrip.com
PREFACE
Calculus is one of the greatest achievements of the human intellect. Inspired by problems in astronomy,
Newton and Leibniz developed the ideas of calculus 300 years ago. Since then, each century has demonstrated
the power of calculus to illuminate questions in mathematics, the physical sciences, engineering, and the
social and biological sciences.
Calculus has been so successful because of its extraordinary power to reduce complicated problems to
simple rules and procedures. Therein lies the danger in teaching calculus: it is possible to teach the subject
as nothing but the rules and procedures—thereby losing sight of both the mathematics and of its practical
value. This edition of Calculus continues our effort to promote courses in which understanding reinforces
computation.
Origin of the Text: A Community of Instructors
From the beginning, this textbook was based on community: in a narrow sense, as a consortium of authors,
but also in a broader sense, as an enormous User’s Group. We have always sought out voices from the
whole spectrum of calculus users and teachers: research universities, four-year colleges, community colleges,
secondary schools, client disciplines. This inclusiveness can be as deliberate as conferences and workshops,
from the annual ones we held in the 1990s, to the most recent one in San Antonio. It can also be as unplanned
as as an email to an author; many individuals involved with the consortium began their association with little
more than an inquiry. It is the collective wisdom—suggestions, critiques, and visions—of the community of
calculus instructors that forms the basis of this Fifth Edition.
A Balance Between Skills and Concepts
The First Edition of our text struck a new balance between concepts and skills. As instructors ourselves, we
know that the balance we choose depends on the students we have: sometimes a focus on conceptual understanding is best; sometimes more drill is appropriate. The flexibility of the Fifth Edition allows instructors to
tailor the course to their students.
Since 1992, we have continued to find new ways to help students learn. Under our approach, which we
called the “Rule of Four,” ideas are presented graphically, numerically, symbolically, and verbally, thereby
encouraging students with a variety of learning styles to expand their knowledge. Our problems probe student
understanding in areas often taken for granted. The influence of these problems, praised for their creativity
and variety, has extended far beyond the users of our textbook.
Mathematical Thinking: A Balance Between Theory and Modeling
The first stage in the development of mathematical thinking is the acquisition of a clear intuitive picture of the
central ideas. In the next stage, the student learns to reason with the intuitive ideas and explain the reasoning
clearly in plain English. After this foundation has been laid, there is a choice of direction. All students
benefit from both theory and modeling, but the balance may differ for different groups. Some students, such
as mathematics majors, may prefer more theory, while others, such as science and engineering majors, may
prefer more modeling.
Mathematical Skills: A Balance Between Symbolic Manipulation and Technology
To use calculus effectively, students need skill in both symbolic manipulation and the use of technology. The
balance between them may vary, depending on the needs of the students and the wishes of the instructor. The
book is adaptable to many different combinations.
The book does not require any specific software or technology. It has been used with graphing calculators, graphing software, and computer algebra systems. Any technology with the ability to graph functions
and perform numerical integration will suffice. Students are expected to use their own judgment to determine
where technology is useful.
v
www.pdfgrip.com
vi
Preface
The Fifth Edition: Expanded Options
To enable all instructors to create the balance they need, many problems have been added to the Fifth Edition.
In consultation with faculty teaching in a variety of settings—large lectures, small classes, with or without
technology—we have:
Updated Data and Models. For example, Section 11.7 now introduces the current debate on Peak Oil
Production, underscoring the importance of mathematics in understanding the world’s economic and
social problems.
Added new Projects
Added new Drill Exercises to build student confidence.
Added new Conceptual Problems to expand student understanding.
Provided more Online Problems in WileyPLUS or WeBWorK, for example. Many problems are randomized, providing students with expanded opportunities for practice with immediate feedback.
Created ConcepTests to promote active learning in the classroom. These can be used with or without
clickers (personal response systems), and have been shown to dramatically improve student learning.
Available in a book or on the web at www.wiley.com/college/hugheshallett.
Designed Class Worksheets to support individual or group class-work. Samples are available in the
Instructor’s Manual, and all are on the web at www.wiley.com/college/hugheshallett.
Content
This content represents our vision of how calculus can be taught. It is flexible enough to accommodate
individual course needs and requirements. Topics can easily be added or deleted, or the order changed.
Changes to the text in the Fifth Edition are in italics. In all chapters, many new problems were added
and others were updated.
Chapter 1: A Library of Functions
This chapter introduces all the elementary functions to be used in the book. Although the functions are
probably familiar, the graphical, numerical, verbal, and modeling approach to them may be new. We introduce
exponential functions at the earliest possible stage, since they are fundamental to the understanding of realworld processes. The chapter concludes with a section on limits, allowing for a discussion of continuity at
a point and on an interval. The section on limits is flexible enough to allow for a brief introduction before
derivatives or for a more extensive treatment.
Chapter 2: Key Concept: The Derivative
The purpose of this chapter is to give the student a practical understanding of the definition of the derivative and its interpretation as an instantaneous rate of change. The power rule is introduced; other rules are
introduced in Chapter 3.
Chapter 3: Short-Cuts to Differentiation
The derivatives of all the functions in Chapter 1 are introduced, as well as the rules for differentiating products, quotients, composite, inverse, hyperbolic, and implicitly defined functions.
Section 3.4 has been expanded to enourage an intuitive understanding of the chain rule as well as
computational fluency.
Chapter 4: Using the Derivative
The aim of this chapter is to enable the student to use the derivative in solving problems, including optimization, graphing, rates, parametric equations, and indeterminate forms. It is not necessary to cover all the
sections in this chapter.
www.pdfgrip.com
Preface
vii
This chapter has been reorganized to smooth the approach to optimization. Section 4.1 is on Critical
Points and Local Behavior, as in previous editions; Section 4.2 is now on Global Optimization (formerly
Section 4.3). Section 4.3 on Families of Functions (formerly Section 4.2) has been streamlined and many
introductory problems added. The inclusion of the logistic family allows for early experience with functions
underlying many important models—in particular, the model of peak oil production in Section 11.7. Section 4.4 on Optimization, Geometry, and Modeling (formerly Section 4.5), has been extensively rewritten to
improve clarity and provide students with more support. New examples have been included and the focus
on geometry amplified. Section 4.7 on L’Hopital’s rule has a new subsection on recognizing the form of a
limit. Section 4.8 on Parametric Equations can now be linked to the new Appendix D, allowing discussion of
velocity as vector.
Chapter 5: Key Concept: The Definite Integral
The purpose of this chapter is to give the student a practical understanding of the definite integral as a limit
of Riemann sums and to bring out the connection between the derivative and the definite integral in the
Fundamental Theorem of Calculus.
Chapter 6: Constructing Antiderivatives
This chapter focuses on going backward from a derivative to the original function, first graphically and
numerically, then analytically. It introduces the Second Fundamental Theorem of Calculus and the concept
of a differential equation.
Chapter 7: Integration
This chapter includes several techniques of integration, including substitution, parts, partial fractions, and
trigonometric substitutions; others are included in the table of integrals. There are discussions of numerical
methods and of improper integrals.
Chapter 8: Using the Definite Integral
This chapter emphasizes the idea of subdividing a quantity to produce Riemann sums which, in the limit,
yield a definite integral. It shows how the integral is used in geometry, physics, economics, and probability;
polar coordinates are introduced. It is not necessary to cover all the sections in this chapter.
Chapter 9: Sequences and Series
This chapter focuses on sequences, series of constants, and convergence. It includes the integral, ratio, comparison, limit comparison, and alternating series tests. It also introduces geometric series and general power
series, including their intervals of convergence.
Chapter 10: Approximating Functions
This chapter introduces Taylor Series and Fourier Series using the idea of approximating functions by simpler
functions.
Chapter 11: Differential Equations
This chapter introduces differential equations. The emphasis is on qualitative solutions, modeling, and interpretation.
Section 11.7 on Logistic Models (formerly on population models) has been rewritten around the thoughtprovoking predictions of peak oil production. This section encourages students to use the skills learned
earlier in the course to analyze a problem of global importance.
Appendices
There are appendices on roots, accuracy, and bounds; complex numbers; and Newton’s Method.
A new Appendix D introducing vectors in the plane has been added. This can be covered at any time, but
may be particularly useful in the conjunction with Section 4.8 on parametric equations.
www.pdfgrip.com
viii
Preface
Projects
There are new projects in Chapter 1: “Which Way is the Wind Blowing”; Chapter 5: “The Car and the
Truck”; Chapter 9: “Prednisone”; and Chapter 10: “The Shape of Planets.”
Choice of Paths: Lean or Expanded
For those who prefer the lean topic list of earlier editions, we have kept clear the main conceptual paths. For
example,
The Key Concept chapters on the derivative and the definite integral (Chapters 2 and 5) can be covered
at the outset of the course, right after Chapter 1.
✂✁☎✄
✂✁✝✆
Limits and Continuity (Sections
and
) can be covered in depth before the introduction of the
✁✟
✁
derivative (Sections ✞ and ✞ ✞ ), or after.
✡✠
Approximating Functions Using Series (Chapter ) can be covered before, or without, Chapter 9.
✁✝☞
✁✝✆
In Chapter 4 (Using the Derivative), instructors can select freely from Sections ☛ –☛ .
Chapter 8 (Using the Definite Integral) contains a wide range of applications. Instructors can select one
or two to do in detail.
Supplementary Materials and Additional Resources
Supplements for the instructor can be obtained by sending a request on your institutional letterhead to Mathematics Marketing Manager, John Wiley & Sons, Inc., 111 River Street, Hoboken, NJ 07030, or by contacting
your Wiley representative. The following supplementary materials are available for this edition:
Instructor’s Manual containing teaching tips, calculator programs, overhead transparency masters,
sample worksheets, and sample syllabi.
Computerized Test Bank, comprised of nearly 7,000 questions, mostly algorithmically-generated, which
allows for multiple versions of a single test or quiz.
Instructor’s Solution Manual with complete solutions to all problems.
Student Solution Manual with complete solutions to half the odd-numbered problems.
Student’s Study Guide with key ideas, additional worked examples with corresponding exercises, and
study skills.
Additional Material, elaborating specially marked points in the text, as well as automatically-graded
Web Quizzes for students and password-protected electronic versions of the instructor ancillaries, can
be found on the web at www.wiley.com/college/hugheshallett.
ConcepTests
ConcepTests, modeled on the pioneering work of Harvard physicist Eric Mazur, are questions designed
to promote active learning during class, particularly (but not exclusively) in large lectures. Our evaluation
data show students taught with ConcepTests outperformed students taught by traditional lecture methods
☞✎✍
✍
✄✌☞✎✍
✏✄✂✍
versus
on conceptual questions, and ✑
versus ✒✓☛
on computational problems. ConcepTests
arranged by section are available from your Wiley representative.
Faculty Resource Network
A peer-to-peer network of academic faculty dedicated to the effective use of technology in the classroom,
this group can help you apply innovative classroom techniques and implement specific software packages.
Visit www.facultyresourcenetwork.com or speak to your Wiley representative.
WileyPLUS
WileyPLUS, Wiley’s digital learning environment, is loaded with all of the supplements above, and also
features:
E-book, which is an exact version of the print text, but also features hyperlinks to questions, definitions,
and supplements for quicker and easier support.
www.pdfgrip.com
Preface
ix
Homework management tools, which easily enable the instructor to assign and automatically graded
questions, using a rich set of options and controls.
QuickStart pre-designed reading and homework assignments. Use them as-is or customize them to fit
the needs of your classroom.
Guided Online (GO) Exercises, which prompt students to build solutions step-by-step. Rather than simply grading an exercise answer as wrong, GO problems show students precisely where they are making
a mistake.
Animated applets, which can be used in class to present and explore key ideas graphically and dynamically—
especially useful for display of three-dimensional graphs in multivariable calculus.
Student Study Guide, providing key ideas, additional worked examples with corresponding exercises,
and study skills.
Algebra & Trigonometry Refresher quizzes, which provide students with an opportunity to brush-up on
material necessary to master Calculus, as well as to determine areas that require further review.
Graphing Calculator Manual, to help students get the most out of their graphing calculator, and to show
how they can apply the numerical and graphing functions of their calculators to their study of calculus.
AP Teacher’s Guide
The AP Guide, written by experienced AP teachers, provides day-by-day syllabi for AB and BC Calculus,
sample multiple choice questions, a listing of the past ✞✂✒ years of AP free-response questions by chapter of
the text, teaching tips, and labs to encourage student exploration of concepts.
Acknowledgements
First and foremost, we want to express our appreciation to the National Science Foundation for their faith
in our ability to produce a revitalized calculus curriculum and, in particular, to our program officers, Louise
Raphael, John Kenelly, John Bradley, and James Lightbourne. We also want to thank the members of our
Advisory Board, Benita Albert, Lida Barrett, Simon Bernau, Robert Davis, M. Lavinia DeConge-Watson,
John Dossey, Ron Douglas, Eli Fromm, William Haver, Seymour Parter, John Prados, and Stephen Rodi.
In addition, a host of other people around the country and abroad deserve our thanks for their contributions to shaping this edition. They include: Ed Alexander, Huriye Arikan, Ralph Baierlein, Don Barkauskas,
Ruth Baruth, Paul Blanchard, Lewis Blake, Melkana Brakalova, David Bressoud, Stephen Boyd, Morton
Brown, Lucille Buonocore, Rick Cangelosi, Jo Cannon, Ray Cannon, Marilyn Carlson, Nate Carlson, Phil
Cheifetz, C.K. Cheung, Scott Clark, Eric Connally, Caspar Curjel, Jailing Dai, Ann Davidian, Ehud de Shalit,
Dennis De Turck, Tom Dick, Srdjan Divac, Tevian Dray, Dorian Dumitrasen, Steven Dunbar, Jeff Edmunds,
John Eggers, Wade Ellis, Johann Engelbrecht, Brad Ernst, Bill Faris, Paul Feehan, Hermann Flaschka,
Nathaniel Flath, Sol Friedberg, Brendan Fry, Lynn Garner, Tom Gearhart, Chris Goff, Kris Green, Salim
Haădar, John Hagood, Gregory Hartman, Elizabeth Hentges, Jim Hurley, Rob Indik, Adrian Iovita, David
Jackson, Pallavi Jayawant, Sue Jensen, Millie Johnson, Jerry Johnson, Alex Kasman, Matthias Kawski, Mike
Klucznik, Donna Krawczyk, Ted Laetsch, Stephane Lafortune, Brigitte Lahme, Carl Leinbach, Carl Leinert,
John Leonard, David Levermore, Don Lewis, Jim Lewis, Assane Lo, Guadalupe Lozano, Bin Lu, Chris
Lucas, John Lucas, Dan Madden, Alex Mallozzi, Corinne Manogue, Lisa A. Mantini, Nancy Marcus, Kyle
Marshall, Eric Mazur, Abby McCallum, Dan McGee, Tom McMahon, Ansie Meiring, Dave Meredith, Emily
Merrill, Lang Moore, Jerry Morris, Alan Newell, Steve Olson, John Orr, Arnie Ostebee, Igor Padure, Howard
Penn, Amy Radunskaya, Wayne Raskind, Jeffrey Rauch, Janet Ray, Maria Robinson, Laurie Rosatone, Ann
Ryu, Ayse Sahin, Nataliya Sandler, Matthew Salomone, Ken Santor, Anne Scanlan-Rohrer, Ellen Schmierer,
Michael Sherman, Pat Shure, Scott Pilzer, Lynne Small, David Smith, Edward Soares, Ernie Solheid, Bob
Speiser, Misha Stepanov, Howard Stone, Steve Strogatz, “Suds” Sudholz, Al Taylor, Peter Taylor, Ralph
Teixeira, Ray Tenant, Dinesh Thakur, Sally Thomas, Alan Tucker, Jerry Uhl, Doug Ulmer, Ignatios Vakalis,
Bill V´elez, Joe Vignolini, Debra Wood, Aaron Wootton, Haokun Sam Xu, Deane Yang, Bruce Yoshiwara,
Kathy Yoshiwara, Lee Zia, and Paul Zorn.
Reports from the following reviewers were most helpful for the fifth edition:
www.pdfgrip.com
x
Preface
Lewis Blake, Patrice Conrath, Christopher Ennis, John Eggers, Paul DeLand, Dana Fine, Dave Folk,
Elizabeth Hodes, Richard Jenson, Emelie Kenney, Michael Kinter, Douglas Lapp, Glenn Ledder, Eric Marland, Cindy Moss, Michael Naylor, Genevra Neumann, Dennis Piontkowski, Robert Reed, Laurence Small,
Ed Soares, Diana Staats, Kurt Verdeber, and Deborah Yoklic.
Deborah Hughes-Hallett
Andrew M. Gleason
Patti Frazer Lock
David O. Lomen
Douglas Quinney
Karen R. Rhea
William G. McCallum
David Lovelock
Jeff Tecosky-Feldman
Daniel E. Flath
Brad G. Osgood
Thomas W. Tucker
To Students: How to Learn from this Book
This book may be different from other math textbooks that you have used, so it may be helpful to know about
some of the differences in advance. This book emphasizes at every stage the meaning (in practical, graphical
or numerical terms) of the symbols you are using. There is much less emphasis on “plug-and-chug” and using
formulas, and much more emphasis on the interpretation of these formulas than you may expect. You will
often be asked to explain your ideas in words or to explain an answer using graphs.
The book contains the main ideas of calculus in plain English. Your success in using this book will depend on
your reading, questioning, and thinking hard about the ideas presented. Although you may not have done this
with other books, you should plan on reading the text in detail, not just the worked examples.
There are very few examples in the text that are exactly like the homework problems. This means that you
can’t just look at a homework problem and search for a similar–looking “worked out” example. Success with
the homework will come by grappling with the ideas of calculus.
Many of the problems that we have included in the book are open-ended. This means that there may be more
than one approach and more than one solution, depending on your analysis. Many times, solving a problem
relies on common sense ideas that are not stated in the problem but which you will know from everyday life.
Some problems in this book assume that you have access to a graphing calculator or computer. There are many
situations where you may not be able to find an exact solution to a problem, but you can use a calculator or
computer to get a reasonable approximation.
This book attempts to give equal weight to four methods for describing functions: graphical (a picture), numerical (a table of values) algebraic (a formula), and verbal. Sometimes you may find it easier to translate a
problem given in one form into another. The best idea is to be flexible about your approach: if one way of
looking at a problem doesn’t work, try another.
Students using this book have found discussing these problems in small groups very helpful. There are a
great many problems which are not cut-and-dried; it can help to attack them with the other perspectives your
colleagues can provide. If group work is not feasible, see if your instructor can organize a discussion session
in which additional problems can be worked on.
You are probably wondering what you’ll get from the book. The answer is, if you put in a solid effort, you will
get a real understanding of one of the most important accomplishments of the millennium—calculus—as well
as a real sense of the power of mathematics in the age of technology.
www.pdfgrip.com
Table of Contents
1 A LIBRARY OF FUNCTIONS
1.1 FUNCTIONS AND CHANGE
1
2
1.2 EXPONENTIAL FUNCTIONS 10
1.3 NEW FUNCTIONS FROM OLD 17
1.4 LOGARITHMIC FUNCTIONS 24
1.5 TRIGONOMETRIC FUNCTIONS 30
1.6 POWERS, POLYNOMIALS, AND RATIONAL FUNCTIONS
1.7 INTRODUCTION TO CONTINUITY 47
1.8 LIMITS 51
REVIEW PROBLEMS 60
CHECK YOUR UNDERSTANDING
38
65
PROJECTS: MATCHING FUNCTIONS TO DATA, WHICH WAY IS THE WIND BLOWING?
2
67
KEY CONCEPT: THE DERIVATIVE
2.1 HOW DO WE MEASURE SPEED?
70
2.2 THE DERIVATIVE AT A POINT 76
2.3 THE DERIVATIVE FUNCTION 85
2.4 INTERPRETATIONS OF THE DERIVATIVE
2.5 THE SECOND DERIVATIVE
2.6 DIFFERENTIABILITY 104
REVIEW PROBLEMS 109
69
93
98
CHECK YOUR UNDERSTANDING 113
PROJECTS: HOURS OF DAYLIGHT AS A FUNCTION OF LATITUDE, US POPULATION
3 SHORT-CUTS TO DIFFERENTIATION
114
115
3.1 POWERS AND POLYNOMIALS 116
3.2 THE EXPONENTIAL FUNCTION 123
3.3 THE PRODUCT AND QUOTIENT RULES 127
3.4 THE CHAIN RULE 133
3.5 THE TRIGONOMETRIC FUNCTIONS 140
xi
www.pdfgrip.com
xii
Contents
3.6
3.7
3.8
3.9
3.10
THE CHAIN RULE AND INVERSE FUNCTIONS 145
IMPLICIT FUNCTIONS 151
HYPERBOLIC FUNCTIONS 154
LINEAR APPROXIMATION AND THE DERIVATIVE 158
THEOREMS ABOUT DIFFERENTIABLE FUNCTIONS 164
REVIEW PROBLEMS 168
CHECK YOUR UNDERSTANDING 172
PROJECTS: RULE OF 70, NEWTON’S METHOD 173
4 USING THE DERIVATIVE
4.1
4.2
4.3
4.4
4.5
4.6
4.7
4.8
175
USING FIRST AND SECOND DERIVATIVES 176
OPTIMIZATION 185
FAMILIES OF FUNCTIONS 193
OPTIMIZATION, GEOMETRY, AND MODELING 200
APPLICATIONS TO MARGINALITY 211
RATES AND RELATED RATES 219
L’HOPITAL’S RULE, GROWTH, AND DOMINANCE 228
PARAMETRIC EQUATIONS 234
REVIEW PROBLEMS 246
CHECK YOUR UNDERSTANDING 251
PROJECTS: BUILDING A GREENHOUSE, FITTING A LINE TO DATA, FIREBREAKS
5 KEY CONCEPT: THE DEFINITE INTEGRAL
5.1
5.2
5.3
5.4
HOW DO WE MEASURE DISTANCE TRAVELED? 256
THE DEFINITE INTEGRAL 264
THE FUNDAMENTAL THEOREM AND INTERPRETATIONS 271
THEOREMS ABOUT DEFINITE INTEGRALS 282
REVIEW PROBLEMS 290
CHECK YOUR UNDERSTANDING 296
PROJECTS: THE CAR AND THE TRUCK, AN ORBITING SATELLITE
255
297
6 CONSTRUCTING ANTIDERIVATIVES
6.1
6.2
6.3
6.4
6.5
252
ANTIDERIVATIVES GRAPHICALLY AND NUMERICALLY 300
CONSTRUCTING ANTIDERIVATIVES ANALYTICALLY 305
DIFFERENTIAL EQUATIONS 312
SECOND FUNDAMENTAL THEOREM OF CALCULUS 317
THE EQUATIONS OF MOTION 322
REVIEW PROBLEMS 325
CHECK YOUR UNDERSTANDING 328
PROJECTS: DISTRIBUTION OF RESOURCES, YIELD FROM AN APPLE ORCHARD
SLOPE FIELDS 329
299
www.pdfgrip.com
xiii
Contents
7 INTEGRATION
7.1
7.2
7.3
7.4
7.5
7.6
7.7
7.8
331
INTEGRATION BY SUBSTITUTION 332
INTEGRATION BY PARTS 341
TABLES OF INTEGRALS 347
ALGEBRAIC IDENTITIES AND TRIGONOMETRIC SUBSTITUTIONS
APPROXIMATING DEFINITE INTEGRALS 361
APPROXIMATION ERRORS AND SIMPSON’S RULE 366
IMPROPER INTEGRALS 371
COMPARISON OF IMPROPER INTEGRALS 379
REVIEW PROBLEMS 385
CHECK YOUR UNDERSTANDING 389
PROJECTS: TAYLOR POLYNOMIAL INEQUALITIES 390
352
8 USING THE DEFINITE INTEGRAL
8.1
8.2
8.3
8.4
8.5
8.6
8.7
8.8
AREAS AND VOLUMES 392
APPLICATIONS TO GEOMETRY 398
AREA AND ARC LENGTH IN POLAR COORDINATES 406
DENSITY AND CENTER OF MASS 415
APPLICATIONS TO PHYSICS 424
APPLICATIONS TO ECONOMICS 433
DISTRIBUTION FUNCTIONS 439
PROBABILITY, MEAN, AND MEDIAN 446
REVIEW PROBLEMS 454
CHECK YOUR UNDERSTANDING 459
PROJECTS: VOLUME ENCLOSED BY TWO CYLINDERS, LENGTH OF A HANGING CABLE
SURFACE AREA OF AN UNPAINTABLE CAN OF PAINT
MAXWELL’S DISTRIBUTION OF MOLECULAR VELOCITIES 460
9 SEQUENCES AND SERIES
9.1
9.2
9.3
9.4
9.5
391
463
SEQUENCES 464
GEOMETRIC SERIES 470
CONVERGENCE OF SERIES 476
TESTS FOR CONVERGENCE 481
POWER SERIES AND INTERVAL OF CONVERGENCE 490
REVIEW PROBLEMS 497
CHECK YOUR UNDERSTANDING 501
PROJECTS: A DEFINITION OF , PROBABILITY OF WINNING IN SPORTS, PREDNISONE
502
www.pdfgrip.com
xiv
Contents
10 APPROXIMATING FUNCTIONS USING SERIES
10.1
10.2
10.3
10.4
10.5
TAYLOR POLYNOMIALS 506
TAYLOR SERIES 514
FINDING AND USING TAYLOR SERIES 519
THE ERROR IN TAYLOR POLYNOMIAL APPROXIMATIONS 525
FOURIER SERIES 530
REVIEW PROBLEMS 543
CHECK YOUR UNDERSTANDING 546
PROJECTS: SHAPE OF PLANETS, MACHIN’S FORMULA AND THE VALUE OF
APPROXIMATING THE DERIVATIVE 546
505
11 DIFFERENTIAL EQUATIONS
11.1
11.2
11.3
11.4
11.5
11.6
11.7
11.8
11.9
11.10
11.11
549
WHAT IS A DIFFERENTIAL EQUATION? 550
SLOPE FIELDS 554
EULER’S METHOD 561
SEPARATION OF VARIABLES 564
GROWTH AND DECAY 570
APPLICATIONS AND MODELING 579
THE LOGISTIC MODEL 587
SYSTEMS OF DIFFERENTIAL EQUATIONS 598
ANALYZING THE PHASE PLANE 607
SECOND-ORDER DIFFERENTIAL EQUATIONS: OSCILLATIONS 612
LINEAR SECOND-ORDER DIFFERENTIAL EQUATIONS 619
REVIEW PROBLEMS 628
CHECK YOUR UNDERSTANDING 633
PROJECTS: SARS PREDICTIONS FOR HONG KONG, A S-I-R MODEL FOR SARS
PARETO’S LAW, VIBRATIONS IN A MOLECULE 634
APPENDIX
A
B
C
D
ROOTS, ACCURACY, AND BOUNDS
COMPLEX NUMBERS 646
NEWTON’S METHOD 653
VECTORS IN THE PLANE 656
637
638
READY REFERENCE
663
ANSWERS TO ODD-NUMBERED PROBLEMS
675
INDEX
709
www.pdfgrip.com
Chapter One
A LIBRARY OF
FUNCTIONS
Contents
1.1 Functions and Change . . . . . . . . . . . .
The Rule of Four . . . . . . . . . . . . . .
Examples of Domain and Range . . . . . . .
Linear Functions . . . . . . . . . . . . . .
Families of Linear Functions . . . . . . . .
Increasing versus Decreasing Functions . . .
Proportionality . . . . . . . . . . . . . . .
1.2 Exponential Functions . . . . . . . . . . .
Concavity . . . . . . . . . . . . . . . . .
Elimination of a Drug from the Body . . . .
The General Exponential Function . . . . . .
Half-Life and Doubling Time . . . . . . . .
The Family of Exponential Functions . . . .
Exponential Functions with Base
. . . . .
1.3 New Functions from Old . . . . . . . . . .
Shifts and Stretches . . . . . . . . . . . . .
Composite Functions . . . . . . . . . . . .
Odd and Even Functions: Symmetry . . . . .
Inverse Functions . . . . . . . . . . . . . .
1.4 Logarithmic Functions . . . . . . . . . . .
Logarithms to Base 10 and to Base
. . . .
Solving Equations Using Logarithms . . . .
1.5 Trigonometric Functions . . . . . . . . . .
Radians . . . . . . . . . . . . . . . . . .
The Sine and Cosine Functions . . . . . . .
The Tangent Function . . . . . . . . . . . .
The Inverse Trigonometric Functions . . . .
1.6 Powers, Polynomials, and Rational Functions
Power Functions . . . . . . . . . . . . . .
Dominance . . . . . . . . . . . . . . . . .
Polynomials . . . . . . . . . . . . . . . .
Rational Functions . . . . . . . . . . . . .
1.7 Introduction to Continuity . . . . . . . . .
Graphical Viewpoint . . . . . . . . . . . .
The Intermediate Value Theorem . . . . . .
Numerical Viewpoint . . . . . . . . . . . .
1.8 Limits . . . . . . . . . . . . . . . . . . . .
The Idea of a Limit . . . . . . . . . . . . .
Definition of Limit . . . . . . . . . . . . .
Definition of Continuity . . . . . . . . . .
REVIEW PROBLEMS . . . . . . . . . . .
CHECK YOUR UNDERSTANDING . . . .
PROJECTS . . . . . . . . . . . . . . . . .
2
2
3
4
5
6
6
10
11
11
12
12
13
13
17
17
18
19
19
24
24
26
30
30
31
34
34
38
38
39
40
42
47
47
48
49
51
51
51
56
60
65
67
www.pdfgrip.com
2
Chapter One A LIBRARY OF FUNCTIONS
1.1
FUNCTIONS AND CHANGE
In mathematics, a function is used to represent the dependence of one quantity upon another.
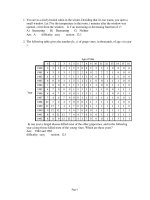
Let’s look at an example. In January, 2007, the temperatures in Fresno, California were unusually low for the winter and much of the orange crop was lost. The daily high temperatures for
January 9–18 are given in Table 1.1.
Table 1.1
Daily high temperature in Fresno, January 9–18, 2007
Date (January 2007)
◦
High temperature ( F)
9
10
11
12
13
14
15
16
17
18
32
32
39
25
23
25
24
25
28
29
Although you may not have thought of something so unpredictable as temperature as being a
function, the temperature is a function of date, because each day gives rise to one and only one
high temperature. There is no formula for temperature (otherwise we would not need the weather
bureau), but nevertheless the temperature does satisfy the definition of a function: Each date, t, has
a unique high temperature, H, associated with it.
We define a function as follows:
A function is a rule that takes certain numbers as inputs and assigns to each a definite output
number. The set of all input numbers is called the domain of the function and the set of
resulting output numbers is called the range of the function.
The input is called the independent variable and the output is called the dependent variable.
In the temperature example, the domain is the set of dates {9, 10, 11, 12, 13, 14, 15, 16, 17, 18} and
the range is the set of temperatures {23, 24, 25, 28, 29, 32, 39}. We call the function f and write
H = f (t). Notice that a function may have identical outputs for different inputs (January 12, 14,
and 16, for example).
Some quantities, such as date, are discrete, meaning they take only certain isolated values (dates
must be integers). Other quantities, such as time, are continuous as they can be any number. For a
continuous variable, domains and ranges are often written using interval notation:
The set of numbers t such that a ≤ t ≤ b is written [a, b].
The set of numbers t such that a < t < b is written (a, b).
The Rule of Four: Tables, Graphs, Formulas, and Words
Functions can be represented by tables, graphs, formulas, and descriptions in words. For example, the function giving the daily high temperatures in Fresno can be represented by the graph in
Figure 1.1, as well as by Table 1.1.
H (◦ F)
40
30
20
10
12
14
16
18
t (date)
Figure 1.1: Fresno temperatures, January 2007
As another example of a function, consider the snow tree cricket. Surprisingly enough, all such
crickets chirp at essentially the same rate if they are at the same temperature. That means that the
www.pdfgrip.com
1.1 FUNCTIONS AND CHANGE
3
chirp rate is a function of temperature. In other words, if we know the temperature, we can determine
the chirp rate. Even more surprisingly, the chirp rate, C, in chirps per minute, increases steadily with
the temperature, T , in degrees Fahrenheit, and can be computed by the formula
C = 4T − 160
to a fair degree of accuracy. We write C = f (T ) to express the fact that we think of C as a function
of T and that we have named this function f . The graph of this function is in Figure 1.2.
C (chirps per minute)
400
300
200
C = 4T − 160
100
40
100
140
T (◦ F)
Figure 1.2: Cricket chirp rate versus temperature
Examples of Domain and Range
If the domain of a function is not specified, we usually take it to be the largest possible set of
real numbers. For example, we usually think of the domain of the function f (x) = x2 as all real
numbers. However, the domain of the function g(x) = 1/x is all real numbers except zero, since
we cannot divide by zero.
Sometimes we restrict the domain to be smaller than the largest possible set of real numbers.
For example, if the function f (x) = x2 is used to represent the area of a square of side x, we restrict
the domain to nonnegative values of x.
Example 1
The function C = f (T ) gives chirp rate as a function of temperature. We restrict this function to
temperatures for which the predicted chirp rate is positive, and up to the highest temperature ever
recorded at a weather station, 136◦ F. What is the domain of this function f ?
Solution
If we consider the equation
C = 4T − 160
simply as a mathematical relationship between two variables C and T , any T value is possible.
However, if we think of it as a relationship between cricket chirps and temperature, then C cannot
be less than 0. Since C = 0 leads to 0 = 4T − 160, and so T = 40◦ F, we see that T cannot be less
than 40◦ F. (See Figure 1.2.) In addition, we are told that the function is not defined for temperatures
above 136◦ . Thus, for the function C = f (T ) we have
Domain = All T values between 40◦ F and 136◦ F
= All T values with 40 ≤ T ≤ 136
= [40, 136].
Example 2
Find the range of the function f , given the domain from Example 1. In other words, find all possible
values of the chirp rate, C, in the equation C = f (T ).
Solution
Again, if we consider C = 4T − 160 simply as a mathematical relationship, its range is all real C
values. However, when thinking of the meaning of C = f (T ) for crickets, we see that the function
predicts cricket chirps per minute between 0 (at T = 40◦ F) and 384 (at T = 136◦ F). Hence,
Range = All C values from 0 to 384
= All C values with 0 ≤ C ≤ 384
= [0, 384].
www.pdfgrip.com
4
Chapter One A LIBRARY OF FUNCTIONS
In using the temperature to predict the chirp rate, we thought of the temperature as the independent variable and the chirp rate as the dependent variable. However, we could do this backward, and
calculate the temperature from the chirp rate. From this point of view, the temperature is dependent
on the chirp rate. Thus, which variable is dependent and which is independent may depend on your
viewpoint.
Linear Functions
The chirp-rate function, C = f (T ), is an example of a linear function. A function is linear if its
slope, or rate of change, is the same at every point. The rate of change of a function that is not linear
may vary from point to point.
Olympic and World Records
During the early years of the Olympics, the height of the men’s winning pole vault increased approximately 8 inches every four years. Table 1.2 shows that the height started at 130 inches in 1900,
and increased by the equivalent of 2 inches a year. So the height was a linear function of time from
1900 to 1912. If y is the winning height in inches and t is the number of years since 1900, we can
write
y = f (t) = 130 + 2t.
Since y = f (t) increases with t, we say that f is an increasing function. The coefficient 2 tells us
the rate, in inches per year, at which the height increases.
Table 1.2
Men’s Olympic pole vault winning height (approximate)
Year
1900
1904
1908
1912
Height (inches)
130
138
146
154
This rate of increase is the slope of the line in Figure 1.3. The slope is given by the ratio
Slope =
146 − 138
8
Rise
=
= = 2 inches/year.
Run
8−4
4
Calculating the slope (rise/run) using any other two points on the line gives the same value.
What about the constant 130? This represents the initial height in 1900, when t = 0. Geometrically, 130 is the intercept on the vertical axis.
y (height in inches)
y = 130 + 2t
150
140
✛
✲
✻Rise = 8
❄
Run = 4
130
4
8
12
t (years since 1900)
Figure 1.3: Olympic pole vault records
You may wonder whether the linear trend continues beyond 1912. Not surprisingly, it doesn’t
exactly. The formula y = 130+2t predicts that the height in the 2004 Olympics would be 338 inches
or 28 feet 2 inches, which is considerably higher than the actual value of 19 feet 6.25 inches. There
is clearly a danger in extrapolating too far from the given data. You should also observe that the data
in Table 1.2 is discrete, because it is given only at specific points (every four years). However, we
have treated the variable t as though it were continuous, because the function y = 130 + 2t makes
www.pdfgrip.com
1.1 FUNCTIONS AND CHANGE
5
sense for all values of t. The graph in Figure 1.3 is of the continuous function because it is a solid
line, rather than four separate points representing the years in which the Olympics were held.
As the pole vault heights have increased over the years, the time to run the mile has decreased.
If y is the world record time to run the mile, in seconds, and t is the number of years since 1900,
then records show that, approximately,
y = g(t) = 260 − 0.39t.
The 260 tells us that the world record was 260 seconds in 1900 (at t = 0). The slope, −0.39, tells
us that the world record decreased by about 0.39 seconds per year. We say that g is a decreasing
function.
Difference Quotients and Delta Notation
We use the symbol ∆ (the Greek letter capital delta) to mean “change in,” so ∆x means change in
x and ∆y means change in y.
The slope of a linear function y = f (x) can be calculated from values of the function at two
points, given by x1 and x2 , using the formula
m=
Rise
∆y
f (x2 ) − f (x1 )
=
=
.
Run
∆x
x2 − x1
The quantity (f (x2 ) − f (x1 ))/(x2 − x1 ) is called a difference quotient because it is the quotient of
two differences. (See Figure 1.4). Since m = ∆y/∆x, the units of m are y-units over x-units.
y
y = f (x)
(x2 , f (x2 ))
✻
Rise = f (x2 ) − f (x1 )
(x1 , f (x1 ))
✛
✲
❄
Run = x2 − x1
x1
x
x2
Figure 1.4: Difference quotient =
f (x2 ) − f (x1 )
x2 − x1
Families of Linear Functions
A linear function has the form
y = f (x) = b + mx.
Its graph is a line such that
• m is the slope, or rate of change of y with respect to x.
• b is the vertical intercept, or value of y when x is zero.
Notice that if the slope, m, is zero, we have y = b, a horizontal line.
To recognize that a table of x and y values comes from a linear function, y = b + mx, look
for differences in y-values that are constant for equally spaced x-values.
www.pdfgrip.com
6
Chapter One A LIBRARY OF FUNCTIONS
Formulas such as f (x) = b + mx, in which the constants m and b can take on various values,
give a family of functions. All the functions in a family share certain properties—in this case, all the
graphs are straight lines. The constants m and b are called parameters; their meaning is shown in
Figures 1.5 and 1.6. Notice the greater the magnitude of m, the steeper the line.
y = −x
y = −2x
y
y = 2x
y = −0.5x
y
y=x
y=x
y = 0.5x
y = −1 + x
x
x
y =2+x
y =1+x
Figure 1.5: The family y = mx
(with b = 0)
Figure 1.6: The family y = b + x
(with m = 1)
Increasing versus Decreasing Functions
The terms increasing and decreasing can be applied to other functions, not just linear ones. See
Figure 1.7. In general,
A function f is increasing if the values of f (x) increase as x increases.
A function f is decreasing if the values of f (x) decrease as x increases.
The graph of an increasing function climbs as we move from left to right.
The graph of a decreasing function falls as we move from left to right.
A function f (x) is monotonic if it increases for all x or decreases for all x.
Decreasing
Increasing
Figure 1.7: Increasing and decreasing functions
Proportionality
A common functional relationship occurs when one quantity is proportional to another. For example, the area, A, of a circle is proportional to the square of the radius, r, because
A = f (r) = πr2 .
We say y is (directly) proportional to x if there is a nonzero constant k such
that
y = kx.
This k is called the constant of proportionality.
We also say that one quantity is inversely proportional to another if one is proportional to the
reciprocal of the other. For example, the speed, v, at which you make a 50-mile trip is inversely
proportional to the time, t, taken, because v is proportional to 1/t:
v = 50
1
t
=
50
.
t
www.pdfgrip.com
7
1.1 FUNCTIONS AND CHANGE
Exercises and Problems for Section 1.1
Exercises
1. The population of a city, P , in millions, is a function of
t, the number of years since 1970, so P = f (t). Explain
the meaning of the statement f (35) = 12 in terms of the
population of this city.
2. When a patient with a rapid heart rate takes a drug,
the heart rate plunges dramatically and then slowly rises
again as the drug wears off. Sketch the heart rate against
time from the moment the drug is administered.
13. Match the graphs in Figure 1.10 with the following equations. (Note that the x and y scales may be unequal.)
(a) y = −2.72x
(c) y = 27.9 − 0.1x
(e) y = −5.7 − 200x
(I)
y
(II)
3. Describe what Figure 1.8 tells you about an assembly
line whose productivity is represented as a function of
the number of workers on the line.
productivity
(b) y = 0.01 + 0.001x
(d) y = 0.1x − 27.9
(f) y = x/3.14
y
x
(IV)
y
(III)
x
y
(V)
y
x
y
(VI)
x
x
number of workers
x
Figure 1.10
Figure 1.8
For Exercises 4–7, find an equation for the line that passes
through the given points.
4. (0, 0) and (1, 1)
5. (0, 2) and (2, 3)
6. (−2, 1) and (2, 3)
7. (−1, 0) and (2, 6)
14. Estimate the slope and the equation of the line in Figure 1.11.
y
4
2
x
5
For Exercises 8–11, determine the slope and the y-intercept of
the line whose equation is given.
8. 2y + 5x − 8 = 0
9. 7y + 12x − 2 = 0
10. −4y + 2x + 8 = 0
11. 12x = 6y + 4
12. Match the graphs in Figure 1.9 with the following equations. (Note that the x and y scales may be unequal.)
(a) y = x − 5
(c) 5 = y
(e) y = x + 6
(I)
y
y
x
(IV)
y
(III)
y
x
(V)
y
x
x
Figure 1.9
x
(VI)
Figure 1.11
15. Find an equation for the line with slope m through the
point (a, c).
16. Find a linear function that generates the values in Table 1.3.
Table 1.3
(b) −3x + 4 = y
(d) y = −4x − 5
(f) y = x/2
(II)
10
x
5.2
5.3
5.4
5.5
5.6
y
27.8
29.2
30.6
32.0
33.4
For Exercises 17–19, use the facts that parallel lines have
equal slopes and that the slopes of perpendicular lines are negative reciprocals of one another.
17. Find an equation for the line through the point (2, 1)
which is perpendicular to the line y = 5x − 3.
y
x
18. Find equations for the lines through the point (1, 5) that
are parallel to and perpendicular to the line with equation
y + 4x = 7.
19. Find equations for the lines through the point (a, b) that
are parallel and perpendicular to the line y = mx + c,
assuming m = 0.
www.pdfgrip.com
8
Chapter One A LIBRARY OF FUNCTIONS
For Exercises 20–23, give the approximate domain and range
of each function. Assume the entire graph is shown.
Find domain and range in Exercises 24–25.
24. y = x2 + 2
y
20.
y
21.
5
4
y = f (x)
x
x
1
3
27. If g(x) = (4 − x2 )/(x2 + x), find the domain of g(x).
Solve g(x) = 0.
y = f (x)
2
1
1
x2 + 2
√
26. If f (t) = t2 − 16, find all values of t for which f (t)
is a real number. Solve f (t) = 3.
6
3
25. y =
1
5
3
5
In Exercises 28–32, write a formula representing the function.
28. The volume of a sphere is proportional to the cube of its
radius, r.
y
22.
y
23.
5
2
30. The strength, S, of a beam is proportional to the square
of its thickness, h.
3
x
2
y = f (x)
−2
y = f (x)
29. The average velocity, v, for a trip over a fixed distance,
d, is inversely proportional to the time of travel, t.
1
x
−2
1
3
5
31. The energy, E, expended by a swimming dolphin is proportional to the cube of the speed, v, of the dolphin.
32. The number of animal species, N , of a certain body
length, l, is inversely proportional to the square of l.
Problems
33. The value of a car, V = f (a), in thousands of dollars, is
a function of the age of the car, a, in years.
35. A company rents cars at $40 a day and 15 cents a mile.
Its competitor’s cars are $50 a day and 10 cents a mile.
(a) Interpret the statement f (5) = 6
(b) Sketch a possible graph of V against a. Is f an increasing or decreasing function? Explain.
(c) Explain the significance of the horizontal and vertical intercepts in terms of the value of the car.
(a) For each company, give a formula for the cost of
renting a car for a day as a function of the distance
traveled.
(b) On the same axes, graph both functions.
(c) How should you decide which company is cheaper?
34. Which graph in Figure 1.12 best matches each of the following stories?1 Write a story for the remaining graph.
(a) I had just left home when I realized I had forgotten
my books, and so I went back to pick them up.
(b) Things went fine until I had a flat tire.
(c) I started out calmly but sped up when I realized I
was going to be late.
(I)
distance
from home
distance
from home
(II)
time
(III)
distance
from home
(IV)
time
distance
from home
time
Figure 1.12
time
36. Residents of the town of Maple Grove who are connected
to the municipal water supply are billed a fixed amount
monthly plus a charge for each cubic foot of water used.
A household using 1000 cubic feet was billed $40, while
one using 1600 cubic feet was billed $55.
(a) What is the charge per cubic foot?
(b) Write an equation for the total cost of a resident’s
water as a function of cubic feet of water used.
(c) How many cubic feet of water used would lead to a
bill of $100?
37. An object is put outside on a cold day at time t = 0. Its
temperature, H = f (t), in ◦ C, is graphed in Figure 1.13.
(a) What does the statement f (30) = 10 mean in terms
of temperature? Include units for 30 and for 10 in
your answer.
(b) Explain what the vertical intercept, a, and the horizontal intercept, b, represent in terms of temperature
of the object and time outside.
1 Adapted from Jan Terwel, “Real Math in Cooperative Groups in Secondary Education.” Cooperative Learning in Mathematics, ed. Neal Davidson, p. 234, (Reading: Addison Wesley, 1990).
www.pdfgrip.com
1.1 FUNCTIONS AND CHANGE
H (◦ C)
a
t (min)
b
9
41. The demand function for a certain product, q = D(p), is
linear, where p is the price per item in dollars and q is the
quantity demanded. If p increases by $5, market research
shows that q drops by two items. In addition, 100 items
are purchased if the price is $550.
(a) Find a formula for
(i) q as a linear function of p
Figure 1.13
(ii) p as a linear function of q
38. The force, F , between two atoms depends on the distance r separating them. See Figure 1.14. A positive F
represents a repulsive force; a negative F represents an
attractive force.
(a) What happens to the force if the atoms start with
r = a and are
(i) Pulled slightly further apart?
(ii) Pushed slightly closer together?
(b) The atoms are said to be in stable equilibrium if the
force between them is zero and the atoms tend to
return to the equilibrium after a minor disturbance.
Does r = a represent a stable equilibrium? Explain.
(b) Draw a graph with q on the horizontal axis.
42. The cost of planting seed is usually a function of the number of acres sown. The cost of the equipment is a fixed
cost because it must be paid regardless of the number
of acres planted. The cost of supplies and labor varies
with the number of acres planted and are called variable
costs. Suppose the fixed costs are $10,000 and the variable costs are $200 per acre. Let C be the total cost, measured in thousands of dollars, and let x be the number of
acres planted.
(a) Find a formula for C as a function of x.
(b) Graph C against x.
(c) Which feature of the graph represents the fixed
costs? Which represents the variable costs?
F
r
a
Figure 1.14
39. A controversial 1992 Danish study2 reported that men’s
average sperm count has decreased from 113 million per
milliliter in 1940 to 66 million per milliliter in 1990.
(a) Express the average sperm count, S, as a linear function of the number of years, t, since 1940.
(b) A man’s fertility is affected if his sperm count drops
below about 20 million per milliliter. If the linear
model found in part (a) is accurate, in what year will
the average male sperm count fall below this level?
40. The graph of Fahrenheit temperature, ◦ F, as a function of
Celsius temperature, ◦ C, is a line. You know that 212◦ F
and 100◦ C both represent the temperature at which water boils. Similarly, 32◦ F and 0◦ C both represent water’s
freezing point.
(a) What is the slope of the graph?
(b) What is the equation of the line?
(c) Use the equation to find what Fahrenheit temperature corresponds to 20◦ C.
(d) What temperature is the same number of degrees in
both Celsius and Fahrenheit?
2 “Investigating
43. You drive at a constant speed from Chicago to Detroit,
a distance of 275 miles. About 120 miles from Chicago
you pass through Kalamazoo, Michigan. Sketch a graph
of your distance from Kalamazoo as a function of time.
44. A flight from Dulles Airport in Washington, DC, to LaGuardia Airport in New York City has to circle LaGuardia several times before being allowed to land. Plot a
graph of the distance of the plane from Washington, DC,
against time, from the moment of takeoff until landing.
45. (a) Consider the functions graphed in Figure 1.15(a).
Find the coordinates of C.
(b) Consider the functions in Figure 1.15(b). Find the
coordinates of C in terms of b.
y
(a)
y
(b)
y=
x2
y = x2
C
C
(0, 2)
(0, b)
(1, 1)
(1, 1)
x
Figure 1.15
the Next Silent Spring,” US News and World Report, p. 50-52, (March 11, 1996).
x