Tài liệu Báo cáo Y học: Prediction of protein–protein interaction sites in heterocomplexes with neural networks ppt
Bạn đang xem bản rút gọn của tài liệu. Xem và tải ngay bản đầy đủ của tài liệu tại đây (211.76 KB, 6 trang )
Prediction of protein–protein interaction sites in heterocomplexes
with neural networks
Piero Fariselli
1
, Florencio Pazos
2
, Alfonso Valencia
2
and Rita Casadio
1
1
CIRB and Department of Biology, University of Bologna via Irnerio, Bologna, Italy;
2
Protein Design Group, CNB-CSIC
Cantoblanco, Madrid, Spain
In this paper w e a ddress t he prob lem of e xtracting f eatures
relevant for predicting protein–protein interaction sites from
the three-dimensional structures of protein co mplexes. Our
approach is based on information about evolutionary con-
servation and surface disposition. We implement a neural
network b ased system, which uses a cross validation proce-
dure and allows the correct detection of 73% of the residues
involved in protein interactions in a selected database
comprising 226 heterodimers. Our analysis confirms that the
chemico-physical properties of interacting surfaces are
difficult to distinguish from those of t he whole protein sur-
face. However neural networks t rained with a r educed
representation of the interacting patch and sequence profile
are sufficient to generalize over the different features of the
contact patches and to predict whether a residue in the
protein s urface is or is not in contact. By using a blind test, we
report the prediction of the surface interacting sites of three
structural components of the Dnak molecular chaperone
system, and find close agreement with previously published
experimental results. We propose that the predictor can
significantly complement results from structural and func-
tional proteomics.
Keywords: protein–protein interaction; protein surface;
neural network; evolutionary information.
In the Ôpost-genomeÕ era, a shift of emphasis is taking place
towards making genomics functional [1,2]. In this respect,
the systematic study of protein–protein interaction through
the isolation of protein complexes is under way, and cell-
map proteomics adds a route to efficiently study the genome
at the protein level [3–6]. The availability of the complete
DNA sequences for many p rokaryotic and eukaryotic
genomes, however, m akes it feasible to tackle the problem
from a computational perspective [7–9] and characterize
putative protein networks involved in functional pathways
[10,11].
A different but complementary approach for understand-
ing which proteins functionally interact is to develop tools
that starting from the complexes known at atomic resolu-
tion can extract features common to all the proteins that
share a common surface. This allows the prediction o f
putative contact regions in proteins that may interact with
other proteins.
The analysis of p rotein contact surfaces has a relatively
long history; from the pivotal work of Chotia & Janin [12],
in which a small number of protein c omplexes w ere
analysed, to the more recent work of Thornton et al.
[13–16], which focuses on the properties of patches of
interacting residues in protein, particularly homodimers.
Current biophysical theories about the protein interacting
regions highlight the role o f the shape, chemical comple-
mentarity and flexibility of the molecules involved [17].
An important finding has been the presence of a significant
population of charged and polar residues on protein–
protein interfaces [18]. Hydrophobicity is an average
characteristic property of interacting s urfaces only in
homodimers, most of which exist in a n oligomeric state
[19]. Other complexes, however, have interfaces with mean
hydrophobicities that are essentially indistinguishable from
that of a typical protein surface [17,18]. Similarly, no residue
preference for the interacting surfaces has been reported,
although a recent study carried out on 621 protein–protein
interfaces taken from the PDB database indicates that
hydrophobic residues are abundant in large interfaces while
polar residues are more abundant in small interacting
patches [20].
The geometric and electrostatic complementarity obser-
ved within interfaces forms the basis of docking methods
(rigid and soft docking) that can be used to detect protein–
protein interactions when crystal structures are available
[21].
An alternative possibility that does not depend on the
knowledge of the protein structure is the detection of
regions of interaction by the presence of specific family
signatures in the m ultiple s equence alignment a ble t o
discriminate different t ypes of contacts. T his approach has
been addressed w ith different methods. C asari et al.[22]
introduced a multicomponent analysis for detecting, in
sequence space, those residues t hat a re conserved within a
subfamily of proteins, but which differ between subfamilies
(tree-determinant positions). These positions were inter-
preted as part of the interacting surface between proteins
and substrates, or between different proteins [23]. Other
authors [24,25] studied positions exhibiting conservation
patterns in one or more subfamily and i nterpreted the
results in terms of prediction of binding sites and functional
interfaces.
Correspondence to R. Casadio, CIRB/Department of Biology,
Via Irnerio 42, 40126 Bologna, Italy. Fax: + 39 051242576;
Tel.: + 39 0512094005; E-mail:
Note: a website is available at
(Received 13 August 2001, revised 5 December 2001, accepted
7 January 2002)
Eur. J. Biochem. 269, 1356–1361 (2002) Ó FEBS 2002
More recently, methods were devised for predicting
residues involved in protein interaction s ites in the absence
of any structural reports. By analysing hydrophobicity
distribution, linear stretches of sequences were predicted as
receptor-binding domains [26] and a Supp ort Vector
Machine learning system was trained to recognize and
predict interactions based solely on primary structure and
associated physico-chemical properties [27].
In spite of the wealth of approaches presently available,
the problem of predicting an interacting surface in an
unbound protein still deserves some attention, because most
of the above mentioned methods are suited to solve only
particular aspects of protein–protein interac tion.
Our p resent study focu ses on t he generation of a t ool
for detecting interacting surfaces in proteins starting from
their three-dimensional structure. This is particularly
important in determining protein function, especially that
of proteins of known structure but unknown function,
and is a necessary prerequisite in functional proteomics
studies. We trained a neural network system to learn the
association rules relating to exposed residues a t the
protein surface with the property of being or not being
in a c ontact p atch. T he system, using a cross validation
procedure on the 226 protein heterodimers of the selected
data set, performs with a 73% per residue accuracy.
To further test our method we als o predict the protein–
protein interaction sites of the three-structural component
of the Dnak molecular chaperonin system, recently solved
as unbound molecules [28–30] and f or which many
experimental results have been published, pointing to
specific interaction regions in the complex (for review see
[31]). Remarkably our predicted interaction sites fit with
the experimental d ata, confirm ing that the predictor can
be used to locate putative interaction surfaces in unbound
proteins.
EXPERIMENTAL PROCEDURES
Selection of the database
The data s et for training/testing was sele cted from the SPIN
database ( />which contains all the protein complexes contained in the
PDB Protein Data Bank. Using the
SPIN
search engine, it is
possible to search the se t of protein complexes for specific
characteristics. In our search we excluded homodimers and
protease–inhibitor complexes. I t is w ell d ocumented that
hydrophobicity is an average characteristic property of the
interacting surfaces of homodimers [19]. Furthermore the
interacting surface of proteases is characterized by distin-
guishing marks, mainly serine and histidine active site
signatures, and are therefore easily detectable from the
protein sequence ( The exclu-
sion of homodimers and protease complexes was carried out
in order to eliminate strong peculiar signals, as our goal is to
test (train) the predictor on protein interfaces with general
characteristics. We also excluded chains involved in more
than one interaction, in order to concentrate only on
heterodimers. The set was then filtered, thus eliminating the
chains labelled as Ômembrane peptidesÕ, s mall proteins’ and
Ôcoiled coilsÕ in the SCOP classification [32]. This was carried
out in order to discharge small fragments annotated as
different protein chains. A fter this filtering, we ended up
with 226 interacting protein chains (the list is available at
/>Surface and contact definitions
We adopt the simplest description of the protein surface and
contacts. Each protein is represented using its Ca trace
(connecting the Ca atoms in the protein backbone), and the
contacts between the protein dimers are computed using t he
CA atom distances between the tw o chains. According to
this procedure, the protein surface is then the collection of
the CA coordinates b elonging to t he exposed residues.
Solvent exposure is s eparately computed for e ach c hain,
using the
DSSP
program [33]. Each complex is split in
different fi les c ontaining only the coordinates of a single
chain. After a thorough inspection, for defining a residue
exposed or buried, we selected as a threshold cut-off 16% of
the relative solvent accessibility [34].
The patches relative to the protein–protein interaction
sites are defined for each protein chain using a CA distance
cut-off of 1.2 nm. This threshold value is selected after
comparison with the patches obtained using an all-atom
representation. By this, the number of residues involved i n
protein–protein interaction sites is a bout 40% of the wh ole
set o f e xposed residues (31910 residues) in the s elected
database.
The Predictor
Our method is a feed-forward neural network trained with
the standard back-propagation algorithm [35]. The network
system is trained/tested to predict w hether each surface
residue (represented by a C A atom) is in contact or not with
another protein. The network architecture contains an
output layer, which consists of a single n euron representing
contact (target value ¼ 1) or noncontact (target
value ¼ 0). We tested our predictor using different num-
bers of hidden neurons (from 2 to 10), and the best
performance was obtained with a hidden layer containing
four nodes. The neural n etwork is fed using an 11 residue-
long window. This window is centred on the surface residue
to be predicted that is sided by the 10 nearest neighbours in
the patch. The residues included in the input window are
close in space, not necessarily contiguous in the sequence
and represent a rough approximation of the local surface.
Each residue in the input window is coded as a vector of 20
elements, whose values are taken from the corresponding
frequencies i n the multiple sequence alignment of the
protein as extracted from the
HSSP
file [36].
RESULTS AND DISCUSSION
The predictor at work
We trained the predictor using a threefold cross validation
procedure. This was carried out by splitting the data set into
three s ubsets, almo st equal in size ( the s equence i dentity
within the protein chains of each set w as £ 30%). The
network during the training phase extracts general rules of
associations between the residues on the protein surface and
the feature of being in the contact surface or not, depending
on the local context o f nearest neighbours. Moreover, the
code of each residue i s determined by its p osition in t he
Ó FEBS 2002 Predicting protein–protein interaction sites (Eur. J. Biochem. 269) 1357
sequence profile. This is the s ame as including the residue
conservation in the contact surface in the protein family.
The scoring efficiency of the best performing neural
network in t he testing phase is shown in Table 1. The two-
state per-residue accuracy (Q2), computed as the total
number of correctly predicted contacts and noncontacts
normalized over the whole data set, reaches 0.73 with a
correlation coefficient (C) of 0.43 . T his is a relevant
achievement if we compare this efficiency with that obtained
with a random predictor ( in this case the Q2 and C-values
are equal to 0.60 and 0, respectively).
Another scoring index for the contact (c) class is the
probability of correct predictions [P(x) in Table 1]. P(x)
gives the accuracy of the prediction of the x class with
respect to the overall amount of total predictions made for
that class. The prediction efficienc y has a P(x) value of 0.72
and this is by far higher than that obtained with the random
predictor (0.40). Moreover, t he P(x) value is fairly well
balanced for t he two classes ( see Table 1). This indicates
that on average the probability of correct assignment is
independent of the class type. In contrast, the Q index (the
number of the true positives over the number of all positives
in the class) is higher for the noncontact class (Table 1). This
disproportion is due to the fact that the predictor gives more
assignments to t he most abundant class (40% of the
residues are contacts, 60% are noncontacts).
While this work was in progress, a similar predictor based
also on neural networks became available [37]. However, in
this work all the complexes in the PDB June 2000 release
(615 protein complexes) are retained, independent of their
classification. Furthermore, a 40% sequence identity cut-off
for protein homology is used instead of the present 30% and
the definition of the interaction surface is different from our
predictor, considering an a ll-atom protein r epresentation.
The network architecture is m ore complex and the input
code also includes s olvent accessibility. Although, for these
reasons, the accuracy of the two predictors cannot be
directly compared, t he dec lared probability of correct
predictions [ P(c)] is s omewhat lower (70%) than that
obtained in the present work (72%) when heterodimers
are predicted.
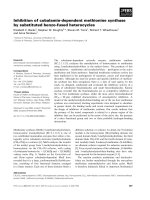
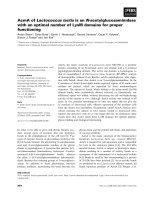
The a ccuracy distribution per protein achieved by our
predictor is shown i n Fig. 1. The bar graph indicates that
86% of the proteins of the set is predicted t o have a contact
surface with an accuracy higher than random. Noticeably,
66% of the proteins are predicted to have a contact surface
with an accuracy 20% higher than random.
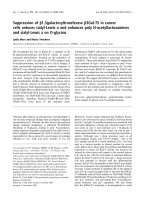
The distribution of the residues on the protein surfaces
(white bars in Fig. 2) in our selected database is compared
to that of those observed in the contact patch es (grey bars in
Fig. 2). As previously observed [17,18], in our selected set of
protein complexes the average composition of the interact-
ing surface patches is barely distinguishable from that of the
entire surface. Processing the input information to the
output by the network during the training phas e is,
however, sufficient for the predictor to capture with good
efficiency the relative difference between an in-contact a nd
not-in-contact residue. This is clearly indicated by the
Table 1. Scoring the efficiency of the neural network-based predictor.
Q2, number of correct predictions/num ber of total predictions.
C, correlation coefficient. P(x), number of correct predictions in class
x/number total predictions in class. Q(x), number of correct predic-
tions in class x/number total observed in class x.
Contact Noncontact
Q2 C P(c) Q(c) P(nc) Q(nc)
0.73 0.43 0.72 0.560 0.73 0.85
0
10
20
30
40
50
60
70
0.35 0.4 0.45 0.5 0.55 0.6 0.65 0.7 0.75 0.8 0.85 0.9 0.95
Accuracy (Q2)
Number of Proteins
Fig. 1. Bar graph showing the distribution of Q2 scores for the 226
protein chains of the selected set.
0
0.02
0.04
0.06
0.08
0.1
0.12
0.14
GLY
ALA
VAL
PHE
PRO
MET
ILE
LEU
SER
THR
TYR
HIS
CYS
ASN
GLN
TRP
ASP
GLU
LY S
ARG
Apolar Polar Charged
Residue
Frequency
Fig. 2. Bar graph showing the dist ributions of
apolar, polar and charged residues on the
observed contact surface (grey colour), on
the predicted contact surface (black), and on
the whole protein surface (white).
1358 P. Fariselli et al. (Eur. J. Biochem. 269) Ó FEBS 2002
distribution of the residues predicted to be in the contact
surface (black bars in Fig. 2). The pattern is similar to that
of the residue distribution both in the contact and in the
whole surface.
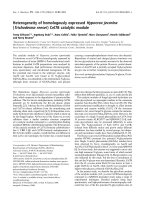
The dependence of the accuracy values and of the frac-
tion of total residues with a given accuracy on the reliability
index [34] of the prediction are shown i n Fig. 3 . It appears
that 70% of t he exposed residues are predicted with
reliability index ‡ 5 and an accuracy ‡ 80%.
The results shown in F ig. 3 i ndicate that also the P(c)
values are increasing at increasing reliability i ndex ( R).
The rate of false positives can be evaluated as [1-P(c, R)] and
is decreasing at increasing R values. When R ‡ 7, [1-P(c)]
decreases from 0.16 to 0.14. From t hese data, it can b e
computed that 6% of the exposed residues of our
database are falsely predicted to be in contact with a
reliability index ‡ 7. If we accept that the confidence o f the
prediction is a reliable i ndication of the p ropensity of a
residue to be located in an interacting patch or not, t he false
predictions may highlight a fundamental problem that
should be c onsidered. In the training set, some of the
exposed r esidues are classified a s false negative examples
because they are not part of a contact surface in the PDB.
However, they might be l ocated in putative interacting
patches not documented in our datab ase. According t o
recent data of cell-map proteomics [ 1–6], a given protein
may participate in co mplex interaction networks and
therefore it can be involved with two or more interaction
surfaces that are not documented in the PDB. When the Q2
value is computed, residues which are falsely predicted in
contact (false positives) decrease the a ccuracy. It can b e
speculated that in cases of false predictions with high values
of reliability index, by comparing with the presently
available data base of interacting complexes the accuracy
may be biased by the lack of knowledge of all the possible
protein interactions. If the false positives correspond to (or
include) false negatives of the training set, we are presently
computing a lower minimum value of the predictive
performance. Obviously, more structural data are necessary
to validate our speculation.
A blind test
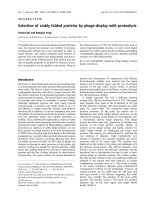
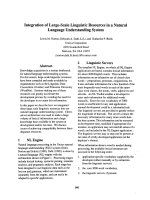
To test the applicability of this method, we predicted the
surface interacting sites of three structural components of
the Dnak molecular chaperone system (Fig. 4). The DnaK
(eukaryotic Hsp70) system is involved in many protein
folding and traffic processes i n the cell. The main compo-
nent of the system is DnaK, a t wo-domain protein with a
C-terminal domain responsible for the binding of unfolded
hydrophobic peptides and a N-terminal domain, which
binds ATP. This protein can bind and release peptides (in
the Ct domain) in a cycle driven by nucleotide hydrolysis
and exchange (in the Nt domain). The structures of both
0.7
0.75
0.8
0.85
0.9
0.95
1
0 1 2 3 4 5 6 7 8 9
Reliabilit
y
Index
Q2 and P(c)
0
0.1
0.2
0.3
0.4
0.5
0.6
0.7
0.8
0.9
1
Data Set Fraction
Q2
P(c)
Fig. 3. Q2 and P(c) scores as a function of the reliability index (R) o f t he
prediction. The fraction of the total predictions (h)isalsoshownat
increasing R values. Q2 (j) is evaluated as the number of correct
predictions over the total number of exposed residues in the data base
(¼ 31 910 resi dues); P(c) ( d) i s the number of residues correctly
predicted to be in contact over the number of predicted ones in the
interacting p atches at the d ifferent R values. [ 1-P(c,R)] is a n e stimate o f
the rate of false positives with a given R according to the predictive
method.
Fig. 4. Prediction of the interacting surface
for the three structural components of the
DnaK molecular chaperone system.
The structures of DnaK N-terminal and
C-terminal domains, that has been deter-
mined separately ( PDB codes 1dkg and
1dkx, r espectively), are shown a t the bottom.
The structure of the DnaJ J-domain (PDB
code 1xbl) is shown at the top. CA carbon s
of residues predicted at the putative interfa-
ces by the neural network are shown as
spheres depicted in blue. The peptide frag-
ment (enclosed in t he D naK Ct -domain) and
the nucleotide e xchange f actor G rpE p rotein
(co-crystallised with the Dnak Nt-domain)
are shown in red colour with thick back-
bone. The DnaJ conserved H PD motif is
showninyellow.
Ó FEBS 2002 Predicting protein–protein interaction sites (Eur. J. Biochem. 269) 1359
domains were determined separate ly [28 –30]. T heir inter-
action in the whole protein is not known although some
biochemical data highlight possible contact regions. The
third component of the system is the DnaJ protein, which
promotes nucleotide hydrolysis i n the DnaK Nt domain.
The DnaJ J-domain contains a highly conserved three-
residue motif (HPD; for review see [31]). For each of the
three structures, the n etwork predicts putative interacting
residues on the protein complexes (Fig. 4). For the DnaK
N-terminal domain (cocrystallised with the GrpE protein)
the predicted residues concentrate on subdomain I (right).
They map two regions, one at the top (subdomain Ib),
including contacts with GrpE, and another at the bottom,
where contacts with GrpE are absent (subdomain I a). For
the DnaK C-terminal thin domain, most of the p redictions
cluster i n t he same face and concentrate in the connection
with the Nt-domain, the last a helix and a central region
close to the peptide-binding site. For the DnaJ J-domain,
the predictions map close to the conserved HPD motif and
in the C-terminal a helix.
Some known biochemical data partially support our
blind predictions. For the DnaK Nt domain, most of the
mutants that a ffect interaction with the Ct d omain are
concentrated in sub domain I [38]. In particular, subdomain
Ia is the initial part of the Ct domain. This region undergoes
major structural changes during t he nucleotide hydrolysis/
exchange cycle and some mutants raised to avoid the
interaction with DnaJ are affected in this specific part of the
protein [39]. The other region (subdomain Ib) at the t op, is
close to t he ATP binding site; i t also e ndures major
structural changes dur ing the cycle a nd corresponds to the
multimerization site in the structural homologue actin [40].
Mutants described in the literature [39,41] support the
predicted regions.
For the DnaK Ct domain, a mutant has been described in
one of the predicted regions close to the peptide-binding site
[38]. For DnaJ, the conserved HPD motif is i mplicated in
the interaction with DnaK [41], and one of the residues of
the motif is also predicted by neural networks. As a whole,
the predicted residues indicate the expected and probable
regions of interaction, in agreement with the contacts with
GrpE and the results obtained from experiments with
mutants. The contact r egions predicted w ith our method
and t he implicit model of interaction can be tested b y
additional mutations, by solving the structure of some of the
complexes or by other experimental means.
CONCLUSIONS
We have analysed the possibility of predicting the residues
forming part of protein–protein interacting surfaces in
proteins of known structure. We have used two very basic
sources of information: evolutionary information as accu-
mulated in sequence profiles derived from family alignments
and surface patches in protein structures identified as sets of
neighbour residues exposed to solvent.
Training the neural n etwork with this information h as
revealed to be enough for predicting a significant number of
known protein surfaces with average accuracy of 73% of the
interacting residues correctly predicted.
This result is surprising, as previous work [17,18,37]
revealed very weak propensities of the interaction surfaces
both in geometrical, electrostatic, hydrophobic and
sequence based properties. The analysis of the information
captured by the network confirms these weak tendencies.
The predictor is presently available from t he authors
upon request.
ACKNOWLEDGEMENTS
Financial su pport t o t his work was provided by a g ran t of the Ministero
della Universita
`
e della Ricerca Scientifica e Tecnologica (MURST)
delivered to the project ÔStructural, Functional and Applicative
Prospects of Proteins from ThermophilesÕ.R.C.wasalsopartially
supported by a g rant for a target project in Biotechnology of the Italian
Centro Nazionale delle Ricerche (CNR). We thank the Italian
Ministero della Universita
`
e della Ricerca Scientifica e Tecnologica
and the Spanish Minister of the Research for supporting the joint
collaboration between Italy and Spain.
REFERENCES
1. Blackstock, W.P. & Weir, M.P. (1999) Proteomics: quantitative
and physical mapping of cellular proteins. Trends Biotechnol. 17,
121–127.
2. Mendelsohn, A.R . & Brent, R. (1999) P rotein interaction
methods – toward an endgame. Science 284, 1948–1950.
3. Uetz, P., Giot, L., Cagney, G., Mansfield, T.A., Judson, R.S.,
Knight, J.R., Lockshon, D., Narayan, V., Srinivasan, M.,
Pochart, P. et al. (2000) A Comprehensive analysis of protein–
protein interaction in Saccharomyces cerevisiae. Na ture 403,
623–627.
4. Walhout, A.J., Sordella, R., Lu, X., Hartley, J.L., Temple, G.F.,
Brasch, M.A., Thierry-Mieg, N. & Vidal, M. (2000) Protein
interacti on mapping in C. elegans using proteins involved in vulval
development. Science 287, 116–122.
5. Hubsman, M., Yudkovsky, G. & Aronheim, A. (2001) A novel
approach for the identification of protein–protein interaction with
integral membrane proteins. Nucleic Acids Res. 294,E18.
6. Rain, J., Selig, L., De Reuse, H., Battaglia, V., Reverdy, C.,
Simon, S., Lenzen, G., Petel, F., Wojcik, J., Schaechter, V., Che-
mama, Y., Labigne, A. & Legrain, P. (2001) The protein–protein
interactions map of Helicobacter pylori. Natur e 409, 211–215.
7. Enright, A.J., Iliopoulos, I., Kyrpides, N.C. & Ouzounis, C.A.
(1999) Protein interaction maps for complete genomes based on
gene fusion events. Nature 402, 86–88.
8. Marcotte, E.M., Pellegrini, M., Ho-Leung, N., Rice, D.W.,
Yeates, T.O. & Eisenb erg, D. (1999) D etecting protein function
and protein –protein interaction s from genome sequences. Science
285, 751–753.
9. Eisenberg, D., Marcotte, E.M., Xenarios, I. & Yeates, T.O. (2000)
Protein function in the post-genom ic era. Nature 405, 823–826.
10. Xenarios, I., Rice, D.W., Salwinski, L., Baron, M.K., Marcotte,
E.M. & Eisenberg, D. (2000) DIP: the Database o f Interacting
Proteins. N ucleic Acids Res. 28, 289–291.
11. Bader, G.D., D onaldson, I., Wolting, C., Ouellette, B .F.F.,
Pawson, T. & Hogue, C.W.V. (2001) BIND–The Biomolecular
Interaction Network Database. Nucleic Acids Res. 29, 242–245.
12. Chothia, C. & J anin, J. (1975) Principles o f protein-protein
recognition. Nature 256, 705–708.
13. Jones, S. & Thornton, J.M. (1997) Analysis of protein–protein
interaction sites using surface patches. J. Mol. Biol. 272, 121–132.
14. Jones, S. & Thornton, J.M. (1997) Prediction of protein–protein
interaction sites using surface patches. J. Mol. Biol. 272, 133–143.
15.Ponstingl,H.,Henrick,K.&Thornton,J.M.(2000)Dis-
criminating between homodimeric and monomeric proteins in the
crystalline state. Proteins 41, 47–57.
16. Valdar, W.S.J. & Thornton, J.M. (2001) Protein–protein inter-
faces: analysis of amino acid conservation in homodimers.
Proteins 42, 108–124.
1360 P. Fariselli et al. (Eur. J. Biochem. 269) Ó FEBS 2002
17. Lo Conte, L., Chothia, C. & Janin, J. (1999) The atomic structure
of protein–protein recognition sites. J. Mol. Biol. 285, 2177–2198.
18. Sheinerman, F.B., Norel, R . & Honig, B. (2000) Curr. Opin.
Struct. Biol. 10, 153–159.
19. Jones, S. & Thornton, J .M. (1996) Principles of protein–protein
interaction. Proc. Natl Acad. Sci. USA 93, 13–20.
20. Glaser, F., Steinberg, D.M., Vakser, I .A. & Ben-Tal, N. (2001)
Residue frequencies and pairing preferences at protein–protein
interfaces. Proteins 43, 89–102.
21. Sternberg, M.J.E., Gabb, H.A. & Jackson, R.M. (1998) Predictive
docking of Protein-protein and protein–DNA complexes. Curr.
Opin. Struct. Biol. 8, 250–256.
22. Casari, G., Sander, C. & Valencia, A. (1995) A method to predict
functional residues in proteins. Nat. Struct. Biol. 2, 171–178.
23. Pazos, F., Helmer-Citter ich, M., Ausiello, G . & Valencia, A .
(1997) Correlated mutations contain information about protein–
protein interaction. J. Mol. Biol. 271, 511–523.
24. Livingstone, C.D. & Barton, G.J. (1993) Protein s equence align-
ments: a strategy f or the h ierarchical analysis o f residue c on-
servation. Comput. Appl. Biosci. 6, 645–756.
25. Lichtarge, O., Bourne, H.R. & Cohen, F.E. (1996) An evolu-
tionary trace method defines binding surfaces common to protein
families. J. Mol. Biol. 257, 342–358.
26. Gallet, X., Charloteaux, B ., Thomas, A. & Brasseur, R. ( 2000)
A fast method to predict protein interaction sites from sequ ences.
J. Mol Biol. 302, 917–926.
27. Bock, J.R. & G ough, D .A. (2001) Predic ting protein–protein
interactions from primary structure. Bioinformatics 17, 455–460.
28. Zhu, X., Zhao, X., Burkholder, W.F., Gragerov, A., O gata, C.M.,
Gottesman, M .E . & Hendrickson, W. A. (1 996 ) S tructu ral analysis
of substrate binding by the molecular chaperone DnaK. Science
272, 1606–1614.
29.Pellecchia,M.,Szyperski,T.,Wall,D.,Georgopoulos,C.&
Wuthrich, K. (1996) NMR structure of the J-domain and the
Gly/Phe-rich region of the Escherichia coli DnaJ chaperone.
J. Mol. Biol. 260, 236–250.
30. Harrison, C.J., Hayer-Hartl, M., Di Liberto, M., Hartl, F. &
Kuriyan, J. (1997) Crystal structure of the nucleotide exchange
factor Grp E bound to the ATPase domain of the molecular
chaperone DnaK. Science 276, 431–435.
31. Bukau, B. & H orwich, A.L. ( 1998) The Hsp70 and H sp60
Chaperone Machines. Cell 92, 351–366.
32. Murzin, A.G., Brenner, S.E., Hubbard, T. & Chotia, C. (1995)
SCOP: a structural classification o f proteins database f or the
investigation of sequences and structures. J. Mol. Biol. 247,
536–540.
33. Kabsch, W. & Sander, C. (1983) Dictionary of protein secondary
structure: pattern of hydrogen-bon ded and ge ometrical featu res.
Biopolymers 22 , 2577–2637.
34. Rost, B. & Sander, C. (1994) Conservation and prediction of
solvent accessibility in protein fa milies. Proteins 20, 216–226.
35. Rumelhart, D.E., Hinton, G.E. & Williams, R.J. (1986)
Learning representations by back-propagating errors. Nature 323,
533–536.
36. Dodge, C., Schneider, R. & Sander, C. (1998) The HSSP database
of protein structure-sequence alignments and f am ily profiles.
Nucleic Acids Res. 26, 313–315.
37. Zhou, H.X. & Shan, Y. (2001) Prediction of protein interaction
sites from sequence profile a nd residue neighbor list. Proteins 44,
336–343.
38. Davis, J.E., Voisine, C. & Craigh, E.A. (1999) Intragenic sup-
pressors of Hsp70 mutants: Interplay between the ATPase- a nd
peptide-binding domains. Proc.NatlAcad.Sci.USA96, 9269–
9276.
39. Gassler, C.S., B uchberge r, A., La ufen , T., Ma yer, M.P., Schroder,
H., Valencia, A. & Bukau, B. (1998) Mutations in the DnaK
chaperone affecting interaction with the DnaJ cochaperone. Proc.
Natl Acad. Sci. USA 95, 15229–15234.
40. Montgomery, D.L., Morimoto, R.I. & G ierasch, L.M. (1999 )
Mutations in the substrate binding domain of the Escherichia coli
70 kDa molecu lar ch aperon e, DnaK , which a lter s ubstrate a ffinity
of interdomain coupling. J. Mol. Biol. 286 , 915–932.
41. Suh, W .C., Burkholder, W.F., Lu, C.Z., Zhao, X., Gottesman,
M.E. & Gross, C.A. ( 1998) Interaction of the Hsp70 molecular
chaperone, DnaK, with its cochaperone DnaJ. Biochemistry 95,
15223–15228.
Ó FEBS 2002 Predicting protein–protein interaction sites (Eur. J. Biochem. 269) 1361