Tài liệu Báo cáo Y học: Caged O2 Reaction of cytochrome bo3 oxidase with photochemically released dioxygen from a cobalt peroxo complex doc
Bạn đang xem bản rút gọn của tài liệu. Xem và tải ngay bản đầy đủ của tài liệu tại đây (352.19 KB, 8 trang )
Caged O
2
Reaction of cytochrome
bo
3
oxidase with photochemically released dioxygen
from a cobalt peroxo complex
Claudia Ludovici, Roland Fro¨ hlich*, Karsten Vogtt, Bjo¨ rn Mamat† and Mathias Lu¨ bben
Lehrstuhl fu
¨
r Biophysik, Ruhr-Universita
¨
t Bochum, Germany
We developed the synthesis of the caged oxygen donor
(l-peroxo)(l-hydroxo)bis[bis(bipyridyl)cobalt(III)] complex
(HPBC) as nitrate salt, which has, compared with the
perchlorate-form described previously [MacArthur, R.,
Sucheta, A., Chong, F.F. & Einarsdottir, O
¨
. (1995) Proc.
Natl Acad. Sci. USA, 92, 8105–8109], greatly enhanced
solubility. Now, the quantum efficiency of the photolytical
release of dioxygen was determined to be 0.4 per photon at a
laser wavelength of 308 nm, which was used to observe
biological reactions. The X-ray structure of HPBC has been
solved, and the molecular interactions of photochemically
generated oxygen with cytochrome oxidase were investi-
gated with optical and FT-IR spectroscopy: it acts as
acceptor of electrons transferred from prereduced cyto-
chrome bo
3
, the heme-copper oxidase from Escherichia coli.
FT-IR spectra revealed typical absorbance difference chan-
ges in the carbonyl region of cytochrome bo
3
, supported by
bandshifts due to solvent isotope exchange and by assign-
ment using site-directed mutants. IR difference spectra of the
photooxidation reaction using the caged oxygen compound,
and of the photoreduction reaction using the caged electron
donor FMN, have inverted shapes. The spectroscopic sig-
nals of carboxyl groups are thus equivalent in both reactions:
the use of chemically produced oxygen allows the observa-
tion of the ongoing molecular changes of cytochrome bo
3
oxidase under quasi-physiological conditions.
Keywords: cytochrome oxidase; caged compound; FT-IR
spectroscopy; oxygen, l-peroxo cobalt complex.
Cytochrome oxidases are hetero-oligomeric integral mem-
brane proteins that belong to the superfamily of heme-
copper oxidases [1,2]. They are terminal parts of the aerobic
respiratory chains of bacteria and mitochondria, and their
common characteristic is the transfer of electrons from
cytochrome c or ubiquinol to the acceptor substrate,
molecular dioxygen [3]. Cytochrome bo
3
oxidase of
Escherichia coli is a ubiquinol oxidase. It transfers electrons
fromthemembranesiteviahemeb to the binuclear reaction
center, which consists of a heme o plus a Cu
B
as redox
carriers. The reaction center provides the binding site of
molecular oxygen, which receives electrons and protons
necessary for water formation. The electronic energy is
sufficient to drive transmembrane proton transport, which
is tightly coupled to the processes of oxygen reduction and
of water formation [4,5].
X-ray structure data of ubiquinol oxidase from Escheri-
chia coli have been recently published. The resolution of
3.5 A
˚
allows the reconstruction of the backbone but not of
the amino-acid side chain conformations [6]. Detailed
molecularstructuresofthecytochromec oxidases from
Paracoccus denitrificans and beef heart mitochondria [6–10]
have been determined. Due to their extensive sequence
similarities these structures could serve as models for the
ubiquinol oxidase. They allow the prediction of two
different proton-translocating channels, called the K- and
D-channels. The D-channel contains an array of charged or
polar amino acids, and is located within two different
hydrogen-bonded networks above and below the central
Glu286 (numbering according to the subunits I and II of the
E. coli oxidase), which interacts with the binuclear center
[11]. Molecular dynamics calculations [12,13] have predicted
a special role of the central Glu286, which could provide the
contact between both partial networks. FT-IR difference
spectroscopy, using either an electrochemical cell [14,15] or
photoreduction techniques [16,17] provides information
about the orientation of amino-acid side chains and about
molecular interactions. The photoreduction experiments are
designed in such a way, that pre-equilibrated molecules
become activated by light to undergo redox changes. Out of
the many functional groups present in the oxidase, only
those affected by the redox transition become visible in
FT-IR difference spectra. In a previous report, the band
signature at 1745 cm
)1
and at 1735 cm
)1
occurring in redox
FT-IR difference spectra of different heme-copper oxidases
has been assigned to Glu286 [17].
In order to study the oxidase reaction with the natural
substrate dioxygen at the molecular level with FT-IR
spectroscopy, we established a caged dioxygen system that
allows O
2
release via photolysis. Photoactivation of
(l-peroxo)(l-hydroxo)bis[bis(bipyridyl)cobalt(III)] complex
Correspondence to M. Lu
¨
bben, Lehrstuhl fu
¨
r Biophysik,
Ruhr-Universita
¨
t Bochum, Universita
¨
tsstr. 150,
D-44780 Bochum, Germany
Fax: + 49 234 32 14626, Tel.: + 49 234 32 24465,
E-mail:
Abbreviations: HPBC, (l-peroxo)(l-hydroxo)bis[bis(bipyridyl)-
cobalt(III)]; BC, bis(2,2¢-bipyridyl)cobalt(II).
*Present address: Organisch-chemisches Institut, Universita
¨
tMu
¨
nster,
Correnstraße 40, D-48149 Mu
¨
nster, Germany.
Present address: Max-Planck-Institut fu
¨
rBiophysik,
Heinrich-Hoffmann-Str. 7, D-60528 Frankfurt/Main, Germany.
(Received 18 January 2002, revised 15 April 2002,
accepted 19 April 2002)
Eur. J. Biochem. 269, 2630–2637 (2002) Ó FEBS 2002 doi:10.1046/j.1432-1033.2002.02944.x
(HPBC) has been described previously, but the reported
chemical (a perchlorate salt) had rather low solubility and
the photochemical conditions were very unfavorable
[18,19]. Due to the strong IR absorbance of water, it is
desirable that the FT-IR samples consist of thin and
highly concentrated protein films. Hence a highly soluble
and stable HPBC complex had to be used in order to
release enough dioxygen to circumvent the possible
problem of substrate limitation. In this study, we describe
the synthesis of a highly soluble HPBC salt and its
(photo)chemical characterization, and we demonstrate the
validity of the caged oxygen complex (HPBC-nitrate salt)
as a suitable probe for FT-IR spectroscopic studies of
cytochrome bo
3
.
MATERIALS AND METHODS
Synthesis of the HPBC-perchlorate salt
Solutions were prepared of 2.33 g of Co(NO
3
)
2
Æ6H
2
Oin
20 mL of water and of 2.5 g of 2,2¢-bipyridine in 20 mL
ethanol. The pH was adjusted with 1
M
NaOH to 9.2. The
following reaction steps were carried out in the dark. Under
stirring, oxygen was streamed into the reaction vessel for
10 min. The pH of the mixture was readjusted to 9.6, and
oxygen streaming was continued for another 20 min. For
crystallization, 2.2 mL of a 6
M
sodium perchlorate solution
in 50% (v/v) of aqueous ethanol was added and the mixture
was kept for 16 at 10 °C. Black crystals were filtered with
suction, washed with ice-cold ethanol and dried under
vacuum for at least 3 h. The molar yield of solvent-free salt
was 73%. IR(KBr): 1088 cm
)1
and 625 cm
)1
(perchlorate),
855 cm
)1
m(O-O). UV/vis: k
max
: 460 nm, 395 nm
(7100
M
)1
Æcm
)1
), 314 nm (43 300
M
)1
cm
)1
), 304 nm and
212 nm.
Synthesis of the HPBC-nitrate salt
Co(NO
3
)
2
Æ6H
2
O (2.33 g) and of 2,2¢-bipyridine (2.5 g) were
both dissolved separately in 30 mL ethanol. The following
steps where performed in the dark. The two solutions were
combined and 170 mg solid NaOH, dissolved in 215 lLof
water, was added. A stream of oxygen was bubbled into
the liquid for 30 s. The reaction mixture was shaken at
37 °C for each 5 min at 100, 50 and 25 revolutions per min
on a rotary platform; for crystallization it was kept at
30 °C for at least 12 h in the dark. Crystals were collected
on a sintered glass funnel, washed with 20 mL of ethanol
and dried for 6 h by desiccation. The product (yield: 70%)
was stored at )20 °C. IR(KBr): 1380 cm
)1
(nitrate),
855 cm
)1
m(O-O). UV/vis: k
max
: 460 nm, 395 nm
(7100
M
)1
cm
)1
), 314 nm (43 300
M
)1
Æcm
)1
), 304 nm and
212 nm.
Synthesis of the bis(2,2¢ -bipyridyl)cobalt(II)
(BC)-perchlorate salt
Co(NO
3
)
2
Æ6H
2
O(2mLof0.2
M
in water) and 2,2¢-bipyri-
dine (2 mL of 0.4
M
in ethanol) were mixed and 6 sodium
perchlorate solution in 50% (v/v) of aqueous ethanol was
added to a final concentration of 2 and the mixture was kept
for 16 h at 10 °C. The yellow hexagonal crystals formed
were collected as described above. UV/vis: k
max
:293nm.
Determination of the molar yield of photolytical
oxygen release
HPBC-nitrate salt (20 mg) and EDTA (100 mg) were
placed into a stoppered glass vessel of a total volume of
about 120 mL. It was filled to the edge with bidistilled
water, 1 mL of a 3
M
NaI solution in 40% (w/v) NaOH and
1 mL of 40% (w/v) MnCl
2
solution were added. Another
reaction vessel without added HPBC-nitrate salt served as
reference. To attain completion of the photolytic reaction,
the compound (which was kept in the non-UV-transmitting
glass bottle) had to be irradiated with visible light emitted by
a workshop-made lamp arrangement for several hours.
Measurement of dissolved plus photolytically liberated
oxygen was chemically determined in sample and reference
mixtures according to the Winkler titration technique [20].
Crystallization and X-ray structure determination
For crystal structure determination, data sets were collected
with a Nonius KappaCCD diffractometer, equipped with a
rotating anode generator Nonius FR591. The following
computer programs were used for different steps data
recording and evaluation:
COLLECT
for data collection
(Nonius BV),
DENZO
-
SMN
for data reduction [21],
SORTAV
for absorption correction [22,23],
SHELXS
-7 for structure
solution [24],
SHELXL
-7 for structure refinement (G. M.
Sheldrick, Universita
¨
tGo
¨
ttingen, Germany),
DIAMOND
for
the graphic display of structures (K. Brandenburg, Univer-
sita
¨
t Freiburg, Germany).
Determination of quantum yield of oxygen release
The quantum yield of the photorelease of molecular oxygen
from HPBC was determined after quantification of the
photon flux emitted by a Xe lamp at different wavelengths
by means of the chemical actinometer compound Aber-
chrome 540 [25]. The samples were placed in 1-cm stirred
cuvettes and were irradiated with monochromatic light for
defined time intervals to correct for wavelength-dependent
emission intensities. The numbers of incident photons and
the photolytic turnover were quantified by static UV/vis
spectroscopy by measurement of the absorbance changes of
Aberchrome 540 dissolved in toluene at 494 nm and of
HPBC dissolved in 100 m
M
KP
i
pH 7.4 at 293 nm. At high
concentrations of HPBC, the absorbance change at 390 nm
was also used to quantify the photolytic yield.
Preparation of duroquinol-reduced samples
for visible spectroscopy and FT-IR spectroscopy
and recording of UV/vis spectra
Cytochrome bo
3
was expressed using the vector pHCL [17]
and purified using Ni-agarose chromatography exactly as
described previously [26]. Optical absorbance spectra of
cytochrome bo
3
in the presence of caged oxygen were
performed using workshop-made CaF
2
cuvettes constructed
for FT-IR spectroscopy (see below). Sample preparations
were carried out under an Ar atmosphere in a plastic
container (Atmosbag, Sigma) equipped with grips for better
sample handling. A small volume (2.5 lL) of a 10 m
M
ethanolic solution of 10 m
M
duroquinol was pipetted on the
center of a CaF
2
window, covered perimetrically with a thin
Ó FEBS 2002 Caged oxygen reaction with cytochrome oxidase (Eur. J. Biochem. 269) 2631
layer of grease (Apiezon). After evaporation of the solvent
the duroquinol was redissolved with 2–3 lL of a concen-
trated cytochrome bo
3
solution (about 0.3 m
M
)in20m
M
Tris/HCl, pH 8.0, 0.3% (w/v) b-decylmaltoside. The mix-
ture was concentrated in an Ar stream. The dried layer was
rehydrated with 3 lL100m
M
sodium borate, 1 m
M
EDTA, 0.1% b-decylmaltoside, pH 9.0. Again the mixture
was concentrated under Ar and it was finally redissolved by
adding 0.5 lLof10m
M
HPBC in borate buffer. The
cuvette was sealed with another CaF
2
plate, and placed into
a metallic sample holder. The following cuvette handling
was carried out in the aerobic atmosphere. The absorbance
spectra of the mixture before and after irradiation with a
150- Xe arc lamp (Oriel) or LPX 240i excimer laser
(Lambda Physics, Go
¨
ttingen) were measured with a Hitachi
UV/vis spectrometer.
Preparation of thiol-reduced samples
of cytochrome
bo
3
The samples were prepared in a workshop-constructed
glass chamber equipped with plate holders for sample and
counter CaF
2
plates (technical details will be described
elsewhere). Volumes of 2.5–3.5 lL of 0.2–0.3 m
M
cyto-
chrome bo
3
solution (as above) were pipetted on a greased
CaF
2
sample plate and mixed with 1 lLofa20m
M
freshly
prepared dithiothreitol solution in 20 m
M
Tris, pH 8.0,
0.3% (w/v) b-decylmaltoside, and the mixture was spread
to a spot of 5-mm diameter. The chamber was assembled
and a CaF
2
counter plate, spotted with a 0.5-lLdropof
20 m
M
HPBC dissolved in glycerol, was placed in position
opposite to the sample plate. The chamber was evacuated
for 2 min to a residual pressure of 10–50 mbar to allow
dehydration of the sample and formation of a thin film,
which was re-equilibrated with aqueous vapor from a water
reservoir for 30 s. Sample and counter plates were then
pressed together, which resulted in efficient mixing of the
reduced protein with the caged oxygen compound. The
cuvette was sealed airtight and kept at 4 °C until
measurement.
Recording of FT-IR spectra
Static IR spectra were recorded with a Bruker 66V/S
spectrometer, evacuated to 8–10 mbar residual pressure.
The sample containment, maintained at 4 °C, was purged
with dry air to minimize absorbance by water vapor. A
water-cooled globar was used as source of radiation, which
was measured by a nitrogen-cooled HgCdTe detector, using
a low-pass filter which cut off intensity above 1975 cm
)1
.
The scanner mirror was moved in the single-sided mode to
achieve a scan rate of 100 kHz. Spectra were measured at
nominal resolution of 2 cm
)1
, Mertz phase correction was
adjusted and the Blackman–Harris three-term function was
used for apodization. If not otherwise indicated, reference
spectra of 800 coadded scans was recorded. The sample
photolysis was initiated by application of 15 flashes (90–
140 mJ) of light with a pulse length of 20–30 ns at 308 nm
from an LPX240i excimer laser (Lambda Physics, Go
¨
ttin-
gen), and 800 scans were coadded. To verify that the redox
reaction of protein molecules was complete, a second
spectrum was recorded as above (without reference meas-
urement) after application of another 15 laser flashes.
Double difference calculations were carried out using the
OPUS
software. In order to normalize distinct spectra, the
absorbance difference bands of caged oxygen at 1443 and
1451 cm
)1
were brought to the same scale.
Redox spectra with flavine mononucleotide as caged
electron donor
Sample preparation and recording of FTIR spectra was
carried out as described previously [16].
Enzyme activity test
Quinol oxidase activity using duroquinol as artificial
substrate of cytochrome bo
3
was performed as described
previously [26].
RESULTS
Synthesis of the HPBC complex
After Skurlatov [27] introduced the dibridged dinuclear
complex HPBC, MacArthur used this compound as a very
poor photoactivatable donor of dioxygen; the photolytic
quantum yield was as low as 0.04 if the irradiation was
carried out at 355 nm [18]. However, in our hands the
published preparation protocol for the HPBC-perchlorate
salt yielded a product that was contaminated with up to
70–80% of the mononuclear Co(II) species, BC-perchlorate.
Therefore we established a highly reproducible procedure,
in which the pure perchlorate salt could be obtained at
> 70% molar yield. The final product could be gained
readily by precipitation of the perchlorate salt; this implies
that low solubility in water is an inherent property of the
HPBC-perchlorate salt preparation and is a major limiting
factor for the maximum oxygen concentration attainable by
photo-release.
For FT-IR difference spectroscopy of cytochrome oxid-
ases, it is necessary to adjust high levels of molecular
dioxygen; thus a derivative with much higher solubility had
to be synthesized. To this purpose we prepared the nitrate
salt of the HPBC complex, which is about 10
3
times more
soluble in water than the perchlorate complex.
Crystallization and X-ray structure determination
In order to determine the HPBC-perchlorate and -nitrate
structures, crystallization trials were set up by mixing
solutions of HPBC-nitrate salt with various different anions
such as tetrafluoroborate and perchlorate. By use of the
precipitation/ether diffusion technique, well-ordered large
monoclinic crystals (space group P2
1
/c) suitable for X-ray
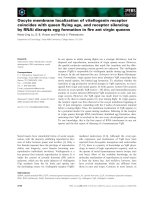
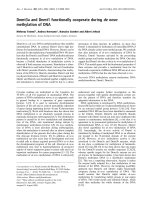
diffraction (Fig. 1) were obtained with perchlorate. Both Co
centers have octahedral coordination and are connected by
l-hydroxy and l-peroxo bridges. The bond distances
[Co-l(O) 1.868 (± 0.005) A
˚
and 1.877 (± 0.004) A
˚
,
respectively, l(O)-l(O) 1.415 (± 0.006) A
˚
] of the bridging
core are very similar to that of the corresponding ethylendi-
amine complex [28] except the l(O)–l(O) distance, which is
significantly smaller (at the short end of the usual range for
binuclear l-peroxo complexes) [29]. The cation structures of
the HPBC-nitrate salt and the -perchlorate salt complexes
were identical; the nitrate complex yielded a somewhat
2632 C. Ludovici et al. (Eur. J. Biochem. 269) Ó FEBS 2002
higher R value due to disordering of the nitrate groups and
solvent molecules included in the crystal (data not shown).
Spectroscopical and photochemical
properties of HPBC
The perchlorate and nitrate salt of HPBC had identical
optical absorbance spectra with maxima at 212, 304, 314,
395 nm and a shoulder at 460 nm (Fig. 2, insert), which
indicates that it is the cation which determines the optical
properties. In contrast to the published extinction coeffi-
cientof1540
M
)1
Æcm
)1
at 390 nm [30], we measured a
value of 7000
M
)1
Æcm
)1
based on a molecular mass of
977 gÆmol
)1
for the trinitrate salt of the HPBC complex.
If it is assumed that possible impurities might contribute
to the weighted mass, an even higher numerical value of
the extinction coefficient is expected. Thus the quantities
of molecular oxygen reported to be photoreleased by
others [18] must have been overestimated by a factor of at
least 4, if calculated with the low published extinction
coefficient (1540
M
)1
Æcm
)1
for 390 nm, 1350
M
)1
Æcm
)1
for 355 nm [18]). HPBC could be photolyzed efficiently by
UV light from different sources, e.g. transilluminator
(mercury lamp), Xe lamp or UV laser. In all cases, the
end product of the photolytic reaction had absorbance
maxima of 230, 293, 304 nm, identified to be the
mononuclear BC. The amount of photolytically released
oxygen was ascertained to be 100% by UV/vis spectros-
copy. As an independent check of molar yield, the
production of O
2
was determined iodometrically accord-
ing to Winkler [20] to about 80%; these data confirm our
revision of the published extinction coefficient as pointed
out above. The experiment demonstrates that the photo-
release of dioxygen from HPBC virtually has a stoichi-
ometry of 1.
The uncaging reaction has to be very efficient in order to
make HPBC a useful photo-trigger. With the irradiation
wavelength of 355 nm a quantum yield of as low as 0.04 was
reported previously [18]. We expected better photolytic
yields at shorter wavelengths due to the higher extinction
coefficient of the compound as it becomes evident from
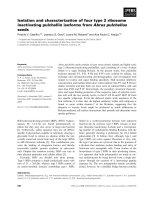
Fig. 2. A quantum yield of 0.5 was obtained, if the oxygen
release was activated by irradiation at 314 nm.
To investigate the potential for measuring time-resolved
reactions of the released oxygen, transient photoactivation
at 308 nm was probed with a single flash from an eximer
laser source. Figure 3 displays the dependence of single-
shot induced product formation on the total concentra-
tion of HPBC. The photolysis led to a yield of almost
100% at a concentration of 0.5 m
M
HPBC. This corres-
ponds to the same concentration of liberated dioxygen,
which caused gas bubble formation due to the limited
solubility of oxygen in aqueous medium. At higher
HPBC concentrations the O
2
yields decreased because the
high UV absorbance leads to a pronounced Ôinner filter
effectÕ of the samples. Even higher oxygen concentrations
could be attained by the use of thinner cuvettes, by
lowering of temperature and by variation of the solvent
composition.
Fig. 2. Determination of the quantum yield of photolytic reaction of
HPBC and concomitant oxygen release. Samples were irradiated with
monochromatic light at different times to correct for the wavelength-
dependent photon fluxes. The numbers of incident photons were
determined with a chemical actinometer compound. Molecular yields
of HPBC photolysis were quantified spectrophotometrically, these
numbers were equivalent to the amounts of oxygen released. Inset:
optical spectra of HPBC before and after photolysis by continuous
irradiation at 314 nm with a Xe lamp at low intensity.
Fig. 1. X-ray structure of the HPBC complex. Structure analysis of
the HPBC-perchlorate salt (deposited under accession no. CCDC
169345 at the Cambridge Crystallographic Data Centre): Formula
C
40
H
33
N
8
O
3
CoÆ3ClO
4
ÆH
2
O, m ¼ 1107.97, black crystal with dimen-
sions 0.50 · 0.30 · 0.20 mm; a ¼ 23.541(1), b ¼ 16.353(1), c ¼
11.377(1) A
˚
, b ¼ 96.71(1)°, V ¼ 4349.8(5) A
˚
3
, q
calc
¼ 1.692gcm
)3
,
l ¼ 10.31 cm
)1
, empirical absorption correction via
SORTAV
(0.627 £ T £ 0.820), Z ¼ 4, monoclinic, space group P2
1
/c no. 14);
k ¼ 0.71073 A
˚
, T ¼ 198 K, x and / scans, 31572 reflections collected
(± h,±k,±l), [(sinh)/k] ¼ 0.67 A
˚
)1
, 10625 independent (R
int
¼
0.038) and 9456 observed reflections [I ‡ 2 r(I )], 625 refined param-
eters, R ¼ 0.097, wR
2
¼ 0.267. The maximal residual electron density
was 1.90 () 1.04) eÆA
˚
)3
in the region of the perchlorate groups; the
perchlorate groups are disordered (disorder was not refined). The
hydrogen on the bridging oxygen was obtained from difference Fourier
calculations, other hydrogens were calculated and refined riding.
Ó FEBS 2002 Caged oxygen reaction with cytochrome oxidase (Eur. J. Biochem. 269) 2633
Reaction of HPBC with cytochrome
bo
3
: visible
spectral region
HPBC photochemistry was employed to explore the
electron transfer from fully reduced cytochrome bo
3
oxidase
to photo-released dioxygen; the reaction was monitored by
optical absorbance spectroscopy. Because of the intention
to eventually study the interactions by IR spectroscopy (see
below), the experiments were carried out in FT-IR spectro-
meter-type CaF
2
cuvettes at a sample thickness of equal or
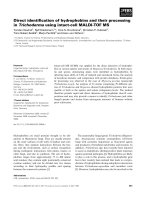
less than 5 lm. The visible spectrum of reduced cyto-
chrome bo
3
exhibits a broad Soret peak at 425 nm and
bands at 530 and 560 nm in the dark. Upon irradiation with
a Xe lamp (Fig. 4) or with an excimer laser after 15 laser
flashes at 308 nm with an intensity of 90–140 mJ per pulse
(data not shown), typical oxidized spectra are found with
the Soret peak shifted to 409 nm and absorbance loss at
higher wavelengths (Fig. 4). The integrity of the protein
sample after irradiation was also checked with SDS/PAGE.
If HPBC is irradiated in the absence of protein, no
pronounced peaks contributed within the investigated
spectral region before or after photolysis. As being a
prerequisite for sample stabilization during longer periods in
FT-IR experiments, the spectrum of reduced cyto-
chrome bo
3
oxidase in presence of HPBC remained
unchanged in the dark after incubation for 48 h at 4 °C.
It is now possible to observe the oxidation of the fully
reduced oxidase in situ through dioxygen release from
HPBC after photolysis.
Reaction of HPBC with cytochrome
bo
3
: IR spectral region
FT-IR spectra were recorded to study the molecular details
of the reaction of caged oxygen and cytochrome bo
3
.The
protein was reduced with the quasi-natural substrate analog
duroquinol. The samples reached a stable baseline after
2–4 h at 4 °C, and the completeness of caged oxygen
photolysis was checked using bundles of 15 laser flashes.
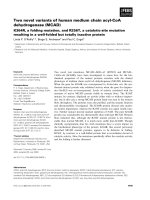
The spectrum (Fig. 5A) shows a composite of difference
spectra (light ) dark) from cytochrome bo
3
plus caged
oxygen before and after the photoreaction. The initial and
final states of these static spectra could be classified as to
oxidized cytochrome bo
3
/‘oxygen-free HPBC’ (absorbances
deflecting upwards) and to reduced cytochrome bo
3
/‘oxy-
gen-bound HPBC’ (absorbances deflecting downwards), as
assessed by the optical spectra before and after photo-
irradiation of the sample cuvette. The absorbance peaks of
HPBC at 1443/1451 cm
)1
and at 1600/1612 cm
)1
stand out
clearly. Sharp difference bands (at 1657 cm
)1
, 1678 cm
)1
)
Fig. 3. Yield of photolysis after single flash activation by excimer laser
at 308 nm, 160 mJ per pulse. The solutions of HPBC were prepared in
FT-IR type sample cuvette with 500-lm thickness. Yields were
determined from the absorbance changes at 293 nm.
Fig. 4. Reaction of cytochrome bo
3
fully reduced by the substrate dur-
oquinol with HPBC. Absorbance spectra of reduced cytochrome bo
3
in
presence of HPBC in the dark and after photolysis with Xe lamp were
measured, as described in Materials and methods. The corresponding
spectra of HPBC in the absence of protein are included.
Fig. 5. Reaction of duroquinol-reduced cytochrome bo
3
with photore-
leased dioxygen, monitored by FT-IR spectroscopy (0.85 lmol
cytochrome resuspended in 20 m
M
Tris/HCl pH 8.0, 50 m
M
NaCl,
0.3% b-decylmaltoside, reduced with 2.5 nmol duroquinol. After
reduction, 4.5 nmol HPBC resolved with 100 m
M
borate pH 9.0, 0.1%
b-decylmaltoside, 1 m
M
EDTA was added. Photolysis conditions:
110 mJ per pulse, 308 nm, XeCl-excimer laser, spectra taken after 15
flashes. (A) The (light ) dark) difference spectrum is shown. (B) As a
control, the same experiment as in (A) was carried out, except that
duroquinone instead of duroquinol was added. (C) The double
difference spectrum between (A) and (B) was calculated, yielding the
effect of the protein reaction alone.
2634 C. Ludovici et al. (Eur. J. Biochem. 269) Ó FEBS 2002
can be seen also in the amide I region, indicating conform-
ational alterations elicited by the redox transition. In the
carbonyl region one can clearly distinguish positive bands at
1745 and at 1696 cm
)1
. Oxidized cytochrome bo
3
equili-
brated with duroquinone and HPBC was photolyzed in a
control experiment (Fig. 5B). The net reaction by the caged
compound itself could be measured; the difference spectra
looked similar to that obtained by the pure HPBC complex
itself. The prominent difference bands at 1443/1451 cm
)1
and 1600/1612 cm
)1
were used to scale the spectra for better
comparison. In order to obtain the redox difference spectra
of the protein itself, one has to subtract the background
from the composite spectrum. Figure 5C displays the
double difference spectrum (A minus B): above 1690 cm
)1
it is dominated solely by the spectral response of the protein.
Dithiothreitol can be used as an artificial reductant of
cytochrome bo
3
. Figure 6 (top) shows a redox difference
spectrum resulting from the reaction of dithiothreitol-
reduced cytochrome bo
3
with caged oxygen. Absorbance
patterns in the spectral region below 1670 cm
)1
are variable
to some extent, because of the high absorption in the amide
regions due to variable protein concentration and to the
residual amounts of water. The carbonyl region of the
spectrum is mostly unaffected by the HPBC difference
bands (Fig. 5B); the uncorrected data yielded the same
difference band pattern if the spectral transition was
recorded with either reductant. The use of dithiothreitol-
reduced samples was found to be more practical, because it
allowed the preparation of samples in presence of atmo-
spheric oxygen. It is important to adjust for low water
content for two reasons: (a) water is a strong absorber of IR
radiation and (b) a considerable amount of solvent is
mobilized by oxygen bubble formation upon photolysis of
HPBC at higher concentrations, which critically affect the
sample stability.
FT-IR spectra of photoreduction and photooxidation
In order to validate the redox difference FT-IR signals
obtained from the oxidation reaction with caged dioxygen,
spectra were compared with those obtained by the reverse
reaction triggered by Ôcaged electronÕ FMN [16,17]. The
difference FT-IR spectrum obtained in Fig. 6 (bottom)
shows the typical redox pattern expected for the carbonyl
region of the oxidase; it has the strong negative band at
1696 cm
)1
and the prominent carbonyl feature at 1745/
1735 cm
)1
, which had been assigned to Glu286 in previous
spectra [17]. The difference spectra in the carbonyl region,
generated by either FMN (reduced ) oxidized) or HPBC
(oxidized ) reduced) appear to be reciprocal, which dem-
onstrates the equivalence of informational content from
both experiments.
Time resolution of the reaction of photochemically
released oxygen with cytochrome
bo
3
An efficient caged compound has to provide oxygen very
quickly. Time-resolved measurements of cytochrome oxid-
ase kinetics have been successfully carried out with the flow-
flash method, by observation of heme absorbance [31–35].
HPBC-released dioxygen has been used to measure the
kinetics of optical heme absorbance with reduced cyto-
chrome c oxidase [19].
In preliminary experiments, the photoirradiation of the
caged compound with a single laser flash led to formation of
a stable absorbance line after 1 ls, which is the time
resolution limit of the apparatus used. It may be assumed
that oxygen is liberated in parallel to the absorbance change
of the caged compound itself. The relevant lower time-limit
could be estimated by reaction of photo-released oxygen
with different heme proteins: if 5 l
M
duroquinol-reduced
cytochrome bo
3
is exposed to low concentrations of caged
oxygen, a flash-induced transient of absorbance decrease at
430 nm is observed, which is indicative of heme oxidation.
The kinetic traces are complex and exhibit half-lives of about
1 ms, which was evaluated without application of spectral
deconvolution analysis. Using the oxygenation of myoglo-
bin as a different indicator, significant flash-induced
absorbance changes were recordable even after only
100 ls. This demonstrates that the chemical formation of
oxygen from its precursor was definitely not a rate-limiting
step in the reaction of cytochrome bo
3
.
DISCUSSION
Absorbance changes in the IR region provide information
about individual steps of the partial reactions of cytochrome
oxidase (and presumably also of other oxygen-binding
proteins) at the molecular level. The strong absorbance of
the solvent water is a problem inherent to this spectroscopic
technique, which has to be carried out with highly
concentrated samples layered in very thin aqueous films.
In the study of oxidases, this need is in conflict with the
requirement of efficient mixing of reactants, such as
provided by the stopped-flow type apparatus used in flow-
flash experiments. The fundamental problem is overcome
by delivery of molecular oxygen via photo-triggering of the
organometallic oxygen precursor compound HPBC. High
concentrations of oxygen could be obtained, because the use
of the HPBC nitrate salt as obtained from our preparation
does not have the severe solubility problem of the
perchlorate derivative.
In an extension of earlier experiments with the heme
proteins hemoglobin [18] and with cytochrome c oxidase
Fig. 6. Comparison of the redox difference FT-IR spectra of cyto-
chrome bo
3
in the carbonyl region generated by FMN (bottom spectrum)
and by caged dioxygen (top spectrum), using a sample containing 1 nmol
dithiothreitol-treated cytochrome bo
3
and 10 nmol HPBC dissolved in
glycerol.
Ó FEBS 2002 Caged oxygen reaction with cytochrome oxidase (Eur. J. Biochem. 269) 2635
[19] by optical spectroscopy, it was demonstrated in this
work that the dioxygen photoreleased by HPBC acts as
electron acceptor of cytochrome bo
3
. Pre-reduction of the
enzyme with thiol compounds was the most favorable
sample preparation method. Electron transfer of the protein
has been verified optically; molecular changes induced by
the photoreaction were monitored by FT-IR spectroscopy.
It was possible to recognize absorbance differences of
carboxyl groups, one of which was assigned to the
conformational change of the side chain of Glu286 from
the catalytic subunit I of cytochrome bo
3
. Comparisons of
the spectra obtained in this study with redox spectra
measured with the caged electron donor FMN yielded
absorbance patterns of inverted shapes. Oxidoreduction of
cytochrome oxidase can thus be observed spectroscopically
in the forward and backward reaction. Complementary
information is gained by the reciprocal experiments of heme
oxidation and reduction: The electron flow from heme
centers to oxygen arises exactly as expected; it thus seems
clear, that the dioxygen produced after uncaging behaves
like the natural substrate. According to prelimirary experi-
ments it is possible to follow time-resolved absorbance
changes at optical wavelengths with cytochrome bo
3
.Inthe
future, we will extend the caged oxygen approach to
investigate the kinetics of oxidase reaction at the molecular
level by IR spectroscopy.
ACKNOWLEDGEMENTS
This work was supported by the Deutsche Forschungsgemeinschaft
grant SFB 394-C6 and the Volkswagen-Stiftung to M. L. We thank
Prof Klaus Gerwert for his support in providing the FT-IR equipment.
REFERENCES
1. Garcia-Horsman, J.A., Barquera, B., Rumbley, J., Ma, J. &
Gennis, R.B. (1994) The superfamily of heme-copper respiratory
oxidases. J. Bacteriol. 176, 5587–5600.
2. Pereira, M.M., Santana, M. & Teixeira, M. (2001) A novel
scenario for the evolution of haem-copper oxygen reductases.
Biochim. Biophys. Acta 1505, 185–208.
3. Wikstro
¨
m, M., Krab, K. & Saraste, M. (1981) Cytochrome
Oxidase: A Synthesis. Academic Press, New York.
4. Trumpower, B.L. & Gennis, R.B. (1994) Energy transduction by
cytochrome complexes in mitochondrial and bacterial respiration:
the enzymology of coupling electron transfer reactions to
transmembrane proton translocation. Annu. Rev. Biochem. 63,
675–716.
5. Brzezinski, P. (2000) Proton-transfer reactions in bioenergetics –
Introduction. Biochim. Biophys. Acta 1, 1–5.
6. Abramson, J., Riistama, S., Larsson, G., Jasaitis, A., Svensson-
Ek, M., Laakkonen, L., Puustinen, A., Iwata, S. & Wikstro
¨
m, M.
(2000) The structure of the ubiquinol oxidase from Escherichia coli
and its ubiquinone binding site. Nat. Struct. Biol. 7, 910–917.
7. Iwata, S., Ostermeier, C., Ludwig, B. & Michel, H. (1995) Struc-
ture at 2.8 A
˚
resolution of cytochrome c oxidase from Paracoccus
denitrificans. Nature 376, 660–669.
8. Tsukihara, T., Aoyama, H., Yamashita, E., Tomizaki, T.,
Yamaguchi, H., Shinzawa-Itoh, K., Nakashima, R., Yaono, R. &
Yoshikawa, S. (1995) Structures of metal sites of oxidized bovine
heart cytochrome c oxidase at 2.8 A
˚
. Science 269, 1069–1074.
9. Tsukihara, T., Aoyama, H., Yamashita, E., Tomizaki, T.,
Yamaguchi, H., Shinzawa-Itoh, K., Nakashima, R., Yaono, R. &
Yoshikawa, S. (1996) The whole structure of the 13-subunit oxi-
dized cytochrome c oxidase at 2.8 A
˚
. Science 272, 1136–1144.
10. Ostermeier, C., Harrenga, A., Ermler, U. & Michel, H. (1997)
Structure at 2.7 A
˚
resolution of the Paracoccus denitrificans two-
subunit cytochrome c oxidase complexed with an antibody F
v
fragment. Proc. Natl Acad. Sci. USA 94, 10547–10553.
11. Puustinen, A., Bailey, J.A., Dyer, R.B., Mecklenburg, S.L.,
Wikstro
¨
m, M. & Woodruff, W.H. (1997) Fourier transform
infrared evidence for connectivity between Cu
B
and glutamic acid
286 in cytochrome bo
3
from Escherichia coli. Biochemistry 36,
13195–13200.
12. Pomes, R., Hummer, G. & Wikstro
¨
m, M. (1998) Structure and
dynamics of a proton shuttle in cytochrome c oxidase. Biochim.
Biophys. Acta 1365, 255–260.
13. Hofacker, I. & Schulten, K. (1998) Oxygen and proton pathways
in cytochrome c oxidase. Proteins 30, 100–107.
14. Moss, D., Nabedryk, E., Breton, J. & Ma
¨
ntele, W. (1990) Redox-
linked conformational changes in proteins detected by a combi-
nation of infrared spectroscopy and protein electrochemistry.
Evaluation of the technique with cytochrome c. Eur. J. Biochem.
187, 565–572.
15. Hellwig, P., Behr, J., Ostermeier, C., Richter, O.M., Pfitzner, U.,
Odenwald,A.,Ludwig,B.,Michel,H.&Ma
¨
ntele, W. (1998)
Involvement of glutamic acid 278 in the redox reaction of the
cytochrome c oxidase from Paracoccus denitrificans investigated
by FTIR spectroscopy. Biochemistry 37, 7390–7399.
16. Lu
¨
bben, M. & Gerwert, K. (1996) Redox FTIR difference spec-
troscopy using caged electrons reveals contributions of carboxyl
groups to the catalytic mechanism of haem-copper oxidases.
FEBS Lett. 397, 303–307.
17. Lu
¨
bben, M., Prutsch, A., Mamat, B. & Gerwert, K. (1999) Elec-
tron transfer induces side-chain conformational changes of glu-
tamate-286 from cytochrome bo
3
. Biochemistry 38, 2048–2056.
18. MacArthur, R., Sucheta, A., Chong, F.F. & Einarsdottir, O
¨
.
(1995) Photodissociation of a (l-peroxo) (l-hydroxo) bis[bis
(bipyridyl)-cobalt(III)] complex: a tool to study fast
biological reactions involving O
2
. Proc. Natl Acad. Sci. USA 92,
8105–8109.
19. Van Eps, N., Szundi, I. & Einarsdottir, O
¨
. (2000) A new approach
for studying fast biological reactions involving dioxygen: the
reaction of fully reduced cytochrome c oxidase with O
2
.
Biochemistry 39, 14576–14582.
20. Winkler, L.W. (1888) Die Bestimmung des im Wasser gelo
¨
sten
Sauerstoffes. Ber. Dtsch. Chem. Ges. 21, 2843–2855.
21. Otwinowski, Z. & Minor, W. (1997) Processing of X-ray-diffrac-
tion data collected in oscillation mode. Methods Enzymol. 276,
307–326.
22. Blessing, R.H. (1995) An Empirical Correction For Absorption
Anisotropy. Acta Crystallogr., Sect. A: Found. Crystallogr. 51,
33–38.
23. Blessing, R.H. (1997) Outlier treatment in data merging. J. Appl.
Crystallogr. 30, 421–426.
24. Sheldrick, G.M. (1990) Phase annealing in SHELX-90: direct
methods for larger structures. Acta Crystallogr. Sect. A: Found.
Crystallogr. 46, 467–473.
25. Heller, H.G. & Langan, J.R. (1981) Photochromic heterocyclic
fulgides. Part 3. The ese of (E)-a-(2,5-dimethyl-3-furylethylidene)
(isopropylidene) succinic anhydride as a simple convenient che-
mical actinometer. J.Chem.Soc.PerkinII, 341–343.
26. Prutsch, A., Lohaus, C., Green, B., Meyer, H.E. & Lu
¨
bben, M.
(2000) Multiple posttranslational modifications at distinct sites
contribute to heterogeneity of the lipoprotein cytochrome bo
3
.
Biochemistry 39, 6554–6563.
27. Skurlatov, U.I. & Pourmal, A.P. (1971) Reversible and Irrever-
sible Interaction of O
2
with Co
2+
-a,a¢-dipyridyl. Bibl. Haemat,
No. 38, 827–830.
28. Fallab, S., Zehnder, M. & Thewalt, U. (1980) Reactions of
Oxygenated cobalt-(II) complexes. XIII. Diastereomeric forms
of l-peroxo-l-hydroxo-bis [bis(ethylendiamine)cobalt (III)].
2636 C. Ludovici et al. (Eur. J. Biochem. 269) Ó FEBS 2002
Preparation, X-ray structure determination and reactivity. Helv.
Chem. Acta 63, 1491–1498.
29. Vaska, L. (1976) Dioxygen–metal complexes: toward a unified
view. Acc. Chem. Res. 9, 175–183.
30. Bogucki, R.F., McLendon, G. & Martell, A.E. (1976) Oxygen
complexation by cobaltous chelates of multidentate pyridyl-type
ligands. Equilibria, reactions, and electron structure of the com-
plexes. J. Am. Chem. Soc. 98, 3202–3205.
31. Babcock, G.T. & Varotsis, C. (1993) Discrete steps in dioxygen
activation-the cytochrome oxidase/O
2
reaction. J. Bioenerg.
Biomembr. 25, 71–80.
32. Morgan, J.E., Verkhovsky, M.I., Puustinen, A. & Wikstro
¨
m, M.
(1993) Intramolecular electron transfer in cytochrome o of
Escherichia coli: events following the photolysis of fully and
partially reduced CO-bound forms of the bo
3
and oo
3
enzymes.
Biochemistry 32, 11413–11418.
33. Sucheta, A., Georgiadis, K.E. & Einarsdottir, O
¨
. (1997)
Mechanism of cytochrome c oxidase-catalyzed reduction of
dioxygen to water: evidence for peroxy and ferryl intermediates at
room temperature. Biochemistry 36, 554–565.
34. Paula, S., Sucheta, A., Szundi, I. & Einarsdottir, O
¨
. (1999) Proton
and electron transfer during the reduction of molecular oxygen by
fully reduced cytochrome c oxidase: a flow-flash investigation
using optical multichannel detection. Biochemistry 38, 3025–3233.
35. A
¨
delroth, P., Karpefors, M., Gilderson, G., Tomson, F.L., Gennis,
R.B. & Brzezinski, P. (2000) Proton transfer from glutamate 286
determines the transition rates between oxygen intermediates in
cytochrome c oxidase. Biochim. Biophys. Acta 1459, 533–539.
Ó FEBS 2002 Caged oxygen reaction with cytochrome oxidase (Eur. J. Biochem. 269) 2637