Tài liệu Báo cáo Y học: Electrochemical, FT-IR and UV/VIS spectroscopic properties of the caa3 oxidase from T. thermophilus docx
Bạn đang xem bản rút gọn của tài liệu. Xem và tải ngay bản đầy đủ của tài liệu tại đây (332.12 KB, 9 trang )
Electrochemical, FT-IR and UV/VIS spectroscopic properties of the
caa
3
oxidase from
T. thermophilus
Petra Hellwig
1
, Tewfik Soulimane
2
* and Werner Ma¨ ntele
1
1
Institut fu
¨
r Biophysik der Johann-Wolfgang-Goethe-Universita
¨
t, Frankfurt/M., Germany;
2
Institut fu
¨
r Biochemie der Rheinisch-
Westfa
¨
lischen-Technischen Hochschule, Aachen, Germany
The caa
3
-oxidase from Thermus thermophilus has been
studied with a combined electrochemical, UV/VIS and
Fourier-transform infrared (FT-IR) spectroscopic
approach. In this oxidase the electron donor, cytochrome c,
is covalently bound to subunit II of the cytochrome c
oxidase. Oxidative electrochemical redox titrations in the
visible spectral range yielded a midpoint potential of
)0.01 ± 0.01 V (vs. Ag/AgCl/3
M
KCl, 0.218 V vs. SHE¢)
for the heme c. This potential differs for about 50 mV from
the midpoint potential of isolated cytochrome c, indicating
the possible shifts of the cytochrome c potential when bound
to cytochrome c oxidase. For the signals where the hemes a
and a
3
contribute, three potentials, ¼ )0.075 V ± 0.01 V,
Em
2
¼ 0.04 V ± 0.01 V and Em
3
¼ 0.17 V ± 0.02 V
(0.133, 0.248 and 0.378 V vs. SHE¢, respectively) could be
obtained. Potential titrations after addition of the inhibitor
cyanide yielded a midpoint potential of )0.22 V ± 0.01 V
for heme a
3
-CN
–
and of Em
2
¼ 0.00 V ± 0.02 V and
Em
3
¼ 0.17 V ± 0.02 V for heme a ()0.012 V, 0.208 V
and 0.378 V vs. SHE¢, respectively). The three phases of the
potential-dependent development of the difference signals
can be attributed to the cooperativity between the hemes a,
a
3
and the Cu
B
center, showing typical behavior for cyto-
chrome c oxidases. A stronger cooperativity of Cu
B
is dis-
cussed to reflect the modulation of the enzyme to the
different key residues involved in proton pumping. We thus
studied the FT-IR spectroscopic properties of this enzyme to
identify alternative protonatable sites. The vibrational
modes of a protonated aspartic or glutamic acid at
1714 cm
)1
concomitant with the reduced form of the protein
can be identified, a mode which is not present for other
cytochrome c oxidases. Furthermore modes at positions
characteristic for tyrosine vibrations have been identified.
Electrochemically induced FT-IR difference spectra after
inhibition of the sample with cyanide allows assigning the
formyl signals upon characteristic shifts of the m(C¼O)
modes, which reflect the high degree of similarity of heme a
3
to other typical heme copper oxidases. A comparison with
previously studied cytochrome c oxidases is presented and
on this basis the contributions of the reorganization of the
polypeptide backbone, of individual amino acids and of the
hemes c, a and a
3
upon electron transfer to/from the redox
active centers discussed.
Keywords: caa
3
oxidase; cytochrome c oxidase; UV/VIS-
spectroscopy; FT-IR-spectroscopy; Thermus thermophilus.
Cytochrome c oxidase is the terminal enzyme of the
respiratory chain in mitochondria and many prokaryotes.
As an integral membrane protein it catalyzes the reduction
of dioxygen to water using electrons from cytochrome c.
Four redox-active sites are involved in the electron transfer.
Electrons from cytochrome c are first transferred to a
homobinuclear copper A site (Cu
A
) and then subsequently
to heme a, and to heme a
3
, which is located close to copper
B(Cu
B
), forming a heterobinuclear metal center where
oxygen is reduced to water. Protons needed for water
formationaretakenupfromthecytosolicsideinbacterial
membranes or from the matrix side in mitochondria. The
proton consumption and the coupled translocation of
nH
+
/e
–
across the membrane contribute to the proton
gradient needed to synthesize ATP.
Two pathways have been proposed to serve for consumed
and pumped protons on the basis of site-directed mutagen-
esis [1,2] and later using the crystal structures [3–5]. These
pathways are highly conserved among most studied cyto-
chrome oxidases [2,6]. However, cytochrome oxidases have
been reported that lack amino acids disputed to be essential
in proton translocation. In the case of caa
3
-oxidases from
T. thermophilus, for example, as well as from Rhodothermus
marinus, the amino acid Glu278 (numbering for Paracoccus
denitrificans), which is proposed to pass protons in the
D-pathway to the binuclear center, is missing, but proton-
pumping activity is observed [3,7–9]. A highly conserved
Tyr–Ser couple was suggested to replace Glu278 [9]. In the
current understanding, two pathways are necessary for the
catalytic activity, but different residues may be involved. In
an important step for the understanding of the essentials for
cytochrome c oxidase activity and coupled proton pump-
ing, the crystal structure of the aberrant ba
3
-oxidase from
T. thermophilus was determined [10] and alternative path-
ways discussed.
Correspondance to P. Hellwig, Institut fu
¨
rBiophysikderJohann-
Wolfgang-Goethe-Universita
¨
t, Theodor-Stern-Kai 7 Haus 74,
60590 Frankfurt/M., Germany.
Fax: + 49 69 6301 5838, Tel.: + 49 69 6301 4227,
E-mail:
Abbreviations: FT-IR, Fourier-transform infrared; SHE¢, standard
hydrogen electrode; TMPD, N,N,N¢,N¢-tetramethyl-p-phenylenedi-
amine dihydrochloride
*Present address: Paul Scherrer Institut, Structural Biology Group,
5232-CH, Villigen PSI, Switzerland.
(Received 13 March 2002, revised 6 August 2002, accepted 14 August 2002)
Eur. J. Biochem. 269, 4830–4838 (2002) Ó FEBS 2002 doi:10.1046/j.1432-1033.2002.03182.x
Under restricted O
2
supply, the thermophilic Gram
negative bacterium T. thermophilus expresses two different
cytochrome c oxidases. The heme types incorporated
belong to the caa
3
-andba
3
-type cytochrome c oxidases,
respectively. The caa
3
-oxidase contains analogous central
subunits and catalytic entity to the mitochondrial aa
3
-
oxidases, however, including a covalently bound type-c
heme [11]. This is currently only found in a few bacteria
[9,12]. Recent results showed that the enzyme is made of two
fusion proteins. The smaller protein consists of a typical
oxidase subunit II sequence, which provides the homonu-
clear Cu
A
binding site and is fused to a cytochrome c
domain [11,13]. The larger protein is a fusion product of
subunit I, that has the hemes a, a
3
and the Cu
B
sites, and
subunit III [8,12,13]. The heme c center in the caa
3
-oxidase is
proposed to serve as the first electron acceptor from a bc
1
complex [14]. We note, however, that no bc
1
complex has
yet been described for T. thermophilus. No activity was
detected for a reaction with soluble horse heart cyto-
chrome c, c
552
from T. thermophilus and yeast iso1 cyto-
chrome c, which serve as natural reductands for
cytochrome c oxidases, but a reduction can be noted for
nonphysiological reducing agents such as N,N,N¢,N¢-tetra-
methyl-p-phenylenediamine dihydrochloride (TMPD) [15].
The caa
3
-oxidase may be regarded as an integrated version
of the noncovalent redox complex between cytochrome c
and cytochrome c oxidase.
Previous reports on the caa
3
-oxidase from T. thermophi-
lus concluded that this enzyme is a typical member of the
heme copper oxidase family [12], with the exception of a
different titrimetric behavior of the redox centers in the
electron transfer [16] and the lack of some key residues as
mentioned above. In this work we study the electrochemical,
UV-VIS and FT-IR spectroscopic properties of the caa
3
-
oxidase from T. thermophilus in the presence and absence of
cyanide, and compare the observed properties to previous
reports on members of the heme copper oxidase family such
as cytochrome c oxidase from bovine heart and P. denitri-
ficans, and the aberrant ba
3
-oxidase from T. thermophilus.
MATERIALS AND METHODS
Sample preparation
The caa
3
-type cytochrome c oxidase from T. thermophilus
was prepared as described previously in Gerscher et al. [17].
For electrochemistry the sample was solubilized in
n-decyl-b-
D
-maltopyranoside, 100 m
M
phosphate buffer
(pH 7) containing 100 m
M
KCl and concentrated to
approximately 0.5 m
M
using Microcon ultrafiltration cells
(Millipore). Exchange of H
2
O against D
2
O was performed
by repeatedly concentrating the enzyme and rediluting it in a
D
2
O phosphate-buffer. H/D exchange was better than 80%
as judged from the shift of the amide-II mode at 1550 cm
)1
in the FT-IR absorbance spectra (data not shown). For
inhibition with cyanide, samples were diluted with 500 lL
of 100 m
M
phosphate buffer containing 20 m
M
KCN
(pH 7), incubated overnight and reconcentrated to 0.5 m
M
.
Electrochemistry
The ultra-thin layer spectroelectrochemical cell for the UV/
VIS and IR was used as described previously [18]. Sufficient
transmission in the 1800–1000 cm
)1
range, even in the
region of strong water absorbance around 1645 cm
)1
,was
achieved with the cell pathlength set to 6–8 lm. The gold
grid working electrode was chemically modified by a 2-m
M
cysteamine solution as reported previously [19]. In order to
accelerate the redox reaction, 15 different mediators were
added as reported by Hellwig et al. [19], with the exception
of K
4
[Fe(CN)
6
], to a total concentration of 40 l
M
each. At
this concentration, and with the pathlength below 10 lm,
no spectral contributions from the mediators in the VIS and
IR range could be detected in control experiments with
samples lacking the protein, except for the PO modes of the
phosphate buffer between 1200 cm
)1
and 1000 cm
)1
.Asa
supporting electrolyte, 100 m
M
KCl was added. Approxi-
mately 5–6 lL of the protein solution were sufficient to fill
the spectroelectrochemical cell. Potentials quoted with the
data refer to the Ag/AgCl/3
M
KCl reference electrode,
adding + 208 mV for SHE¢ (pH 7) potentials. Midpoint
potentials are described for both electrode types.
Spectroscopy
FT-IR and UV/VIS difference spectra as a function of the
applied potential were obtained simultaneously from the
same sample with a setup combining an IR beam from
the interferometer (modified IFS 25, Bruker, Germany) for
the 4000–1000 cm
)1
range and a dispersive spectrometer
for the 400–900 nm range as reported previously [18]. First,
the protein was equilibrated with an initial potential at the
electrode, and single beam spectra in the VIS and IR range
were recorded. A potential step to the final potential was
then applied, and single beam spectra of this state were
again recorded after equilibration. Difference spectra as
presented here were then calculated from the two single
beam spectra with the initial single beam spectrum taken as
a reference. No smoothing or deconvolution procedures
were applied. The equilibration process for each potential
applied was followed by monitoring the electrode current
and by successively recording spectra in the visible range
until no further changes were observed. The equilibration
generally took less than 8 min under the conditions reported
(protein concentration, electrode modification, mediators)
for the full potential step from )0.5V to 0.5V and to
selected potentials. Typically, 128 interferograms at 4 cm
)1
resolution were coadded for each single beam IR spectrum
and Fourier-transformed using triangular apodization.
Differences in sample concentration and pathlength were
taken into account by normalizing the FT-IR difference
spectra on the difference signal of the sample in the UV/VIS
at 602 nm.
Redox titrations
The redox-dependent absorbance changes of the caa
3
-
oxidase from T. thermophilus were studied performing
electrochemical redox titrations in the UV/VIS spectral
range. The redox titrations were performed by stepwise
setting the potential and recording the spectrum after
sufficient equilibration. Typically data were recorded at
steps of 30–50 mV. All measurements were performed at
5 °C. The midpoint potentials E
m
and the number n of
transferred electrons were obtained by adjusting a calcula-
ted Nernst curve to the measured absorbance change at a
Ó FEBS 2002 Characterization of T. thermophilus caa
3
oxidase (Eur. J. Biochem. 269) 4831
single wavelength by an interactive fit. All parameters have
to be adjusted manually until the theoretical Nernst curve
and the measured data match well (fit by eye).
RESULTS AND DISCUSSION
UV/VIS difference spectra
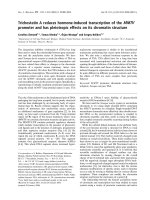
Figure 1A shows the oxidized-minus-reduced UV/VIS
difference spectra of the caa
3
-oxidase from T. thermophilus
obtained for a potential step from )0.5 V to 0.5 V (vs. Ag/
AgCl/3
M
KCl). In the oxidized-minus-reduced spectra the
positive signals correlate with the oxidized and the negative
signals with the reduced form of the enzyme. For the
reduced form, the Soret band can be observed at 415 and
442 nm, and for the oxidized form at 403 and 422 nm. The
b–band can be seen at 517 nm and the a–band at 547 nm
and 603 nm.
The difference signals that can be observed between 400
and 700 nm include the contributions of the hemes c, a and
a
3
. The difference signals observed at 403, 415, 517 and
547 nm are characteristic for heme c. In electrochemically
induced difference spectra of horse heart cytochrome c the
Soret band was reported to absorb at 418 nm, the b-band at
520 nm and the a–band at 550 nm [18]. The deviations of
approximately 3 nm between the signals of horse heart
cytochrome c and the heme c in the caa
3
-oxidase from
T. thermophilus can be attributed to the different environ-
ment of the heme centers. The difference signals observed at
442 nm and 603 nm can be assigned to the contributions of
the hemes a and a
3
, with the position of the a-band showing
a downshift in relation to bovine heart oxidase.
In Fig. 1B the oxidized-minus-reduced UV/VIS differ-
ence spectra of the caa
3
-oxidase poisoned with cyanide
obtained for a potential step from )0.5 V to 0.5 V (solid
line) and from )0.5–0.05 V (dotted line) can be seen. The
a-band shifts to 599 nm upon binding of cyanide to
heme a
3
. This shift is reflected clearly in the critical potential
step from )0.5 to )0.05 V, where mainly heme a
3
and heme
c contribute. Addition of cyanide was used in the electro-
chemically induced FT-IR difference spectra to separate
contributions of heme a
3
.
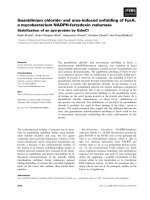
UV/VIS redox titrations
In Fig. 2A the potential dependent development of the
a–band from heme c at 548 nm in an oxidative titration can
be seen (filled circles). The theoretical Nernst fit described
in Materials and methods yields a midpoint potential of
E
m
¼ )0.01 ± 0.01 V (vs. Ag/AgCl, and 0.218 V vs.
SHE¢) for heme c. This value was also reported by Yoshida
and Fee [16]. The midpoint potential of soluble horse heart
cytochrome c is 0.048 V (0.256 V vs. SHE¢, as obtained
with the same method as described here and in [18]); other
cytochrome c types show a close midpoint potential. The
midpoint potential of the cytochrome c in the cyto-
chrome c–cytochrome c oxidase complex is unknown and
may be the origin for this downshift. Alternatively, the
electron transfer directly from the bc
1
complex, as suggested
for a possible mechanism, could require a lower potential.
Figure 2B (filled circles) shows the potential-dependent
development of the difference signal at 443 nm from )0.4 V
to + 0.6 V. Three phases can be clearly discriminated. The
theoretical Nernst fit yields midpoint potentials
Em
1
¼ )0.075 ± 0.01 V, Em
2
¼ 0.04 ± 0.01 V and
Em
3
¼ 0.17 ± 0.02 V for an n value of 0.9–1 (these values
correspond to 0.133, 0.248 and 0.378 V vs. SHE¢, respect-
ively). As reported previously, cytochrome c oxidase from
bovine heart shows a complex titration curve reflecting the
cooperative interactions between the hemes a and a
3
,and
the Cu
B
center [20–22]. For cytochrome c oxidase from
bovine heart E
m
values near 200, 260 and 340 mV have been
reported [23–25], and analyzed in detail by several groups
[20–22]. For the caa
3
-oxidase we observe a noteworthy
pronounced phase at 40 mV (248 mV vs. SHE¢) but
essentially a similar titrimetric behavior. In a previously
reported potential titration of the caa
3
-oxidase from
T. thermophilus, Yoshida and Fee [16] describe a compar-
able potential and n-value for the first step, but report a
second step with an n-value of two at approximately
160 mV for Cu
B
and heme a
3
.Onthisbasis,Cu
B
and
heme a
3
have been suggested to act as a two-electron
acceptor [12] in contrast to bovine heart oxidase, where
subsequent one-electron transfer is reported. The three
phasic curve, with a step of n ¼ 1 for each step as found
here, shows a significantly more comparable titrimetric
behavior in comparison to other typical oxidases, but in
contrast to the work by Yoshida and Fee [16]. The small
difference to other oxidases found here, reflected in the
stronger second step at 40 mV, may be attributed to the
Fig. 1. Oxidized-minus-reduced UV/VIS difference spectra of the caa
3
-
oxidase from T. thermophilus. Results obtained for a potential step
from )0.5 V to 0.5 V (vs. Ag/AgCl/3
M
KCl) in the absence (A) or the
presence (B, solid line) of cyanide, and for a potential step from )0.5 to
0.05 V in the presence of cyanide (B, dotted line).
4832 P. Hellwig et al.(Eur. J. Biochem. 269) Ó FEBS 2002
covalently attached heme c or to a generally changed
cooperativity of the other redox centers.
In order to discriminate the contributions of the cofac-
tors, inhibitors uncoupling or changing the cooperativity
can be used. Addition of cyanide strongly shifts the heme a
3
potential and thus uncouples or changes cooperativity in the
binuclear center [20,22,28]. The shifts of the titration curve
upon addition of cyanide can be seen in Fig. 2B (open
circles). The theoretical Nernst fit yielded midpoint poten-
tials Em
1
¼ )0.22 ± 0.01 V, Em
2
¼ 0.00 ± 0.01 V and
Em
3
¼ 0.17 ± 0.02 V (the values correspond to )0.012,
0.208 and 0.378 V vs. SHE¢, respectively). The potential at
)220 mV can be attributed to the heme a
3
–CN
–
signal, this
shift reflecting the characteristic behavior of cytochrome c
oxidases. heme a is expected to contribute with two steps,
reflecting the remaining interactions with Cu
B
.Asseenin
Fig. 2B (open circles), a further interaction is observed,
presenting additional evidence for a different cooperativity
of the redox centers.
Whereas in the Soret Band heme a and heme a
3
contribute almost equally, the heme a contribution domin-
ates the a-band. Figure 2C shows a comparison of the
potential-dependent development of the modes at 599 nm
(triangles) and 442 nm (open circles) in the presence of
cyanide. As seen for the curve that represents the titration
curve at 602 nm (triangles) a smaller ratio is present for the
potential at )220 mV than for the titration curve measured
at 442 nm in the same conditions, supporting the assign-
ment to heme a
3
.
Heme c, however, shows a relatively small difference in
midpoint potential of 15 mV in the presence of cyanide
(Fig. 2A, empty circles) and thus does not indicate a
noteworthy cooperativity between heme a
3
and the heme c
centers. Heme c can be ruled out as origin for the distinct
second phase at 40 mV in the titration curve for the hemes a
and a
3
. It may be suggested that the different cooperativity,
as well as the lower heme a
3
potential, is necessary to
compensate the differences caused by the presence of
different key residues in the D-pathway, since the potentials
are assumed to be crucial for the coupling of electron and
proton transfer. Interestingly, for the caa
3
-oxidase from
R. marinus which also lacks the above-mentioned Glu278
side chain, downshifted potentials for the hemes a and a
3
have been described, although the cooperativity is not
discussed [9]. In the case of the aberrant ba
3
-cytochrome c
oxidase from T. thermophilus, a completely different titri-
metric behavior was observed [26], also indicating that the
midpoint potentials and cooperativity are adapted to the
varying proton path residues. To emphasize this suggestion
further, future comparative studies on the varying oxidases
could be performed.
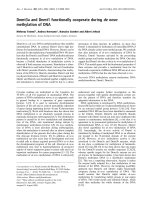
FT-IR difference spectra
Figure 3 shows the oxidized-minus-reduced FT-IR differ-
ence spectra of the caa
3
-oxidase from T. thermophilus for a
potential step from )0.5 V to 0.5 V equilibrated in H
2
O(A)
and D
2
O buffer (B). Numerous distinct sharp bands appear
throughout the spectrum, with half-widths typically below
5–10 cm
)1
. The noise level in these difference spectra can be
estimated at approximately 25–50 · 10
)6
absorbance units
at frequencies above 1750 cm
)1
, where no signals appear.
Only in regions of strong absorbance of the sample, such as
Fig. 2. Potential dependent development of the hemes in the caa
3
-oxid-
ase from T. thermophilus . Heme c was monitored at 548 nm in the
absence (filled circles) and presence (open circles) of cyanide (A) and a
midpoint potential of )0.01 V ± 0.01 V (vs. Ag/AgCl/3
M
KCl or
0.218 V vs. SHE¢) was obtained by a theoretical Nernst fit (solid line).
The hemes a and a
3
were monitored at 442 nm in the absence
(filled circles) and presence (open circles) of cyanide. Midpoint poten-
tials of Em
1
¼ )0.075V±0.01V, Em
2
¼ 0.04 V ± 0.01 V and
Em
3
¼ 0.17 V ± 0.02 V were determined (these values correspond to
0.133 V, 0.248 V and 0.378 V vs. SHE¢, respectively). After addition of
the inhibitor cyanide (open circles) a midpoint potential of
)0.22 V ± 0.01 V for heme a
3
-CN
–
and of Em
2
¼ 0.00 V ± 0.02 V
and Em
3
¼ 0.17 V ± 0.02 V for heme a canbeseen(thevalues
correspond to )0.012 V, 0.208 V and 0.378 V vs. SHE¢, respectively).
(B) Comparison of the potential dependent development of the modes
at 599 nm (triangles) and 442 nm (open circles) in the presence of
cyanide. The theoretical Nernst fit is shown as a solid line (C).
Ó FEBS 2002 Characterization of T. thermophilus caa
3
oxidase (Eur. J. Biochem. 269) 4833
around 1650 cm
)1
(water OH-bending mode and amide-I
C¼O mode), was the noise level slightly higher, though
never exceeding 10
)4
absorbance units.
The entirety of difference signals represent the total
molecular changes concomitant with the redox reactions.
In the electrochemically induced FT-IR difference spectra,
contributions from the porphyrin ring, the heme propio-
nates and the vinyl substituent can be expected, originating
from heme c, with contributions from the formyl groups
and from the geranyl side chain expected from heme a and
a
3
. In addition to the signals of the hemes, the reorgan-
ization of the polypeptide backbone and amino acid side
chains occurring upon electron transfer of the five redox
active centers heme c, a, a
3
,Cu
A
and Cu
B
, and coupled
processes such as proton transfer can be expected to
manifest themselves in the spectra. In the following
paragraph the difference spectra will be described and
discussed. Tentative assignments will be presented on the
basis of the comparison to IR and Raman spectra of heme
model compounds, other oxidases, spectra of isolated
amino acids as model compounds and information on
contributions from the secondary structure from infrared
absorbance spectra and the deconvolution of the amide-I
region.
A particular problem of the assignment in the difference
spectra is the superposition of signals from different
constituents of the oxidase, which can lead to the possibility
of multi component bands and may present ambiguities in
the assignment. A spectral region particularly susceptible for
overlapping bands is the amide-I range. Although in this
range (approx. 1690–1610 cm
)1
) typical contributions from
secondary structure elements are expected, and signals may
point to the alterations of local protein conformation in the
course of the redox reaction, we keep in mind that the heme
formyl mode also contributes here, as well as specific modes
from amino acid side chains. For a clearer discrimination of
these overlapped bands, we used deuteration of the sample
and FT-IR spectra studies in the presence of the inhibitor
cyanide support our tentative assignments.
Tentative assignments of difference signals
to polypeptide backbone modes
Amide-I signals are predominantly caused by the C¼O
stretching vibration of the polypeptide backbone. For
different secondary structure elements, characteristic
absorptions can be distinguished. In the electrochemically
induced FT-IR difference spectra, contributions from the
reorganization of the polypeptide backbone upon electron
transfer to and from the cofactors can be expected, and a
partial attribution of the signals observed in the amide-I
region (1690–1610 cm
)1
) to amide-I modes is conceivable.
The different secondary structure elements show a different
sensitivity to H/D exchange. In Fig. 3A strong positive
signals can be observed at 1694 cm
)1
, 1684 cm
)1
,
1674 cm
)1
and 1646 cm
)1
, and prominent negative differ-
ence modes are present at 1660 cm
)1
, 1626 cm
)1
and
1614 cm
)1
. After H/D exchange (Fig. 3B) the increase of
the signal at 1696 cm
)1
and 1626 cm
)1
can be observed. A
clear shift from 1634 cm
)1
to 1658 cm
)1
and to 1650 cm
)1
is visible. The modes involved in the signals at 1660 cm
)1
contribute in the range characteristic for the absorbance
from a–helical secondary structure elements. However,
absorbance changes induced by the reorganization of
a-helical secondary structure elements are expected to show
very small shifts after H/D exchange at most (2–10 cm
)1
)
and an assignment is unlikely. Unordered secondary
structure elements show a higher sensitivity to H/D
exchange and also contribute in this spectral range. An
involvement of reorganizations of b–sheet secondary struc-
ture elements is possible for the difference in the signals at
1696–1674 cm
)1
, and at 1646–1620 cm
)1
. However, con-
clusive assignments are difficult in this spectral range where
difference bands strongly overlap.
In the amide-II region (1575 cm
)1
)1480 cm
)1
), strong
negative signals at 1546 cm
)1
and 1516 cm
)1
as well as
positive signals at 1562 cm
)1
and 1498 cm
)1
can be
observed. An assignment of the signals in the amide-II
region in the electrochemically induced FT-IR difference
spectrum of the caa
3
-oxidase from T. thermophilus to
amide-II modes, however, appears less probable since little
or no shift for H/D exchange is observed.
Assignment of heme vibrational modes
Formyl substituent. The C¼O bond of the formyl group at
the porphyrin ring of hemes a and a
3
can be expected to
contribute between 1680 cm
)1
and 1606 cm
)1
, depending
on hydrogen bonding with neighboring amino acids. The
formyl substituent of heme a is predicted to form a
Fig. 3. Oxidized-minus-reduced FT-IR difference spectra of the caa
3
-
oxidase from T. thermophilus. Results obtained for a potential step
from )0.5 V to 0.5 V (vs. Ag/AgCl/3
M
KCl) equilibrated in H
2
O(A)
and D
2
O buffer (B).
4834 P. Hellwig et al.(Eur. J. Biochem. 269) Ó FEBS 2002
hydrogen bond with an arginine side chain, while the same
substituent for heme a
3
appears to be free from H-bonding
to nearby amino acid residues. Different frequencies for the
m(C¼O) stretching mode of the formyl group can thus be
expected. In resonance Raman spectra of caa
3
-oxidase from
T. thermophilus a signal at 1611 cm
)1
could be assigned to
the m(C¼O) CHO from reduced heme a and at 1649 cm
)1
to the oxidized form [17]. Comparable signals can be
observed here at 1650 cm
)1
for the oxidized form and at
1608 cm
)1
for the reduced form.
The resonance Raman spectroscopic characterization of
the m(C¼O) CHO vibrational modes for heme a
3
showed
the presence of a mode for the reduced form at 1664 cm
)1
and for the oxidized form at 1673 cm
)1
[17]. In the
electrochemically induced FT-IR difference spectra in
Fig. 3A corresponding bands can be seen at 1678 cm
)1
(oxidized form) and 1660 cm
)1
(reduced form). These
modes have been previously attributed to the formyl side
chain from cytochrome c oxidase from bovine heart [27–29]
reportedtobesensitivetoCN
–
binding in a characteristic
way [27]. In Fig. 4A the spectra in the presence of cyanide
clearly reflect a shift of the mode at 1678–1668 cm
)1
and of
the mode at 1660–1652 cm
)1
, supporting the assignment to
the heme a
3
formyl mode. In a direct comparison of these
vibrational modes to those observed for the cytochrome c
oxidase from P. denitrificans, an analog environment of the
protein site of the heme a
3
formyl group in the absence and
presence of cyanide can be concluded.
Porphyrin ring vibrations. Porphyrin ring vibrations of
the heme centers, for example the CaCm vibration (m
37
)or
the CbCb vibration (m
38
) can be expected between
1620 cm
)1
and 1500 cm
)1
and are involved in the
electrochemically induced FT-IR difference spectra shown
in Figs 3 and 4. On the basis of recent resonance Raman
work on the caa
3
-oxidase from T. thermophilus [17] and a
direct comparison to resonance Raman and FT-IR
investigations on other oxidases [17,23,30] tentative as-
signments of porphyrin ring vibrations have been made
and summarized in Table 1. As described previously by
Gerscher et al. [17], the spectroscopic properties of the
hemes a and a
3
sites are comparable to other typical aa
3
oxidases. Additionally contributions of the heme c center
can be expected.
It is clear that, in addition to the modes assigned here,
further C–C or C–N vibrations of the porphyrin ring
(m
4
,m
39
) will contribute to the electrochemically induced
FT-IR difference spectra. However, we refrain from dis-
cussing and assigning these modes on the basis of the data
presented here, in spite of the fact that bands in the
difference spectra are observed in the region where the
modes were attributed.
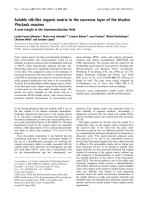
The vibrational modes of bound cyanide
Electrochemically induced FT-IR difference spectra of
cyanide bound to heme a
3
were characterized to specify
possible variations of the binuclear center in direct compari-
son to other oxidases, as for example the cytochrome c
oxidase from P. denitrificans. In the spectral range from
2200–2000 cm
)1
contributions from cyanide ligand bound
to heme a
3
can be expected. In the inset in Fig. 4 a strong
positive mode can be seen at 2148 cm
)1
and a negative
signal at 2040 cm
)1
for a potential step from )0.5 to 0.5 V
(unbroken line) and for )0.5 to 0.05 V (dotted line). A small
mode at 2092 cm
)1
can be seen in the reduced state,
indicating the presence of free cyanide upon reduction. The
band at 2148 cm
)1
may be assigned to the C–N stretching of
the Fe
3+
–C¼N–Cu
B
2+
entity (also a Fe
3+
–C¼N–Cu
B
2+
–
C¼N structure was discussed) based on the spectral shifts
observed for isotopically labeled cyanide complexes [31–33].
Correspondingly, the band at around 2040 cm
)1
of the
reduced form could be attributed tentatively to the C–N
stretching of a nonbridging cyanide ligand of heme a
3
.In
the spectra observed for the critical potential step from )0.5
to 0.05 V, where the reorganization upon oxidation of the
inhibited heme a
3
center is induced, the cyanide modes are
completely developed. To allow the above-mentioned
bridged structure to be present, Cu
B
must be oxidized at
this potential in the presence of cyanide, since the contri-
bution of the unbridged Fea
3
3+
–CN
–
structure was repor-
ted to be observable at 2132 cm
)1
.
The position of the cynide vibrational modes are
essentially identical to the ones observed for bovine heart
oxidase [31] and from P. denitrificans (Hellwig et al.
unpublished results) reflecting a close environment and
ligand binding properties of the binuclear heme a
3
–Cu
B
center.
Identification of protonable sites
Aspartic and Glutamic acid side chains. The m(C¼O)
mode of protonated aspartic and glutamic side chains
absorb typically above 1710 cm
)1
, the exact absorption
depending on the hydrogen bonding. A negative mode is
present at 1714 cm
)1
, which shifts to 1716 cm
)1
upon H/D
exchange. This indicates the presence of a protonated
Fig. 4. Oxidized-minus-reduced FT-IR difference spectra of the caa
3
-
oxidase from T. thermophilus. Results obtained for a potential step
from )0.5 V to 0.5 V (vs. Ag/AgCl/3
M
KCl) in the absence (dotted
line) and presence of cyanide (solid line). The inset shows an enlarged
view of the spectral region characteristic for the CN modes from 2200
to 2000 cm
)1
.
Ó FEBS 2002 Characterization of T. thermophilus caa
3
oxidase (Eur. J. Biochem. 269) 4835
aspartic or glutamic acid side chain in the reduced state of
the enzyme, which is coordinated with a strong hydrogen
bond. A small very broad positive mode is found at
1744 cm
)1
, indicating the possible contribution of a
surface group in the oxidized form of the protein. This
mode shifts to 1740 cm
)1
upon H/D exchange. The signal
may originate from heme c reduction, but also reflect a
distinct protonable site in subunit I, involved in a different
proton pathway.
For the cytochrome c oxidase from P. denitrificans
difference modes at 1746 cm
)1
and 1734 cm
)1
have been
observed and attributed to Glu278 [19,34], and to the
equivalent residues in the cytochrome bo
3
quinol oxidase
from E. coli [35,36], a residue which lacks the caa
3
-oxidase
as mentioned above. Correspondingly no analogous con-
tribution can be seen here.
Tyrosines. Pereira et al. [9] recently suggested a Tyr–Ser
motif, conserved in several of the cytochrome c oxidases
which lack the above-mentioned Glu278 residue, to be
involved in proton pumping. For tyrosine side chains, the
m
19
(CC) ring mode for the protonated form of tyrosines is
proposed to absorb with an strong signal at 1518 cm
)1
and
for the deprotonated form at 1496–1486 cm
)1
[37,38].
Clearly a difference mode in the spectral region character-
istic for the protonated form can be seen concomitant with
the reduced state at 1515 cm
)1
and the mode typical for the
deprotonated form at 1498 cm
)1
, indicating the protonation
of a tyrosine residue with the reduction of the protein. Also
the m
7¢a
(CO) and d(COH) of tyrosine side chains expected at
approximately 1265 cm
)1
and 1245 cm
)1
respective to the
protonation state, can be seen. We note that these
assignments are highly tentative until this data can be
supported by combining the technique with site-directed
mutants or labeled compounds.
Heme propionates. The heme propionates at the hemes a
and a
3
are discussed to be involved in proton translocation
Table 1. Summary of tentative assignments of the vibrational modes involved in the electrochemically induced FT-IR difference spectra of the caa
3
-
oxidase from T. thermophilus.
caa
3
FT-IR
caa
3
RR [17] Redox state Tentative assignments
Comparable modes for
aa
3
P. denitrificans [30]
1744 ox m(C¼O) Glu278 for P. denitrificans 1746
– red m(C¼O) Glu278 for P. denitrificans 1734
1714 – red m(C¼O) Asp/Glu –
1708 ox m(C¼O) Asp/Glu 1708
1694 ox
1692 red amide-I (b-sheet) 1694
1684 ox amide-I (b-sheet) 1688
1682 red amide-I (b-sheet, loops) 1684
1678 1674 ox m(C¼O) CHO heme a
3
m(C¼O) heme propionates
m(C¼O) Asn/Gln
m(CN
3
H
5
)
as
Arg
1676
1660 1665 red m(C¼O) CHO heme a
3
amide-I (a-helical)
m(CN
3
H
5
)
as
Arg
1662
1650 1650 ox amide-I (a-helical)
m(C¼O) CHO heme a
1656/1644
1646/1636 ox amide-I (b-sheet) 1656/1644
1626 red d(NH
2
) Asn/Gln
m(CN
3
H
5
)
s
Arg
amide-I (b-sheet)
1632
1608 red m
37
heme c
1602 1604 ox m
37
heme a
(m
8a
/
8b
(CC) Tyr-OH)
1608 1610 red m(C¼O) CHO heme a 1606
1597 ox m
37
heme c
1580 1585 ox m
37
heme a
3
1588
1562 1567/1558 ox m
38x
heme a/a
3
m(COO
–
)
as
heme propionate
m(COO
–
)
as
Asp/Glu
m(CC) ring Tyr-O
–
1564
1546 1545 red m
38y
heme a 1548
1530 1532 red m
38y
heme a
3
m(COO
–
)
as
heme a
3
propionate
1528
1515 – red m
19
(CC) Tyr-OH –
1498 – ox m
19
(CC) Tyr-O
–
1265 – ox m
7¢a
(CO) Tyr-O
–
1245 – red m
7¢a
(CO) and d(COH) Tyr-OH
4836 P. Hellwig et al.(Eur. J. Biochem. 269) Ó FEBS 2002
during catalytic cycle [39]. The contributions of protonated
and ionized carboxylic groups of the heme propionates
for the cytochrome c oxidase from P. denitrificans were
assigned by specific
13
C-labelling of the carboxylic groups
of the four heme propionates and site-directed mutagenesis
in the vicinity of its site [40,41]. A signal at 1676 cm
)1
was attributed to contributions of protonated carboxylic
groups. Difference bands at 1570 cm
)1
and 1538 cm
)1
were
assigned to the m(COO
–
)
as
vibration and at 1380 cm
)1
to the
m(COO
–
)
s
vibration of deprotonated heme propionates
[40,41]. Signals at comparable positions can be seen in the
spectra shown for the caa
3
-oxidase. In addition the
contributions of the heme propionates of the heme c can
be expected in a comparable spectral region.
CONCLUSIONS
The superfamily of heme copper oxidases includes a
number of enzymes, which show deviations to the centrally
discussed oxidases. The study of these aberrant systems is
important to understand the principles of these enzymes.
The cytochrome c oxidase from T. thermophilus studied in
this work lacks a key residue in the so-called D-pathway,
although it does show proton pumping activity. A Tyr–Ser
motif was previously suggested to replace the absent acidic
group in several oxidases [9]. In this work we could
observe modes at characteristic positions for the protona-
tion of a tyrosine side chain concomitant with the
reduction of the enzyme. A further alternative protonable
sitecouldbeseenat1714cm
)1
. This mode is observable in
the spectral range characteristic for protonated aspartic or
glutamic acid side chains and reflects its protonation with
the reduction of the protein. We note that these assign-
ments are tentative and can be supported by the combi-
nation with site-directed mutagenesis or labeling
experiments.
Interestingly potential titrations of the enzyme show a
slightly different redox-dependent behavior. It may be
suggested that the stronger cooperativity displays the
modulation of the enzyme to the different residues involved.
This is in line with the observation reported previously for
the caa
3
-oxidase from R. marinus and ba
3
-oxidase from
T. thermophilus [9,26]. An influence of the attached heme c
center is less likely on the basis of titrations in the presence
of cyanide.
The electrochemically induced FT-IR difference spectra
also include the contributions of the heme centers c, a and
a
3
. Together with the spectra in the presence of cyanide and
in direct comparison to previous resonance Raman data it
can be concluded that the hemes a and a
3
have a similar
structural environment comparised with bovine heart and
P. denitrificans oxidases [17].
In summary, the caa
3
-cytochrome c oxidase shows the
characteristic complex redox behavior and shows several
structural properties of a typical cytochrome c oxidase.
The presence of the two proton pathways is discussed as
one essential of the cytochrome c oxidase. The so-called
D-pathway seems to involve different residues here, most
likely a tyrosine and an aspartic or glutamic acid. It may
also be suggested that the complex redox behavior is crucial
for the cytochrome c oxidase mechanism, with some
variations, as observed here.
REFERENCES
1. Thomas, J.W., Puustinen, A., Alben, J.O., Gennis, R.B. &
Wikstro
¨
m, M. (1993) Substitution of asparagine for aspartate-
135 in subunit I of the cytochrome bo ubiquinol oxidase of
Escherichia coli eliminates-pumping activity. Biochemistry 32,
10923–10928.
2.Garcia-Horsman,J.A.,Barquera,B.,Rumbley,J.,Ma,J.&
Gennis, R.B. (1994) The superfamily of heme-copper respiratory
oxidases. J. Bacteriol. 176, 5587–5600.
3. Tsukihara, T., Aoyama, H., Yamashita, E., Tomizaki, T.,
Yamaguchi, H., Shinzawa-Itoh, K., Nakashima, R., Yaono, R. &
Yoshikawa, S. (1995) Structures of metal sites of oxidized
bovine heart cytochrome c oxidase at 2.8 A
˚
. Science 269, 1069–
1074.
4. Iwata, S., Ostermeier, C., Ludwig, B. & Michel, H. (1995) Struc-
ture at 2.8 A
˚
resolution of cytochrome c oxidase from Paracoccus
denitrificans. Nature 376, 660–669.
5. Ostermeier, C., Harrenga, A., Ermler, U. & Michel, H. (1997)
Structure at 2.7 A
˚
resolution of the Paracoccus denitrificans two-
subunit cytochrome c oxidase complexed with an antibody FV
fragment. Proc. Natl Acad. Sci. 94, 10547–10553.
6. Pereira, M.M., Santana, M. & Teixeira, M. (2001) A novel
scenario for the evolution of haem-copper oxygen reductases.
Biochim. Biophys. Acta. 1505, 185–208.
7. Yoshida, T. & Fee, J.A. (1984) Studies on cytochrome c oxidase
activity of the cytochrome c
1
aa
3
complex from Thermus thermo-
philus. J. Biol. Chem. 259, 1031–1036.
8.Mather,M.W.,Springer,P.,Hensel,S.,Buse,G.&Fee,J.A.
(1993) Cytochrome oxidase genes from Thermus thermophilus.
Nucleotide sequence of the fused gene and analysis of the deduced
primary structures for subunits I and III of cytochrome caa
3
.
J. Biol. Chem. 268, 5395–5408.
9. Pereira, M.M., Verkhovskaya, M.L., Teixeira, M. & Verkhovsky,
M.I. (2000) The caa
3
terminal oxidase of Rhodothermus marinus
lacking the key glutamate of the
D
-channel is a proton pump.
Biochemistry 39, 6336–6340.
10. Soulimane, T., Buse, G., Bourenkov, G.P., Bartunik, H.D.,
Huber, R. & Than, M.E. (2000) Structure and mechanism of the
aberrant ba
3
cytochrome c oxidase from Thermus thermophilus.
EMBO J. 19, 1766–1776.
11. Buse, G., Hensel, S. & Fee, J.A. (1989) Cytochrome oxidase genes
from Thermus thermophilus. Nucleotide sequence of the fused gene
and analysis of the deduced primarystructures for subunits I and
III of cytochrome caa
3
. Eur J. Biochem. 181, 261–268.
12. Fee, J.A., Yoshida, T., Surerus, K.K. & Mather, M.W. (1993)
cytochrome caa
3
from the thermophilic bacterium Thermus ther-
mophilus: a member of the heme-copper oxidase superfamily.
J. Bioenergetics Biomembranes 25, 103–114.
13. Mather, M.W., Springer, P. & Fee, J.A. (1991) Cytochrome oxi-
dase genes from Thermus thermophilus. Nucleotide sequence and
analysis of the deduced primary structure of subunit IIc of cyto-
chrome caa
3
. J. Biol. Chem. 266, 5025–5035.
14. Trumpower, B.L. (1991) The three-subunit cytochrome bc
1
com-
plex of Paracoccus denitrificans. Its physiological function, struc-
ture, and mechanism of electron transfer and energy transduction.
J. Bioenerg. Biomembr. 23, 241–255.
15. Soulimane,T.,vonWalter,M.,Hof,P.,Than,M.E.,Huber,R.&
Buse, G. (1997) Cytochrome-c552 from Thermus thermophilus:a
functional and crystallographic investigation. Biochem. Biophys.
Res. Comm. 237, 572–576.
16. Yoshida, T. & Fee, J.A. (1985) Potentiometric study of cyto-
chrome c
1
aa
3
from Thermus thermophilus. J. Inorg. Biochim. 23,
279–288.
17. Gerscher, S., Hildebrandt, P., Soulimane, T. & Buse, G. (1998)
Resonance Raman spectroscopic study of the caa
3
oxidase from
Thermus thermophilus. Biospectroscopy 4, 365–377.
Ó FEBS 2002 Characterization of T. thermophilus caa
3
oxidase (Eur. J. Biochem. 269) 4837
18. Moss, D.A., Nabedryk, E., Breton, J. & Ma
¨
ntele, W. (1990)
Redox-linked conformational changes in proteins detected by a
combination of infrared spectroscopy and protein electro-
chemistry. Evaluation of the technique with cytochrome c. Eur. J.
Biochem. 187, 565–572.
19. Hellwig, P., Behr, J., Ostermeier, C., Richter, O.M., Pfitzner, U.,
Odenwald, A., Ludwig, B., Michel, H. & Ma
¨
ntele, W. (1998)
Involvement of glutamic acid 278 in the redox reaction of the
cytochrome c oxidase from Paracoccus denitrificans investigated
by FTIR spectroscopy. Biochemistry 37, 7390–7399.
20. Wikstro
¨
m, M.K., Krab, K. & Saraste, M. (1981) Cytochrome
oxidase, a synthesis. Academic Press, New York.
21. Babcock, G.T., Vickery, L.E. & Palmer, G. (1978) The electronic
state of heme in cytochrome oxidase II. Oxidation–reduction
potential interactions and heme iron spin state behavior observed
in reductive titrations. J. Biol. Chem. 7, 2400–2411.
22. Hendler, R.W. & Westerhoff, H.V. (1992) Redox interactions in
cytochrome c oxidase: from the ÔneoclassicalÕ toward ÔmodernÕ
models. Biophy. J. 63, 1586–1604.
23. Reddy, K.V., Hendler, R.W. & Bunow, B. (1986) Complete
analysis of the cytochrome components of beef heart mitochon-
dria in terms of spectra and redox properties. Cytochromes aa
3
.
Biophys. J. 49, 705–715.
24. Hendler, R.W., Reddy, K.V., Shrager, R.I. & Caughey, W.S.
(1986) Analysis of the spectra and redox properties of pure cyto-
chromes aa
3
. Biophys. J. 49, 717–729.
25. Sidhu, G.S. & Hendler, R.W. (1990) Characterization of two low
Em forms of cytochrome a
3
and their carbon monoxide complexes
in mammalian cytochrome c oxidase. Biophys. J. 57, 1125–1140.
26. Hellwig, P., Soulimane, T., Buse, G. & Ma
¨
ntele, W. (1999) Elec-
trochemical, FTIR, and UV/VIS spectroscopic properties of the
ba
3
oxidase from Thermus thermophilus. Biochemistry 38, 9648–
9658.
27. Babcock, G.T. (1988) Raman scattering by cytochrome oxidase
and by heme a model compounds. In Biological Applications of
Resonance Raman Spectroscopy (T.Spiro,ed.),pp.294.Wileyand
Sons, New York.
28. Harmon, P.A., Hendler, R.W. & Levin, I.W. (1994) Resonance
Raman and optical spectroscopic monitoring of heme a redox
states in cytochrome c oxidase during potentiometric titrations.
Biochemistry 33, 699–707.
29. Ching, Y.C., Argade, P.V. & Rousseau, D.L. (1985) Resonance
raman spectra of CN-bound cytochrome oxidase: spectral isola-
tion of cytochromes a2+, a3(2+), and a3(2+)(CN-). Biochem-
istry. 27, 4938–4946.
30. Hellwig, P., Grzybek, S., Behr, J., Ludwig, B., Michel, H. &
Ma
¨
ntele, W. (1999) Electrochemical and ultraviolet/visible/infra-
red spectroscopic analysis of heme a and a
3
redox reactions in the
cytochrome c from Paracoccus denitrificans:separationofhemea
and a
3
contributions and assignment of vibrational modes.
Biochemistry 38, 1685–1694.
31. Yoshikawa, S. & Caughey, W.S. (1990) Infrared evidence of
cyanide binding to iron and copper sites in bovine heart cyto-
chrome c oxidase. Implications regarding oxygen reduction.
J. Biol. Chem. 265, 7945–7958.
32. Yoshikawa, S., Mochizuki, M., Zhao, X.J. & Caughey, W.S.
(1995) Effects of overall oxidation state on infrared spectra of
heme a
3
cyanideinbovineheartcytochromec oxidase. Evidence
of novel mechanistic roles for CuB. J. Biol. Chem. 270, 4270–4279.
33. Tsubaki, M., Matsushita, K., Adachi, O., Hirota, S., Kitagawa, T.
& Hori, H. (1997) Resonance Raman, infrared, and EPR
investigation on the binuclear site structure of the heme-copper
ubiquinol oxidases from Acetobacter aceti: effect of the heme
peripheral formyl group substitution. Biochemistry 36, 13034–
13042.
34. Hellwig,P.,Rost,B.,Kaiser,U.,Ostermeier,C.,Michel,H.&
Ma
¨
ntele, W. (1996) Carboxyl group protonation upon reduction
of the Paracoccus denitrificans cytochrome c oxidase: direct evi-
dence by FTIR spectroscopy. FEBS-Lett. 385, 53–57.
35. Lu
¨
bben, M. & Gerwert, K. (1996) Redox FTIR difference spec-
troscopy using caged electrons reveals contributions of carboxyl
groups to the catalytic mechanism of haem-copper oxidases.
FEBS-Lett. 397, 303–307.
36. Yamazaki, Y., Kandori, H. & Mogi, T. (1999) Effects of subunit I
mutations on redox-linked conformational changes of the
Escherichia coli bo-type ubiquinol oxidase revealed by Fourier-
transform infrared spectroscopy. J. Biochem. (Tokyo) 126,
194–199.
37. Venyaminov, S.Y. & Kalnin, N.N. (1990) Quantitative IR spec-
trophotometry of peptide compounds in water (H
2
O) solutions. I.
Spectral parameters of amino acid residue absorption bands.
Biopolymers 30, 1243–1257.
38. Hienerwadel, R., Boussac, A., Breton, J., Diner, B. & Berthomieu,
C. (1997) Fourier transform infrared difference spectroscopy of
photosystem II tyrosine D using site-directed mutagenesis and
specific isotope labeling. Biochemistry 36, 14712–14723.
39. Michel, H., Behr. J., Harrenga, A. & Kannt, A. (1998) cytochrome
c oxidase: structure and spectroscopy. Ann. Rev. Biophys. Biomol.
Struct. 27, 329–356.
40. Behr, J., Hellwig, P., Ma
¨
ntele, W. & Michel, H. (1998) Redox
dependent changes at the heme propionates in cytochrome c oxi-
dase from Paracoccus denitrificans: direct evidence from FTIR
difference spectroscopy in combination with heme propionate
13
C
labeling. Biochemistry 37, 7400–7406.
41. Behr, J., Michel, H., Ma
¨
ntele, W. & Hellwig, P. (2000) Functional
properties of the heme propionates in cytochrome c oxidase from
Paracoccus denitrificans. Evidence from FTIR difference spectro-
scopy and site-directed mutagenesis. Biochemistry 39, 1356–1363.
4838 P. Hellwig et al.(Eur. J. Biochem. 269) Ó FEBS 2002