Tài liệu Báo cáo khoa học: "Improving Probabilistic Latent Semantic Analysis with Principal Component Analysis" ppt
Bạn đang xem bản rút gọn của tài liệu. Xem và tải ngay bản đầy đủ của tài liệu tại đây (191.46 KB, 8 trang )
Improving Probabilistic Latent Semantic Analysis
with Principal Component Analysis
Ayman Farahat
Palo Alto Research Center
3333 Coyote Hill Road
Palo Alto, CA 94304
Francine Chen
Palo Alto Research Center
3333 Coyote Hill Road
Palo Alto, CA 94304
Abstract
Probabilistic Latent Semantic Analysis
(PLSA) models have been shown to pro-
vide a better model for capturing poly-
semy and synonymy than Latent S eman-
tic Analysis (LSA). However, the param-
eters of a PLSA model are trained using
the Expectation Maximization (EM) algo-
rithm, and as a result, the trained model
is dependent on the initialization values so
that performance can be highly variable.
In this paper we present a method for using
LSA analysis to initialize a PLSA model.
We also investigated the performance of
our method for the tasks of text segmenta-
tion and retrieval on personal-size corpora,
and present results demonstrating the effi-
cacy of our proposed approach.
1 Introduction
In modeling a collection of documents for infor-
mation access applications, the documents are of-
ten represented as a “bag of words”, i.e., as term
vectors composed of the terms and corresponding
counts for each document. The term vectors for a
document collection can be organized into a term
by document co-occurrence matrix. When di-
rectly using these representations, synonyms and
polysemous terms, that is, terms with multiple
senses or meanings, are not handled well. Meth-
ods for smoothing the term distributions through
the use of latent classes have been shown to im-
prove the performance of a number of information
access tasks, including retrieval over smaller col-
lections (Deerwester et al., 1990), text segmenta-
tion (Brants et al., 2002), and text classification
(Wu and Gunopulos, 2002).
The Probabilistic Latent Semantic Analysis
model (PLSA) (Hofmann, 1999) provides a prob-
abilistic framework that attempts to capture poly-
semy and synonymy in text for applications such
as retrieval and segmentation. It uses a mixture
decomposition to model the co-occurrence data,
and the probabilities of words and documents are
obtained by a convex combination of the aspects.
The mixture approximation has a well defined
probability distribution and the factors have a clear
probabilistic meaning in terms of the mixture com-
ponent distributions.
The PLSA model computes the relevant proba-
bility distributions by selecting the model parame-
ter values that maximize the probability of the ob-
served data, i.e., the likelihood function. The stan-
dard method for maximum likelihood estimation
is the Expectation Maximization (EM) algorithm.
For a given initialization, the likelihood function
increases with EM iterations until a local maxi-
mum is reached, rather than a global m aximum,
so that the quality of the solution depends on the
initialization of the model. Additionally, the likeli-
hood values across different initializations are not
comparable, as we will show. Thus, the likelihood
function computed over the training data cannot be
used as a predictor of model performance across
different models.
Rather than trying to predict the best perform-
ing model from a set of models, in this paper we
focus on finding a good way to initialize the PLSA
model. We will present a framework for using La-
tent Semantic Analysis (LSA) (Deerwester et al.,
1990) to better initialize the parameters of a cor-
responding PLSA model. The EM algorithm is
then used to further refine the initial estimate. This
combination of L SA and PLSA leverages the ad-
vantages of both.
105
This paper is organized as follows: in section
2, we review related work in the area. In sec-
tion 3, we summarize related work on LSA and
its probabilistic interpretation. In section 4 we re-
view the PLSA model and in section 5 we present
our m ethod for initializing a PL SA model using
LSA model parameters. In section 6, we evaluate
the performance of our framework on a text seg-
mentation task and several smaller information re-
trieval tasks. And in section 7, we summarize our
results and give directions for future work.
2 Background
A number of different methods have been pro-
posed for handling the non-globally optimal so-
lution when using EM. These include the use of
Tempered EM (Hofmann, 1999), combining mod-
els from different initializations in postprocessing
(Hofmann, 1999; Brants et al., 2002), and try-
ing to find good initial values. For their segmen-
tation task, Brants et al. (2002) found overfit-
ting, which Tempered EM helps address, was not
a problem and that early stopping of EM provided
good performance and faster learning. Comput-
ing and combining different models is computa-
tionally expensive, so a method that reduces this
cost is desirable. Different methods for initializ-
ing E M include the use of random initialization
e.g., (Hofmann, 1999), k-means clustering, and an
initial cluster refinement algorithm (Fayyad et al.,
1998). K-means clustering is not a good fit to the
PLSA model in several ways: it is sensitive to out-
liers, it is a hard clustering, and the relation of the
identified clusters to the PLSA parameters is not
well defined. In contrast to these other initializa-
tion methods, we know that the LSA reduces noise
in the data and handles synonymy, and so should
be a good initialization. The trick is in trying to re-
late the LSA parameters to the PLSA parameters.
LSA is based on singular value decomposition
(SVD) of a term by document matrix and retain-
ing the top K singular values, mapping documents
and terms to a new representation in a latent se-
mantic space. It has been successfully applied in
different domains including automatic indexing.
Text similarity is better estimated in this low di-
mension space because synonyms are mapped to
nearby locations and noise is reduced, although
handling of polysemy is weak. In contrast, the
PLSA model distributes the probability mass of a
term over the different latent classes correspond-
ing to different senses of a word, and thus bet-
ter handles polysemy (Hofmann, 1999). The LSA
model has two additional desirable features. First,
the word document co-occurrence matrix can be
weighted by any weight function that reflects the
relative importance of individual words (e.g., tf-
idf). The weighting can therefore incorporate ex-
ternal knowledge into the model. Second, the
SVD algorithm is guaranteed to produce the ma-
trix of rank that minimizes the distance to the
original word document co-occurrence matrix.
As noted in Hofmann (1999), an important dif-
ference between PLSA and LSA is the type of ob-
jective function utilized. In LSA, this is the L2
or Frobenius norm on the word document counts.
In contrast, PLSA relies on maximizing the likeli-
hood function, which is equivalent to minimizing
the cross-entropy or Kullback-Leibler divergence
between the empirical distribution and the pre-
dicted model distribution of terms in documents.
A number of methods for deriving probabil-
ities from LSA have been suggested. For ex-
ample, Coccaro and Jurafsky (1998) proposed a
method based on the cosine distance, and Tipping
and Bishop (1999) give a probabilistic interpreta-
tion of principal component analysis that is for-
mulated within a maximum-likelihood framework
based on a specific form of Gaussian latent vari-
able model. In contrast, we relate the LSA param-
eters to the PLSA model using a probabilistic in-
terpretation of dimensionality reduction proposed
by Ding (1999) that uses an exponential distribu-
tion to model the term and document distribution
conditioned on the latent class.
3 LSA
We briefly review the LSA model, as presented
in Deerwester et al. (1990), and then outline the
LSA-based probability model presented in Ding
(1999).
The term to document association is presented
as a term-document matrix
.
.
.
.
.
.
.
.
.
.
.
.
(1)
containing the frequency of the index terms oc-
curring in documents. The frequency counts can
also be weighted to reflect the relative importance
of individual terms (e.g., Guo et al., (2003)).
is an dimensional column vector representing
106
document and is an dimensional row vec-
tor representing term . LSA represents terms and
documents in a new vector space with smaller di-
mensions that minimize the distance between the
projected terms and the original terms. This is
done through the truncated (to rank
) singular
value decomposition or
explicitly
.
.
.
.
.
.
(2)
Among all matrices of rank , is the one
that minimizes the Frobenius norm
3.1 LSA-based Probability Model
The LSA model based on SVD is a dimensional-
ity reduction algorithm and as such does not have
a probabilistic interpretation. However, under cer-
tain assumptions on the distribution of the input
data, the SVD can be used to define a probability
model. In this section, we summarize the results
presented in Ding (1999) of a dual probability rep-
resentation of LS A.
Assuming the probability distribution of a doc-
ument
is governed by characteristic (nor-
malized) document vectors, , and that
the are statistically independent fac-
tors, Ding (1999) shows that using maximum
likelihood estimation, the optimal solution for
are the left eigenvectors in the
SVD of used in LSA :
(3)
where is a normalization constant.
The dual formulation for the probability of term
in terms of the tight eigenvectors (i.e., the docu-
ment representations of the matrix
is:
(4)
where is a normalization constant.
Ding also shows that is related to by:
(5)
We will use Equations 3-5 in relating LSA to
PLSA in section 5.
4 PLSA
The PLSA model (Hofmann, 1999) is a generative
statistical latent class model: (1) select a document
with probability (2) pick a latent class
with probability and (3) generate a word
with probability , where
(6)
The joint probability between a word and docu-
ment, , is given by
and using Bayes’ rule can be written as:
(7)
The likelihood function is given by
(8)
Hofmann (1999) uses the EM algorithm to com-
pute optimal parameters. The E-step is given by
(9)
and the M-step is given by
(10)
(11)
(12)
4.1 Model Initialization and Performance
An important consideration in PLSA modeling is
that the performance of the model is strongly af-
fected by the initialization of the model prior to
training. Thus a method for identifying a good ini-
tialization, or alternatively a good trained model,
is needed. If the final likelihood value obtained
after training was well correlated with accuracy,
then one could train several PLSA models, each
with a different initialization, and select the model
with the largest likelihood as the best model. Al-
though, for a given initialization, the likelihood
107
Table 1: Correlation between the negative log-
likelihood and Average or BreakEven Precision
Data # Factors Average BreakEven
Precision Precision
Med 64 -0.47 -0.41
Med 256 -0.15 0.25
CISI 64 -0.20 -0.20
CISI 256 -0.12 -0.16
CRAN 64 0.03 0.16
CRAN 256 -0.15 0.14
CACM 64 -0.64 0.08
CACM 256 -0.22 -0.12
increases to a locally optimal value with each it-
eration of EM, the final likelihoods obtained from
different initializations after training do not corre-
late well with the accuracy of the corresponding
models. This is shown in Table 1, which presents
correlation coefficients between likelihood values
and either average or breakeven precision for sev-
eral datasets with 64 or 256 latent classes, i.e.,
factors. Twenty random initializations were used
per evaluation. Fifty iterations of E M per initial-
ization were run, which empirically is more than
enough to approach the optimal likelihood. The
coefficients range from -0.64 to 0.25. The poor
correlation indicates the need for a method to han-
dle the variation in performance due to the influ-
ence of different initialization values, for example
through better initialization methods.
Hofmann (1999) and Brants (2002) averaged re-
sults from five and four random initializations, re-
spectively, and empirically found this to improve
performance. The combination of models enables
redundancies in the models to minimize the ex-
pression of errors. We extend this approach by re-
placing one random initialization with one reason-
ably good initialization in the averaged models.
We will empirically show that having at least one
reasonably good initialization improves the perfor-
mance over simply using a number of different ini-
tializations.
5 LSA-based Initialization of PLSA
The EM algorithm for estimating the parameters
of the PLSA model is initialized with estimates of
the model parameters
. Hof-
mann (1999) relates the parameters of the PLSA
model to an LSA model as follows:
(13)
(14)
(15)
(16)
Comparing with Equation 2, the LSA factors,
and correspond to the factors and
of the PLSA model and the mixing propor-
tions of the latent classes in PLSA, , corre-
spond to the singular values of the SVD in LSA.
Note that we can not directly identify the matrix
with and with since both
and contain negative values and are not prob-
ability distributions. However, using equations 3
and 4, we can attach a probabilistic interpretation
to LSA, and then relate and with the
corresponding LSA matrices. We now outline this
relation.
Equation 4 represents the probability of occur-
rence of term in the different documents condi-
tioned on the SVD right eigenvectors. The
element in equation 15 represent the probability
of term conditioned on the latent class . As
in the analysis above, we assume that the latent
classes in the LSA model correspond to the latent
classes of the PLSA model. Making the simplify-
ing assumption that the latent classes of the LSA
model are conditionally independent on term ,
we can express the as:
(17)
And using Equation (4) we get:
(18)
Thus, other than a constant that is based on
and , we can relate each to a cor-
responding . We make the simplifying as-
sumption that is constant across terms and
normalize the exponential term to a probability:
Relating the term in the PLSA model to the
distribution of the LSA term over documents,
,
and relating the latent class in the PLSA model
108
to the LSA right eigenvector , we then estimate
from , so that:
(19)
Similarly, relating the document in the PLSA
model to the distribution of LSA document over
terms, , and using Equation 5 to show that is
related to we get:
(20)
The singular values, in Equation 2, are by
definition positive. Relating these values to the
mixing proportions, , we generalize the re-
lation using a function , where is any non-
negative function over the range of all , and nor-
malize so that the estimated is a probability:
(21)
We have experimented with different forms of
including the identity function and the logarithmic
function. For our experiments, we used
.
In our LSA -initialized PLSA model, we ini-
tialize the PLS A model parameters using Equa-
tions 19-21. The EM algorithm is then used be-
ginning with the E -step as outlined in Equations
9-12.
6 Results
In this section we evaluate the performance of
LSA-initialized PLSA (LSA-PLSA). We compare
the performance of LSA-PL SA to LSA only and
PLSA only, and also compare its use in combi-
nation with other models. We give results for a
smaller information retrieval application and a text
segmentation application, tasks where the reduced
dimensional representation has been successfully
used to improve performance over simpler word
count models such as tf-idf.
6.1 System Description
To test our approach for PL SA initializa-
tion we developed an LSA implemen-
tation based on the SVDLIBC package
( dr/SVDLIBC/) for com-
puting the singular values of sparse matrices. The
PLSA implementation was based on an earlier
implementation by Brants et al. (2002). For each
of the corpora, we tokenized the documents and
used the LinguistX morphological analyzer to
stem the terms. We used entropy weights (Guo
et al., 2003) to weight the terms in the document
matrix.
6.2 Information Retrieval
We compared the performance of the LSA-PLSA
model against randomly-initialized PLSA and
against LSA for four different retrieval tasks. In
these tasks, the retrieval is over a smaller cor-
pus, on the order of a personal document collec-
tion. We used the following four standard doc-
ument collections: (i) MED (1033 document ab-
stracts from the National Library of Medicine), (ii)
CRAN (1400 documents from the Cranfield Insti-
tute of Technology), (iii) CISI (1460 abstracts in
library science from the Institute for Scientific In-
formation) and (iv) CACM (3204 documents from
the association for computing machinery). For
each of these document collections, we computed
the LSA, PLSA, and LSA-PLSA representations
of both the document collection and the queries
for a range of latent classes, or factors.
For each data set, we used the computed repre-
sentations to estimate the similarity of each query
to all the documents in the original collection. For
the LSA model, we estimated the similarity using
the cosine distance between the reduced dimen-
sional representations of the query and the can-
didate document. For the PLSA and LSA-PLSA
models, we first computed the probability of each
word occurring in the document,
,
using Equation 7 and assuming that is uni-
form. This gives us a PLSA-smoothed term repre-
sentation of each document. We then computed
the Hellinger similarity (Basu et al., 1997) be-
tween the term distributions of the candidate doc-
ument, , and query, . In all of the
evaluations, the results for the PLSA model were
averaged over four different runs to account for the
dependence on the initial conditions.
6.2.1 Single Models
In addition to LSA-based initialization of the
PLSA model, we also investigated initializing the
PLSA model by first running the “k-means” al-
gorithm to cluster the documents into classes,
where is the number of latent classes and then
initializing
based on the statistics of word
occurrences in each cluster. We iterated over the
109
number of latent classes starting from 10 classes
up to 540 classes in increments of 10 classes.
0 50 100 150 200 250 300 350 400 450 500
0.06
0.08
0.1
0.12
0.14
0.16
0.18
0.2
0.22
0.24
0.26
Number of factors
Avg Precision
Avg Precision on CACM
LSAPLSA
PLSA
LSA
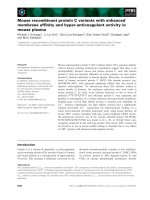
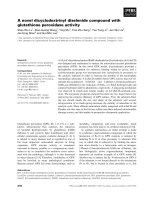
Figure 1: Average Precision on CACM Data set
We evaluated the retrieval results (at the 11 stan-
dard recall levels as well as the average precision
and break-even precision) using manually tagged
relevance. Figure 1 shows the average precision
as a function of the number of latent classes for
the CACM collection, the largest of the datasets.
The LSA-PLSA model performance was better
than both the LSA performance and the PLSA per-
formance at all class sizes. This same general
trend was observed for the CISI dataset. For the
two smallest datasets, the LSA-PL SA model per-
formed better than the randomly-initialized PLSA
model at all class sizes; it performed better than
the LSA model at the larger classes sizes where
the best performance is obtained.
Table 2: Retrieval Evaluation with Single Models.
Best performing model for each dataset/metric is
in bold.
Data Met. LSA PLSA LSA- kmeans-
PLSA PLSA
Med Avg. 0.55 0.38 0.52 0.37
Med Brk. 0.53 0.39 0.54 0.39
CISI Avg. 0.09 0.12 0.14 0.12
CISI Brk. 0.11 0.15 0.17 0.15
CACM Avg. 0.13 0.21 0.25 0.19
CACM Brk. 0.15 0.24 0.28 0.22
CRAN Avg. 0.28 0.30 0.32 0.23
CRAN Brk. 0.28 0.29 0.31 0.23
In Table 2 the performance for each model using
the optimal number of latent classes is shown. The
results show that LSA-PLSA outperforms LSA on
7 out of 8 evaluations. LSA-PLSA outperforms
both random and k-means initialization of PLSA
in all evaluations. In addition, performance us-
ing random initialization was never worse than k-
means initialization, which itself is sensitive to ini-
tialization values. Thus in the rest of our experi-
ments we initialized PLSA models using the sim-
pler random-initialization instead of k-means ini-
tialization.
0 100 200 300 400 500 600
0.13
0.135
0.14
0.145
0.15
0.155
0.16
0.165
Avg Precision on CISI with Multiple Models
Number of factors
Avg. Precision
LSA−PLSA−LSAPLSA
4PLSA
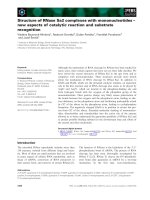
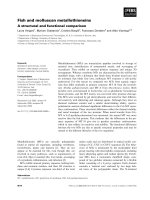
Figure 2: Average Precision on CISI using Multi-
ple Models
6.2.2 Multiple Models
We explored the use of an LSA-PLSA model
when averaging the similarity scores from multi-
ple models for ranking in retrieval. We compared
a baseline of 4 randomly-initialized PLSA models
against 2 averaged models that contain an LSA-
PLSA model: 1) 1 LSA, 1 PLSA, and 1 LSA-
PLSA model and 2) 1 LSA-PLSA with 3 PLSA
models. We also compared these models against
the performance of an averaged model without an
LSA-PLSA model: 1 LSA and 1 P LSA model. In
each case, the PL SA models were randomly ini-
tialized. Figure 2 shows the average precision as
a function of the number of latent classes for the
CISI collection using multiple models. In all class
sizes, a combined model that included the LSA-
initialized PLSA model had performance that was
at least as good as using 4 PLSA models. This was
also true for the CRA N dataset. For the other two
datasets, the performance of the combined model
was always better than the performance of 4 PLSA
models when the number of factors was no more
than 200-300, the region where the best perfor-
mance was observed.
Table 3 summarizes the results and gives the
best performing model for each task. Comparing
110
Table 3: Retrieval Evaluation with Multiple Mod-
els. Best performing model for each dataset and
metric are in bold. L-PLSA corresponds to LSA -
PLSA
Data Met 4PLSA LSA LSA L-PLSA
Set PLSA PLSA 3PLSA
L-PLSA
Med Avg 0.55 0.620 0.567 0.584
Med Brk 0.53 0.575 0.545 0.561
CISI Avg 0.152 0.163 0.152 0.155
CISI Brk 0.18 0.197 0.187 0.182
CACM Avg 0.278 0.279 0.249 0.276
CACM Brk 0.299 0.296 0.275 0.31
CRAN Avg 0.377 0.39 0.365 0.39
CRAN Brk 0.358 0.368 0.34 0.37
Tables 2 and 3, note that the use of multiple mod-
els improved retrieval results. Table 3 also indi-
cates that combining 1 LSA, 1 PLSA and 1 LSA-
PLSA models outperformed the combination of 4
PLSA models in 7 out of 8 evaluations.
For our data, the time to compute the LSA
model is approximately 60% of the time to com-
pute a PLSA model. The running time of the “LSA
PLSA LSA-PLSA” model requires computing 1
LSA and 2 PLSA models, in contrast to 4 mod-
els for the 4PLSA model, therefore requiring less
than 75% of the running time of the 4PLSA model.
6.3 Text Segmentation
A number of researchers, (e.g., Li and Yamanishi
(2000); Hearst (1997)), have developed text seg-
mentation systems. Brants et. al. (2002) devel-
oped a system for text segmentation based on a
PLSA model of similarity. The text is divided into
overlapping blocks of sentences and the PLSA
representation of the terms in each block, ,
is computed. The similarity between pairs of ad-
jacent blocks is computed using and
and the Hellinger similarity measure. The
positions of the largest local minima, or dips, in
the sequence of block pair similarity values are
emitted as segmentation points.
We compared the use of different initializations
on 500 documents created from Reuters-21578,
in a manner similar to Li and Yamanishi (2000).
The performance is measured using error proba-
bility at the word and sentence level (Beeferman
et al., 1997), and , respectively. This mea-
sure allows for close matches in segment bound-
aries. Specifically, the boundaries must be within
words/sentences, where is set to be half the av-
Table 4: Single Model Segmentation Word and
Sentence Error Rates (%). PLSA error rate at the
optimal number of classes in terms of
is in
italic. Best performing model is in bold without
italic.
Num Classes LSA-PLSA PLSA
64 2.14 2.54 3.19 3.51
100 2.31 2.65 2.94 3.35
128 2.05 2.57 2.73 3.13
140 2.40 2.69 2.72 3.18
150 2.35 2.73 2.91 3.27
256 2.99 3.56 2.87 3.24
1024 3.72 4.11 3.19 3.51
2048 2.72 2.99 3.23 3.64
erage segment length in the test data. In order to
account for the random initial values of the PLSA
models, we performed the whole set of experi-
ments for each parameter setting four times and
averaged the results.
6.3.1 Single Models for Segmentation
We compared the segmentation performance
using an LSA-PLSA model against the randomly-
initialized PLSA models used by Brants et al.
(2002). Table 4 presents the performance over dif-
ferent classes sizes for the two models. Compar-
ing performance at the optimum class size for each
model, the results in Table 4 show that the LSA-
PLSA model outperforms PLSA on both word and
sentence error rate.
Table 5: Multiple Model Segmentation Word and
Sentence Error Rates (%). Performance at the op-
timal number of classes in terms of is in italic.
Best performing model is in bold without italic.
Num 4PLSA LSA-PLSA LSA-PLSA
Class 2PLSA 3PLSA
64 2.67 2.93 2.01 2.24 1.59 1.78
100 2.35 2.65 1.59 1.83 1.37 1.62
128 2.43 2.85 1.99 2.37 1.57 1.88
140 2.04 2.39 1.66 1.90 1.77 2.07
150 2.41 2.73 1.96 2.21 1.86 2.12
256 2.32 2.62 1.78 1.98 1.82 1.98
1024 1.85 2.25 2.51 2.95 2.36 2.77
2048 2.88 3.27 2.73 3.06 2.61 2.86
6.3.2 Multiple Models for Segmentation
We explored the use of an LSA-PLSA model
when averaging multiple PLSA models to reduce
the effect of poor model initialization. In partic-
ular, the adjacent block similarity from multiple
111
models was averaged and used in the dip compu-
tations. For simplicity, we fixed the class size of
the individual models to be the same for a partic-
ular combined model and then computed perfor-
mance over a range of class sizes. We compared a
baseline of four randomly initialized PLSA mod-
els against two averaged models that contain an
LSA-PLSA model: 1) one LSA-PLSA with two
PLSA models and 2) one LSA-PLSA with three
PLSA models. The best results were achieved us-
ing a combination of PLSA and LSA-PLSA mod-
els (see Table 5). And all m ultiple m odel combina-
tions performed better than a single model (com-
pare Tables 4 and 5), as expected.
In terms of computational costs, it is less costly
to compute one LSA-PL SA model and two PL SA
models than to compute four PLSA models. In
addition, the LSA-initialized models tend to per-
form best with a smaller number of latent vari-
ables than the number of latent variables needed
for the four PLSA model, also reducing the com-
putational cost.
7 Conclusions
We have presented LSA-PLSA, an approach for
improving the performance of PLSA by lever-
aging the best features of PL SA and LSA. Our
approach uses LSA to initialize a PLSA model,
allowing for arbitrary weighting schemes to be
incorporated into a PLSA model while leverag-
ing the optimization used to improve the esti-
mate of the PLSA parameters. We have evaluated
the proposed framework on two tasks: personal-
size information retrieval and text segmentation.
The LSA-PLSA model outperformed P LSA on all
tasks. And in all cases, combining PLSA -based
models outperformed a single model.
The best performance was obtained with com-
bined models when one of the models was the
LSA-PLSA m odel. When combining multiple
PLSA models, the use of LSA-PLS A in combi-
nation with either two PLSA models or one PLSA
and one LSA model improved performance while
reducing the running time over the combination of
four or more PLSA models as used by others.
Future areas of investigation include quanti-
fying the expected performance of the LSA-
initialized PLSA model by comparing perfor-
mance to that of the empirically best performing
model and examining whether tempered EM could
further improve performance.
References
Ayanendranath Basu, Ian R. Harris, an d Srabashi Basu.
1997. Minimum distance estimation: The approach
using density-based distances. In G. S. Maddala
and C. R. Rao, editors, Handbook of Statistics, vol-
ume 15, pages 21–48. North-Holland.
Doug Beeferman, Adam Berger, and John Lafferty.
1997. Statistical models for text segmentation. Ma-
chine Learning, (3 4):177–210.
Thorsten Brants, Francine Chen, and Ioannis Tsochan-
taridis. 20 02. Topic-based document segmentation
with probabilistic latent semantic ana lysis. In Pro-
ceedings of Conference on Information and Knowl-
edge Management, pages 211–218.
Noah Coccaro and Daniel Jurafsky. 1998. Towards
better integration of semantic predictors in statistical
language modeling . In Proceedings of ICSLP-98,
volume 6, pages 2403–2406.
Scott C. Deerwester, Susan T. Dumais, Thomas K. Lan-
dauer, George W. Furnas, and Richard A. Harshman.
1990. Indexing by latent semantic analysis. Jour-
nal of the American Society of Information Science,
41(6):391–40 7.
Chris H. Q. Ding. 1999. A similarity- based probability
model for latent semantic indexing. In Proceedings
of SIGIR-99, pages 58–65.
Usama M. Fayyad, Cory Reina, and Paul S. Bradley.
1998. Initialization of iterative refi nement cluster-
ing algorithms. In Knowledge Discovery and Data
Mining, pages 194–198.
David Guo, Michael Berry, Bryan Thompson , and Sid -
ney Balin. 2003. Knowledge-enhanced latent se-
mantic ind exing. Information Retrieval, 6(2):225–
250.
Marti A. Hearst. 1997. Texttiling: Segmenting text
into multi- paragraph subtopic passages. Computa-
tional Linguistics, 23(1):33–64.
Thomas Hofmann. 1999. Probabilistic latent semantic
indexing. I n Proceedings of SIGIR-99, pages 35–44.
Hang Li and Kenji Yamanishi. 2000. Topic analysis
using a fi nite mixture model. In Proceedings of Joint
SIGDAT Conference on Empirical Methods in Nat-
ural Language Processing and Very Large Corpora,
pages 35–44.
Michael Tipping and Christopher Bishop. 1999. Prob-
abilistic principal component analysis. Journal of
the Royal Statistical Society, Series B, 61(3):611–
622.
Huiwen Wu and Dimitrios Gunopulos. 2002. Evaluat-
ing the utility of statistical phrases and latent seman-
tic indexing for text classifi cation. In Proceedings
of IEEE International Conference on Data Mining,
pages 713–71 6.
112