Tài liệu Báo cáo khoa học: "Matching Readers’ Preferences and Reading Skills with Appropriate Web Texts" docx
Bạn đang xem bản rút gọn của tài liệu. Xem và tải ngay bản đầy đủ của tài liệu tại đây (124.46 KB, 4 trang )
Proceedings of the EACL 2009 Demonstrations Session, pages 49–52,
Athens, Greece, 3 April 2009.
c
2009 Association for Computational Linguistics
Matching Readers’ Preferences and Reading Skills with Appropriate Web
Texts
Eleni Miltsakaki
University of Pennsylvania
Philadelphia, U.S.A.
Abstract
This paper describes Read-X, a system designed to
identify text that is appropriate for the reader given
his thematic choices and the reading ability asso-
ciated with his educational background. To our
knowledge, Read-X is the first web-based system
that performs real-time searches and returns results
classified thematically and by reading level within
seconds. To facilitate educators or students search-
ing for reading material at specific reading levels,
Read-X extracts the text from the html, pdf, doc,
or xml format and makes available a text editor for
viewing and editing the extracted text.
1 Introduction
The automatic analysis and categorization of web
text has witnessed a booming interest due to in-
creased text availability of different formats (txt,
ppt, pdf, etc), content, genre and authorship. The
web is witnessing an unprecedented explosion in
text variability. Texts are contributed by users of
varied reading and writing skills as opposed to the
earlier days of the Internet when text was mostly
published by companies or institutions. The age
range of web users has also widened to include
very young school and sometimes pre-school aged
readers. In schools the use of the Internet is
now common to many classes and homework as-
signments. However, while the relevance of web
search results to given keywords has improved
substantially over the past decade, the appropri-
ateness of the results is uncatered for. On a key-
word search for ‘snakes’ the same results will be
given whether the user is a seven year old elemen-
tary school kid or a snake expert.
Prior work on assessing reading level includes
(Heilman et al., 2007) who experiment with a sys-
tem that employs grammatical features and vocab-
ulary to predict readability. The system is part of
the the REAP tutor, designed to help ESL learn-
ers improve their vocabulary skills. REAP’s infor-
mation retrieval system (Collins-Thompson and
Callan, 2004) is based on web data that have been
annotated and indexed off-line. Also, relatedly,
(Schwarm and Ostendorf, 2005) use a statistical
language model to train SVM classifiers to clas-
sify text for grade levels 2-5. The classifier’s pre-
cision ranges from 38%- 75% depending on the
grade level.
In this demo, we present Read-X, a system de-
signed to evaluate if text retrieved from the web
is appropriate for the intended reader. Our sys-
tem analyzes web text and returns the thematic
area and the expected reading difficulty of the re-
trieved texts.
1
To our knowledge, Read-X is the
first system that performs in real time a)keyword
search, b)thematic classification and c)analysis of
reading difficulty. Search results and analyses are
returned within a few seconds to a maximum of a
minute or two depending on the speed of the con-
nection. Read-X is enhanced with an added com-
ponent which predicts difficult vocabulary given
the user’s educational level and familiarity with
specific thematic areas.
2 Web search and text classification
Internet search. Read-X uses Yahoo! Web Ser-
vices to execute the keyword search. When the
search button is clicked or the enter key depressed
after typing in a keyword, Read-X sends a search
request to Yahoo! including the keywords and, op-
tionally, the number of results to return.
Text extraction. The html, xml, doc or pdf doc-
uments stored at each URL are then extracted in a
cleaned-up, tag-free, text format. At this stage a
decision is made as to whether a web page con-
tains reading material and not “junk”. This is a
non-trivial task. (Petersen and Ostendorf, 2006)
use a classifier for this task with moderate success.
We “read” the structure of the html text to decide if
the content is appropriate and when in doubt, we
1
A demo video can be accessed at the blogsite
www.eacl08demo.blogspot.com.
49
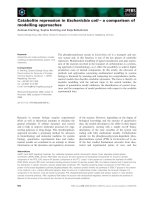
Figure 1: Search results and analysis of readability
err on the side of throwing out potentially useful
content.
Readability analysis. For printed materials,
there are a number of readability formulas used
to measure the difficulty of a given text; the New
Dale-Chall Readability Formula, The Fry Read-
ability Formula, the Gunning-Fog Index, the Au-
tomated Readability Index, and the Flesch Kin-
caid Reading Ease Formula are a few examples
(see (DuBay, 2007) for an overview and refer-
ences). Usually, these formulas count the number
of syllables, long sentences, or difficult words in
randomly selected passages of the text. To auto-
mate the process of readability analysis, we chose
three Readability algorithms: Lix, RIX, see (An-
derson, 1983), and Coleman-Liau, (Coleman and
Liau, 1975), which were best suited for fast cal-
culation and provide the user with either an ap-
proximate grade level for the text or a readability
classification of very easy, easy, standard, difficult
or very difficult. When each text is analyzed, the
following statistics are computed: total number
of sentences, total number of words, total number
of long words (seven or more characters), and to-
tal number of letters in the text. Steps have been
taken to develop more sophisticated measures for
future implementations. Our current research aims
at implementing more sophisticated reading diffi-
culty measures, including reader’s familiarity with
the topic, metrics of propositional density and dis-
course coherence, without compromising speed of
Formula r3 r4 r5
Lix 10.2 (9-11) 11.7 (10-13) 11.1 (9-12)
RIX 10.2 (8-13) 12.3 (10-13) 11.5 (10-13)
Coleman-Liau 11.65 (9.2-13.3) 12.67 (12.2-13.1) 12.6 (11.4-14.1)
All 10.6 12.3 11.7
Table 1: Comparison of scores from three read-
ability formulae.
processing.
To evaluate the performance of the reading
scores we used as groundtruth a corpus of web-
texts classified for readability levels r3, r4, r5 cor-
responding to grade levels 7-8, 9-10, and 11-13 re-
spectively.
2
The content of the corpus is a collec-
tion of web-sites with educational content, picked
by secondary education teachers. For 90 docu-
ments, randomly selected from levels 3-5 (30 per
level), we computed the scores predicted by Lix,
RIX and Coleman-Liau.
The average scores assigned by the three formu-
las are shown in Table (1). The numbers in paren-
theses show the range of scores assigned by each
formula for the collection of documents under
each reading level. The average score of all formu-
las for r3 is 10.6 which is sufficiently differentiated
from the average 12.3. for r4. The average score of
all formulas for r5, however, is 11.7, which cannot
be used to differentiate r4 from r5. These results
indicate that at least by comparison to the data in
2
With the exception of Spache and Powers-Sumner-Kearl
test, all other readability formulas are not designed for low
grade readability levels.
50
Classifier Basic categories Subcategories
Naive Bayes 66% 30%
MaxEnt 78% 66%
MIRA 76% 58%
Table 2: Performance of text classifiers.
our corpus, the formulas can make reasonable dis-
tinctions between middle school and high school
grades but they cannot make finer distinctions be-
tween different high-school grades. A more reli-
able form of evaluation is currently underway. We
have designed self-paced reading experiments for
different readability scores produced by five for-
mulas (RIX, Lix, Coleman-Liau, Flesch-Kincaid
and Dale-Chall). Formulas whose predictions will
more closely reflect reading times for text compre-
hension will be preferred and form the basis for
a better metric in the future. In the current im-
plementation, Read-X reports the scores for each
formula in a separate column. Other readability
features modeling aspects of discourse coherence
(e.g.,(Miltsakaki and Kukich, 2004), (Barzilay and
Lapata, 2008), (Bruss et al., 2004), (Pitler and
Nenkova, 2008)) can also be integrated after psy-
cholinguistic evaluation studies are completed and
their computation of such features can be made in
real time.
Text classification For the text classification
task, we a) built a corpus of prelabeled thematic
categories and b) compared the performance of
three classifiers to evaluate their suitability for the-
matic classification task.
3
We collected a corpus of approximately 3.4 mil-
lion words. The corpus contains text extracted
from web-pages that were previously manually
classified per school subject area by educators.
We organized it into a small thematic hierarchy,
with three sets of labels: a) labels for supercat-
egories, b) labels for basic categories and c) la-
bels for subcategories. There are 3 supercategories
(Literature, Science, Sports), 8 basic categories
(Arts, Career and Business, Literature, Philosophy
and Religion, Science, Social studies, Sports and
health, Technology) and 41 subcategories (e.g.,
the subcategories for Literature are Art Criticism,
Art History, Dance, Music, Theater).
The performance of the classifiers trained on the
basic categories and subcategories data is shown
3
We gratefully acknowledge MALLET, a collection of
statistical NLP tools written in Java, publicly available at
and Mark Dredze for
his help installing and running MIRA on our data.
in Table (2). All classifiers perform reasonably
well in the basic categories classification task but
are outperformed by the MaxEnt classifier in both
the basic categories and subcategories classifica-
tions. The supercategories classification by Max-
Ent (not shown in the Table) is 93%. As expected,
the performance of the classifiers deteriorates sub-
stantially for the subcategories task. This is ex-
pected due to the large number of labels and the
small size of data available for each subcategory.
We expect that as we collect more data the perfor-
mance of the classifiers for this task will improve.
In the demo version, Read-X uses only the Max-
Ent classifier to assign thematic labels and reports
results for the super categories and basic cate-
gories, which have been tested and shown to be
reliable.
3 Predicting difficult words given
reader’s background
The analysis of reading difficulty based on stan-
dard readability formulas gives a quick and easy
way to measure reading difficulty but these formu-
las lack sophistication and sensitivity to the abili-
ties and background of readers. They are reason-
ably good at making rough distinctions between
-standardly defined- middle, high-school or col-
lege levels but they fall short in predicting reading
ease or difficulty for specific readers. For exam-
ple, a reader who is familiar with literary texts will
have less difficulty reading new literary text than
a reader, with a similar educational background,
who has never read any literary works. In this
section, we discuss the first step we have taken
towards making more reliable evaluations of text
readability given the profile of the reader.
Readers who are familiar with specific thematic
areas, are more likely to know vocabulary that is
recurring in these areas. So, if we have vocab-
ulary frequency counts per thematic area, we are
in a better position to predict difficult words for
specific readers given their reading profiles. Vo-
cabulary frequency lists are often used by test de-
velopers as an indicator of text difficulty, based on
the assumption that less frequent words are more
likely to be unknown. However, these lists are
built from a variety of themes and cannot be cus-
tomized for the reader. We have computed vocab-
ulary frequencies for all the basic thematic cate-
gories in our corpus. The top 10 most frequent
words per supercategory are shown in Table (3).
51
Arts Career and Business Literature Philosophy Science Social Studies Sports, Health Technology
Word Freq Word Freq Word Freq Word Freq t Word Freq Word Freq Word Freq Word Freq
musical 166 product 257 seemed 1398 argument 174 trees 831 behavior 258 players 508 software 584
leonardo 166 income 205 myself 1257 knowledge 158 bacteria 641 states 247 league 443 computer 432
instrument 155 market 194 friend 1255 augustine 148 used 560 psychoanalytic 222 player 435 site 333
horn 149 price 182 looked 1231 belief 141 growth 486 social 198 soccer 396 video 308
banjo 128 cash 178 things 1153 memory 130 acid 476 clemency 167 football 359 games 303
american 122 analysis 171 caesar 1059 truth 130 years 472 psychology 157 games 320 used 220
used 119 resources 165 going 1051 logic129 alfalfa 386 psychotherapy 147 teams 292 systems 200
nature 111 positioning 164 having 1050 things 125 crop 368 united 132 national 273 programming174
artist 104 used 153 asked 1023 existence 115 species 341 society 131 years 263 using 172
wright 98 sales 151 indeed 995 informal 113 acre 332 court 113 season 224 engineering 170
Table 3: 10 top most frequent words per thematic category.
Vocabulary frequencies per grade level have also
been computed but they are not shown here.
We have added a special component to the
Read-X architecture, which is designed to pre-
dict unknown vocabulary given the reader’s ed-
ucational background or familiarity with one (or
more) of the basic themes. The interface al-
lows you to select a web search result for further
analysis. The user can customize vocabulary dif-
ficulty predictions by selecting the desired grade
or theme. Then, the text is analyzed and, in a
few seconds, it returns the results of the analysis.
The vocabulary evaluator checks the vocabulary
frequency of the words in the text and highlights
the words that do not rank high in the vocabulary
frequency index for the chosen categories (grade
or theme). The highlighted words are clickable.
When they are clicked, the entry information from
WordNet appears on the right panel. The system
has not been evaluated yet so some tuning will
be required to determine the optimal cut-off fre-
quency point for highlighting words.
4 Future work
A major obstacle in developing better readability
models is the lack of reliable ‘groundtruth’ data.
Annotated data are very scarce but even such data
are only partially useful as it is not known if inter-
annotator agreement for readability levels would
be high. To address this issue we are currently
running a battery of self-paced reading and eye-
tracking experiments a) to evaluate which, if any,
readability formulas accurately predict differences
in reading times b)to test new hypotheses about
possible factors affecting the perceived difficulty
of a text, including vocabulary familiarity, propo-
sitional density and discourse coherence.
Acknowledgments
Audrey Troutt developed the software for Read-
X under a GAPSA Provost’s Award for Interdisci-
plinary Innovation, University of Pennsylvania.
References
Jonathan Anderson. 1983. Lix and rix: Variations of a little-
known readability index. Journal of Reading, 26(6):490–
496.
Regina Barzilay and Mirella Lapata. 2008. Modeling lo-
cal coherence: An entity-based approach. Computational
Linguistics.
M. Bruss, M. J. Albers, and D. S. McNamara. 2004. Changes
in scientific articles over two hundred years: A coh-metrix
analysis. In Proceedings of the 22nd Annual International
Conference on Design of Communication: the Engineer-
ing of Quality Documentation, pages 104–109. New York:
ACM Press.
M Coleman and T. Liau. 1975. A computer readability for-
mula designed for machine scoring. Journal of Applied
Psychology, 60:283–284.
K. Collins-Thompson and J. Callan. 2004. Information re-
trieval for language tutoring: An overview of the REAP
project. In Proceedings of the Twenty Seventh Annual In-
ternational ACM SIGIR Conference on Research and De-
velopment in Information Retrieval (poster descritpion.
William DuBay. 2007. Smart Language: Readers, Read-
ability, and the Grading of Text. BookSurge Publishing.
overview of readability formulas and references.
M. Heilman, K. Collins-Thompson, J. Callan, and M. Eske-
nazi. 2007. Combining lexical and grammatical features
to improve readability measures for first and second lan-
guage texts. In Proceedings of the Human Language Tech-
nology Conference. Rochester, NY.
Eleni Miltsakaki and Karen Kukich. 2004. Evaluation of text
coherence for electronic essay scoring systems. Natural
Language Engineering, 10(1).
Sarah Petersen and Mari Ostendorf. 2006. Assessing the
reading level of web pages. In Proceedings of Interspeech
2006 (poster), pages 833–836.
Emily Pitler and Ani Nenkova. 2008. Revisiting readabil-
ity: A unified framework for predicting text quality. In
Proceedings of EMNLP, 2008.
Sarah E. Schwarm and Mari Ostendorf. 2005. Reading level
assessment using support vector machines and statistical
language models. In ACL ’05: Proceedings of the 43rd
Annual Meeting on Association for Computational Lin-
guistics, pages 523–530.
52