Tài liệu Báo cáo Y học: Solution structure of the mEGF/TGFa44250 chimeric growth factor doc
Bạn đang xem bản rút gọn của tài liệu. Xem và tải ngay bản đầy đủ của tài liệu tại đây (387.6 KB, 9 trang )
Solution structure of the mEGF/TGFa
44250
chimeric growth factor
Stephen G. Chamberlin
1,
*, Lorraine Brennan
2,
†, Sarah M. Puddicombe
1
, Donna E. Davies
1
and
David L. Turner
2
1
Cancer Research Campaign Medical Oncology Unit, Southampton General Hospital, Southampton, UK;
2
Department of Chemistry,
University of Southampton, Highfield, Southampton, UK
The solution structure of the growth factor chimera mEGF/
TGFa
44250
has been determined using an extended version
of the
DYANA procedure for calculating structures from
NMR data. The backbone fold and preferred orientation of
the domains of the chimera are similar to those found in
previous studies of EGF structures, and several H-bonds
used as input constraints in those studies were found
independently in the chimera. This shows that the modified
activity of the chimera does not result from a major
structural change. However, the improved precision of the
structure presented here allows the origin of some unusual
chemical shifts found in all of these compounds to be
explained, as well as the results obtained from some site-
specific mutants. Further studies of the properties of this
chimeric growth factor should help to elucidate the
mechanism(s) of hetero- and homodimerization of the
c-erbB receptors.
Keywords: NMR; EGF structure; growth factor;
INDYANA;
simulated annealing.
Epidermal growth factor (EGF) [1,2] and transforming
growth factor alpha (TGFa) [3] are members of a family that
also includes heparin-binding EGF-like growth factor [4],
amphiregulin [5], betacellulin [6], epiregulin [7] and the
heregulins [8,9]. These growth factors play important roles
in cell growth and differentiation [10] through their
interaction with members of the c-erbB family of receptor
tyrosine kinases [11]. They are characterized by a three-
looped EGF motif imposed by three highly conserved
intramolecular disulfide bonds, as well as by the presence of
a number of other conserved residues that have been shown
to be required for biological activity [12,13]. EGF and
TGFa both show marked specificity for the EGF receptor
(EGFR, c-erbB1) with binding resulting in receptor
dimerization, activation of the intrinsic receptor tyrosine
kinase, and initiation of intracellular signal transduction
[14]. Although the EGFR is the primary site of ligand
contact, recent studies have shown that the receptor dimers
that form as a consequence of this interaction can be either
EGFR/EGFR homodimers or EGFR/c-erbB
(2,3 or 4)
hetero-
dimers [15,16]. As a result, most structure –activity studies
with EGF and TGFa have failed to address the relative
contribution of specific residues to the homodimerization or
heterodimerization processes. This omission has been
highlighted in recent studies using mEGF/TGFa
44250
,a
49-amino-acid residue growth factor chimera in which
residues 1–42 correspond to the sequence of murine EGF
(mEGF 1–42) and residues 43–49 correspond to the
C-terminal tail of human TGFa (hTGFa 44–50); this
chimera was previously shown to be a superagonist when
compared to EGF in mitogenesis assays using NR6/HER
fibroblasts even though its relative receptor binding affinity
was 1/100th that of EGF [17]. Detailed receptor binding
studies confirmed that the chimera binds only weakly to the
majority of cell surface EGFRs. However, a subset of sites
can be detected for which the chimera retains an affinity
similar to that of EGF. As these high affinity sites appear to
be due to the formation of heterodimeric EGFR/c-erbB
complexes [18,19], it seems likely that there are different
ligand requirements for the formation of EGFR homodimers
and heterodimers.
In order to interpret the mechanism(s) underlying the
altered receptor binding properties of mEGF/TGFa
44250
fully, it is essential to establish whether the conformation of
the chimera differs from that of EGF. Several growth factors
have been studied by NMR previously, because these
compounds are not amenable to crystallization [20– 29];
they form looped structures stabilized by three disulfide
bridges, with a pronounced antiparallel beta sheet formed in
the longest loop. These characteristics present a challenge
for solution structure determination, and the relative
orientation of the N- and C-terminal regions is particularly
difficult to define. The
1
H NMR spectrum of the chimera
appears to be broadly similar to those published for EGF,
including a broad line of single-proton intensity at about
0.5 p.p.m., hence the conformation is likely to be similar.
However, chemical shift calculations based on published
structures do not agree well with observed values. A
preliminary solution structure of the chimera [30] confirmed
the similarity to native forms but left open the question of
the precise details of the structure that give rise to the
characteristic patterns of chemical shifts. Therefore, the
spectra were re-examined and a much larger number of
constraints was used to determine a refined structure, which
is presented here.
Artificial hydrogen-bond constraints are often used to
*Present address: Department of Chemistry, Leigh Hall, University of
Florida, Gainesville, FL, USA.
†Present address: Department of Biochemistry, University College
Dublin, Belfield, Dublin 4, Ireland.
Correspondence to D. L. Turner, Department of Chemistry,
University of Southampton, Highfield, Southampton SO17 1BJ, UK.
Fax: 1 44 023 80593781, Tel.: 1 44 0 23 80593330,
E-mail:
(Received 13 July 2001, revised September 2001, accepted
5 October 2001)
Abbreviations: EGF, epidermal growth factor; TGFa, transforming
growth factor alpha; upv, upper limit volumes; lov, lower limit volumes.
Eur. J. Biochem. 268, 6247–6255 (2001) q FEBS 2001
define secondary structural elements. However, indirect
experimental evidence of the existence of H-bonds such as
exchange rates and temperature dependence of amide proton
chemical shifts presents difficulties because the H-bonds do
not necessarily exist simultaneously in a dynamic structure
and the acceptor may not be unique [31]. Predefined
H-bonds were not used in this study, so that the quality of the
structure can be tested in relation to exchange rate data.
Interproton distances derived from NOEs may also be
impossible to fit to a single set of coordinates if the molecule
is conformationally heterogeneous, but a more serious
problem arises in the process of selecting NOEs and
converting their intensities to distances, as this often
involves a degree of subjectivity. Therefore, we have
calculated structures using interproton constraints that are
derived directly from NOE volumes, with experimental
errors used to estimate both upper and lower bounds. This
procedure has been applied successfully to rotating frame
NOE (ROESY) data [32,33] as well as to NOESY data
[34–37], and is implemented here in an extended version of
the program
DYANA [38], referred to as INDYANA (intensity-
DYANA) [36], in which the conversion from the measured
NOE intensities to distances is fully automatic. The use of
minimum-distance constraints yields a large increase in the
amount of experimental information because upper limits
for NOE intensities may be obtained even in the presence
of degenerate chemical shifts or overlapping cross peaks.
Furthermore, consistency with experimental data is
improved because structures based on upper-limit distances
alone allow protons to come into van der Waals contact with
each other even if the experimental spectra show clearly that
there is no NOE between them.
MATERIALS AND METHODS
Growth factor production
The chimera, mEGF/TGFa
44250
, and wild-type mEGF were
produced in Pischia pastoris using the pPIC9 vector from
Invitrogen BV, Leek, the Netherlands. Following growth to
mid-log phase in buffered minimal medium containing 1%
(v/v) glycerol as a noninducible carbon source, cells were
concentrated 10-fold before induction by daily addition of
0.5% (v/v) methanol for 3 days. After purification and
characterization as previously described [17], this protocol
yielded 38 mg of growth factor per litre of medium.
NMR Experiments
A3m
M solution in 90%H
2
O/10%
2
H
2
O at pH 3 was used
for the NMR experiments. Spectra were recorded on a
Varian VXR500 spectrometer operating at 499.84 MHz. A
NOESY spectrum [39] was recorded with a 100-ms mixing
time at 20 8C, with 4096 points and a spectral width of
7 kHz for each transient, and 1024 increments with TPPI
[40] to give a spectral width of 14 kHz in the second
dimension. A TOCSY spectrum [41] with 60 ms of spin lock
and a DQF-COSY spectrum were recorded under the same
conditions.
Determination of volume constraints
Each NOESY cross peak, or cluster of overlapping peaks,
was integrated using the program
XEASY [42] together with
areas of baseline either side of the peak in the F
1
dimension
to correct any offset. Additional volumes were measured at
positions predicted on the basis of preliminary calculated
structures, even if there was no visible cross peak. The upper
limit volumes (upv ) and lower limit volumes (lov ) were
estimated as described previously [36], with a minimum
uncertainty defined as three times the standard deviation of
all of the baseline integrals, which is roughly equivalent to
the intensity of the smallest recognizable peaks. Several of
the weakest peaks yielded a negative lov that gave no
meaningful upper distance limit. The lov was also discarded
if the cross peak comprised contributions from degenerate
protons; this is less restrictive than the ‘sum’ function in
X-PLOR [43], but it involves no additional complexity in
computation.
Constraints involving resolved prochiral protons are
handled by
INDYANA in a manner similar to the original
DYANA program in the absence of a stereospecific assign-
ment, except that the fixed distances between the protons
and pseudoatoms are included in the target function
calculation together with the converted volume. Degenerate
methylene or isopropyl proton signals are treated similarly,
but the single available upv applies to both, and the lov, used
as a basis for a fixed distance offset, is set to one half of the
measured lov. Aromatic protons, such as Tyr Hd and H1, are
a special case because, although rapid ring flips usually
render the protons equivalent, the fixed distance between
them is large enough for many NOEs to be assigned to one
or other side of the ring. Each NOE may be ‘pseudo-
stereospecifically assigned’ individually [44,45], which is
achieved by having two sets of proton labels for each ring;
one set that is treated by the program as stereo pairs and
another that is recognized as unique. This procedure
provides direct information about ring orientations, which is
not possible if constraints are applied to pseudoatoms on the
C
2
axis of a ring. This is in accordance with the observation
that aromatic groups are usually well defined in crystal
structures even when NMR shows that they undergo rapid
1808 flips.
Automatic distance calibration
A relation of the form r ¼ k/
n
p
V was used to convert NOE
volumes into interproton distances. Different scaling
factors, k, were used for different classes of proton: NOEs
between methyl groups, a methyl and a single proton, or two
single protons were treated separately. A fourth scaling
factor was used for NOEs between amide protons and other
single protons. This involves a fundamental change to the
DYANA program as the conversion from volumes to distances
occurs at the level of target function evaluation. The scaling
factors are ‘non-Cartesian’ parameters of the fit that are
optimized simultaneously with torsion angles, either by
conjugate gradient minimization, or by simulated annealing.
These additional variables can be thought of as nongeo-
metric dimensions and they are assigned a weight, analo-
gous to mass, to scale their rate of change for the Newtonian
dynamics. In practice, the reduction in computational
speed caused by the additional parameters is offset by an
improvement in convergence that appears to result from
the implicit flexibility of the distance constraints. As each
calculated structure is defined by its own set of scaling
factors in addition to the set of torsion angles that defines its
6248 S. G. Chamberlin et al.(Eur. J. Biochem. 268) q FEBS 2001
geometry, the set of solutions reflects any uncertainty in the
calibration as well as alternative fits to the set of distances.
The main advantages of the procedure are simple: the details
of the calibration are precisely and unambiguously defined,
it is fully automatic, and the family of calculated structures
cannot be biased by predetermined calibration constants.
Allowance for spin diffusion
The monotonic relationship between NOE intensity and
interproton distance may be spoiled by local variations in
correlation time, fluctuations in conformation (including
aromatic ring flips), or by spin diffusion through networks of
closely spaced protons [46]. These complications are
interrelated, but the NOEs expected for a given structure
can be calculated approximately from the exponential of the
matrix of theoretical cross relaxation rates. These values
may be replaced by scaled experimental values and the
logarithm of the matrix may be taken to obtain distances that
take account of spin diffusion [47,48]. Typically, however,
such calculations generate some nonphysical negative cross
relaxation rates as a consequence of the failure of the
approximation of a rigid molecule and because of
inaccuracies in the starting structure. Although mathemat-
ical convergence may be achieved by iterative calculations,
the accuracy of the distances obtained remains uncertain.
Therefore, we use relaxation matrix calculations simply to
estimate the errors that might be induced by spin diffusion
and then soften all distance constraints accordingly. In
effect, this allows for the uncertainty in converting NOE
volumes into distances that remains despite having
optimized the calibration curve.
The relaxation matrix calculations use the average inverse
sixth power of interproton distances from an ensemble of
structures and a single correlation time, optimized to fit the
set of measured NOEs, with fast methyl group rotation and
rapid rings flips taken into account [49–51]. The calculated
values were replaced by scaled NOE intensities and the rmsd
of the ratio between the distances found after back trans-
formation and the maximum or minimum distances obtained
by automatic calibration in
INDYANA was then used to set a
parameter for loosening distance constraints to ensure that
the scaling factors, that include the variable effects of spin
diffusion, do not result in excessively tight constraints.
Torsion angle constraints
Scalar couplings between NH and CaH protons (
3
J
HNHa
)
were measured from one-dimensional spectra and the
DQF-COSY spectrum and converted into constraints for the
backbone torsion angle, f,usingtheprogram
HABAS
together with preliminary structures [52].
Structure calculation
Disulfide bridges were built by modification of the standard
cysteine residue in the
DYANA library [53]. A pseudoatom
was included instead of the HG atom and a bridge was
formed by superimposition of the pseudoatoms on the SG
atoms of the other Cys residue, with an upper distance limit
of 0.01 nm and a weight 10 times that of other constraints.
Covalent links declared in the sequence file cause the
DYANA
program to ignore van der Waals repulsion across the bridge.
A flexible proline residue was built in a similar fashion by
modification of the standard Pro residue, in which the ring is
held flat. The CB–CG bond was removed and the ring
closed by superimposition of three pseudoatoms with
coordinates identical to CG, CD, QG with five new torsion
angles. The contribution of these fixed upper limits to the
target function was defined as
DYANA type 2 [53] to avoid
excessive weighting caused by the short distances; all other
constraints were of the standard type 1. It is worth noting
that the modified program also accepts fixed distances for
interproton constraints and will therefore operate in the
same manner as
DYANA if volume constraints are not used.
Stereospecific and pseudo-stereospecific assignments were
made with respect to preliminary calculated structures using
the program
GLOMSA [52], modified to accept both upper
and lower volume constraints.
Structures were calculated from random starting points,
following the standard annealing protocol defined in the
program
DYANA.
Structure evaluation
Cross validation of experimental constraints by random
exclusion of subsets is an effective technique for evaluating
structures, and a similar insight is provided by testing
structures against alternative sources of information.
Ramachandran plots are used widely, which is appropriate
if the steric repulsions used in the structure calculation are
soft, as in the quadratic term used in
DYANA, rather than a
force field that effectively constrains the structure to the
most favoured backbone torsion angles. Predicted H-bonds
in structures may also be compared with experimental
evidence for the involvement of amide protons in H-bonds,
but only if there were no such constraints used in the
structure calculation. The detailed quality of agreement
between the structure and the input constraints is also an
important indication of consistency with experimental data
if, as with the measurement of additional maximum NOE
volumes used here, the comparison is made with the
complete set of volumes and not merely with those which
are measured in the first instance. Constraint violations were
examined using the program
DYANA. Superposition of the
family of structures, calculation of the rmsd of atomic
coordinates, and preparation of diagrams used
MOLMOL
[54]. Ramachandran plots were obtained using PRO-
CHECK
-NMR [55], and the optimal pattern of H-bonds was
calculated using
WHAT IF [56]. Finally, chemical shifts were
calculated using the program
TOTAL [57].
RESULTS AND DISCUSSION
Assignment
The complete sequence specific assignment of the chimera
was carried out by identification of the spin systems using
TOCSY and COSY experiments followed by the use of
sequential CaH-NH NOEs [58]. The sequential assignment
was interrupted by the presence of two proline residues, in
which cases the following NOEs were observed: Ha/Hb of
the previous residue to the Pro H* and NH of the following
residue to the Pro Ha/Hb. The assignments have been
deposited at the BioMagResBank, with accession number
5120. The chemical shifts are consistent with the
1
H
q FEBS 2001 Solution structure of mEGF/TGFa44–50 (Eur. J. Biochem. 268) 6249
assignments reported for wild-type mEGF at pH 3.1 [20,21],
pH 2.0 [22] and pH 6.8 [23] at 28 C.
Structure calculations
From 1174 assigned and integrated cross peaks input into
INDYANA, 561 lower and 793 upper volume constraints were
obtained. After adjustment for missing stereospecific
assignments and elimination of redundant constraints, this
yielded 955 lower and 1127 upper volume constraints, an
average of 42.5 constraints per amino acid (19.5 lower
volume limits and 23.0 upper volume limits), which is
summarized in Fig. 1 and Table 1. In addition, 28
constraints for backbone torsion angles were obtained
from
3
J
HNHa
coupling constants. Structures were calculated
using the standard
DYANA protocol for simulated annealing
with torsion angle dynamics, with four additional dynamic
variables for the conversion of volumes to distances.
Preliminary structures were checked for possible stereo-
specific assignments and also for unconstrained short
interproton distances. The volumes at the positions of the
cross peaks predicted for short distances were measured
where possible. Out of 59 nondegenerate methylene and
isopropyl groups, 44% were stereospecifically assigned, and
pseudo-stereospecific assignments were made for 43% of
the NOEs to fast flipping aromatic rings. Relaxation matrix
calculations with preliminary structures gave corrected
distances that violated the constraints obtained from
INDYANA with an rmsd of 5.4%, hence, all converted
distances were softened by 6% in the final calculations. The
function r ¼ k/
4
p
V was used for converting volumes to
distances was chosen after comparing results for r
24
and
r
26
. The family of 10 structures with the lowest target
functions obtained from 50 random starting structures was
chosen to represent the chimera in solution, and is shown in
Fig. 2. The atomic coordinates and constraints have been
deposited at the RCSB Protein Data Bank, with accession
code 1gk5.
Structure evaluation
The global rmsd per residue for backbone and heavy atoms
with respect to the mean of the family of structures is plotted
in Fig. 1. Backbone torsion angles were analysed using
Ramachandran plots, excluding Gly, Pro, and terminal resi-
dues, and the results are summarized in Table 2. Hydrogen
bonds were identified using the program
WHAT IF with
default parameters [56]. A total of 14 H-bonds between
backbone atoms were detected in 50% or more of the
structures. These include all of the amide protons found by
Montelione et al. to have exchange rates lower than
2.5 Â 10
24
:
min
21
[20], with the exception of Val34 NH, for
which no H-bond was found, and Leu15 NH, that formed
H-bonds to Arg41 CO in four out of the 10 structures. In
addition, a bifurcated H-bond was found involving Asp27
and Ser28 NH with Ile23 CO. An H-bond was also found
between Asp46 NH and Gly36 CO in all structures.
Significant H-bonds were found for amide protons in
sidechains: in particular, bonding of Asn16 NdH to Cys42
CO, and Arg41 N1H to Tyr13 CO appeared in all 10
structures, and Arg41 NhH was bonded to Gly12 CO in
eight out of 10 structures. The H-bonds were not used as
constraints in the calculation, but these structures predict
that the sidechain hydrogen bonds, together with Leu15 NH
– Arg41 CO, stabilize the relative orientation of the
C-terminal loop. This would explain the dramatic changes in
structure and activity caused by mutating residue 41 [28].
The calculated structures also explain the large secondary
structural shifts of Asn16 bCH
2
and Arg41 gCH
2
, which
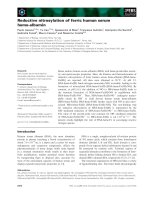
Fig. 1. NMR Data. Top: the number of meaningful NOE-derived
constraints for each residue used in the calculations. White represents
intraresidual constraints (Di ¼ 0), light grey sequential (Di ¼ 1), grey
and black represent medium (Di , 5) and long-range (Di $ 5)
constraints. Both lower and upper volume limits are included. Bottom:
average rmsd (A
˚
) for the backbone (A) and heavy atoms (B) with
respect to the mean structure. The superimposition was performed for
residues 5–47.
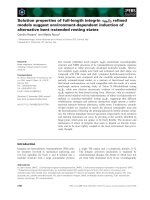
Fig. 2. Stereo view of the of the 10 best chimera structures,
superimposed using the backbones of residues 5–47.
6250 S. G. Chamberlin et al.(Eur. J. Biochem. 268) q FEBS 2001
imply relatively rigid sidechain conformations as well as the
proximity of a strongly anisotropic or charged group. In fact
both residues are close to aromatic groups, Tyr37 and Tyr13,
respectively, as illustrated in Fig. 3. Smaller deviations in
chemical shift are found for the Pro7 dCH
2
protons, at 3.4
and 2.7 p.p.m., that do not agree well with calculations
based on the structure, 3.9 (0.3) and 3.9 (0.4) p.p.m.,
although they are within three standard deviations (given in
parenthesis). In this case, the standard deviation is large
because aromatic ring of Tyr29 is the main contributor to the
shifts of Pro7, and its orientation is not well defined. The
observed and calculated shifts, excluding amide protons, are
compared in Fig. 4.
Comparison with mEGF structures
Two different groups have deposited solution structures of
murine EGF at low pH in the RCSB Protein Data Bank
(), 3egf [21] and 1eph [23] being the
most recent. The family of structures in 3egf was computed
using 644 distance constraints, 32 dihedral angle constraints
and constraints for nine hydrogen bonds. Those of 1eph
were computed using 355 distance constraints, 24 torsion
angle constraints and constraints for eight hydrogen bonds.
Unsurprisingly,
PROCHECK-NMR [55] reports a higher
effective resolution for the 3egf family than for 1eph, and
the resolution of the chimeric structure presented here is
similar to that of 3egf, despite the absence of H-bond
constraints. Although this is a measure of precision rather
than accuracy, it correlates with the comparison of observed
and calculated shifts shown in Fig. 4. The standard
deviations of the calculations are 0.36 p.p.m. for 1eph,
0.32 p.p.m. for 3egf, and 0.30 p.p.m. for the chimera,
averaged over the 10 best structures in each case.
Two structures from 3egf and 1eph, the first from each
family, superimpose with a backbone rmsd of 0.53 nm for
residues 1–53, which is uninformative. The mEGF structure
has been presented previously as two structural domains,
the N-terminal domain (residues Asn 1–Cys33) and the
C-terminal domain (residues Asn 32–Leu 47). The last few
residues form a poorly defined tail. The b sheet of the
N-terminal domain for 10 EGF and EGF-like structures
determined by solution NMR methods have been super-
imposed by Tejero et al. [24]. These 10 structures exhibited
a wide range of relative orientations of the two subdomains.
It has also been concluded from
1
H linewidth studies,
15
N
and
13
C relaxation rates, and molecular dynamics
simulations that multiple orientations of the two subdomains
may be in dynamic equilibrium in any one molecule
[21,25–27]. Therefore, rmsd values have been presented
separately for the entire molecule (residues 1–50), the entire
molecule minus the C-terminal tail (residues 1–47), the
N-terminal subdomain (residues 1–33), the C-terminal
subdomain (residues 32–47) and the core (residues 2–6,
18–23, 26– 38 and 42 –45). Superimposition of the
backbones of 3egf and 1eph gave an rmsd of 0.169 nm
for residues 6–33 and 0.165 nm for residues 32–47. The
overall best structure from the chimera family was
superimposed with a structure from each of the previously
reported families of structures for mEGF; the results are
given in Table 3. The difference between the backbone of
the chimera and the EGF structure is no greater than that
found for all the EGF structures, leading to the conclusion
that the increased activity of the chimera is not as a result of
a structural change.
Significantly, a bond between the NH of residue 15 and
the carbonyl of residues 41 was identified in more than 40%
of the structures in the family of the chimera (Table 4). This
NH was reported to exchange slowly in hEGF (human EGF)
and mEGF [20,29] and the formation of a Leu15 NH–Arg41
O-H-bond in calculations using a force field effectively
defines the relative orientation of the N- and C-terminal
domains [29]. As H-bond constraints were not used in the
calculation of the chimera structure, this provides strong
evidence that the overall structure is unchanged by the
modification of the sequence.
Given that the solution structure of mEGF/TGFa
44250
was found to be similar to that of other EGF structures, it is
unlikely that the low affinity of the chimera for binding
to the majority of cell surface EGFRs [18] results from
gross structural changes in the unbound growth factor. The
importance of the ligand C-tail for EGFR binding was
demonstrated in mutagenesis studies on the conserved
Table 1. Summary of relevant constraints used for calculating the
structure of the chimera. The number of individual NOEs, before
adjustment for nonstereospecifically assigned protons, is given in
parenthesis. Note that the lower limit of the NOE volume determines the
upper distance limit (upl ) and the upper volume determines the lower
distance (lol ).
Constraint type
Lower
volume
(upl )
Upper
volume
(lol )
Intraresidue (Di ¼ 0) 355 (222) 310 (236)
Sequential (Di ¼ 1) 215 (140) 254 (192)
Medium-range (2 # Di # 4) 153 (82) 206 (134)
Long-range (5 # Di) 232 (117) 357 (231)
Total per residue 19.5 (11.4) 23.0 (16.2)
Torsion angles 28
Table 2. Statistics for the family of 10 chimera structures. Note that
violations are calculated after conversion of NOE volumes into distance
limits, i.e. from lov to upl and from upv to lol.
Target function range 0.47–0.77 A
˚
2
(62%)
Scaling factors (standard deviation)
Proton–proton 89.3 (0.3)
Amide proton–proton 97.0 (0.3)
Proton–methyl 106.0 (0.5)
Methyl–methyl 122.5 (3.0)
Backbone rmsd (6–47 N, Ca, CO) 0.47 A
˚
Heavy atom rmsd 0.81 A
˚
Average sum (maximum) of upl violations 3.4 (0.17) A
˚
Average sum (maximum) of lol violations 2.8 (0.26) A
˚
Average maximum van der Waals violation 0.09 A
˚
Consistent violations . 0.2 A
˚
0
Residues in Ramachandran regions (%)
Most favoured 62.1
Allowed 35.1
Generously allowed 2.8
Disallowed 0.0
q FEBS 2001 Solution structure of mEGF/TGFa44–50 (Eur. J. Biochem. 268) 6251
leucine residue in both EGF (L47) [59] and TGFa (L48)
[60] and has been confirmed using transferred NOE
enhancement data for titration of TGFa with the EGFR
[61]. As the conserved leucine residue was not changed in
the chimera, this suggests that nonconserved residues in the
C-tail of the growth factor also make important contri-
butions to receptor binding and that these are context
dependent, i.e. the altered environment of the TGFa C-tail
relative to the main murine EGF structural motif may
disrupt interactions required to stabilize the receptor bound
form of the ligand. Consistent with this proposal is the report
that the C-tail, which is very flexible in the nonbound state
and poorly defined by NMR, has restricted mobility upon
receptor binding [62]. Interestingly, the secondary structural
shifts of the bridging sidechains, Asn16 and Arg41, are
larger in the chimera than in EGF, suggesting that the C-loop
of the unbound chimera has reduced mobility with respect to
the rest of the structure. Further studies of the receptor
bound forms of the chimera and other related ligands will be
necessary to define the nature of the interactions leading to
receptor recognition and dimerization.
CONCLUSIONS
Because of the limited supply of the chimeric growth factor,
the protein concentration used in this work was about one
half of that used in determining the structures 1eph and 3egf
[21,23]. Apart from that, the instrumentation and experi-
mental methods were similar. The difference in approach
lies in the methodology for structure calculation: hydrogen
bond constraints were not used in this work and NOE
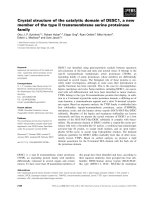
Fig. 3. Ribbon diagram of the secondary structure in residues 5–47
of the overall best structure of the chimera. The three disulfide
bridges are also shown, together with the sidechains of Asn16 and
Arg41, which form H-bonds to backbone CO groups. The stability of
these bonds is implied by large secondary structural shifts of the bCH
2
protons, shown as spheres, which are generated by the rings of Tyr13
and Tyr37.
Table 3. Rmsd (A
˚
) for superposition of backbone atoms in the
structures 1eph, 3egf, and the chimera. Values above the diagonal are
for residues 6 –33 and those below for 32–47.
1eph 3egf Chimera
1eph – 1.69 2.01
3egf 1.65 – 1.69
Chimera 1.28 1.99 –
Fig. 4. Calculated vs. observed secondary structural shifts for
murine EGF (1eph [23] and 3egf [21]) and the EGF/TGFa chimera.
In each case, chemical shifts were calculated using the program
TOTAL
[57] and averaged over the 10 best structures. The limits of the
estimated accuracy of the calculation are indicated by dashed lines.
6252 S. G. Chamberlin et al.(Eur. J. Biochem. 268) q FEBS 2001
volumes (intensities), not precalibrated distances, were used
as input.
This work made use of a simple extension of the
DYANA
procedure [38] for calculating structures from NMR data
that is based firmly on experiment, including error bars, and
minimizes the possibilities for subjective influence. The
protocol ensures that the maximum amount of information is
extracted from the spectra and therefore it is possible to
account for the effects of spin diffusion simply by loosening
constraints, without significant loss of precision. The struc-
tures of the chimera were calculated with no electrostatic
energy terms. Hence, the accuracy of the solutions obtained
here is indicated by the well defined hydrogen bonds found.
Several of these were identified in previous studies of EGF,
and the backbone fold of the chimera is clearly similar to
those of the EGF structures. The presence of a backbone
hydrogen bond from the N- to C- terminal domain, which
was identified in the hEGF structure [29], together with
those of the sidechains, is particularly significant. The
chemical shifts calculated for the chimera clearly support
the sidechain orientations, and the pattern of shifts is similar
to that found in native EGF. This shows that the relative
orientation of the domains is unchanged and the modified
activity of the chimera does not result from any major
structural alteration. The properties of this chimeric growth
factor should therefore help to elucidate the importance
of heterodimerization and homodimerization of the EGF
receptors.
REFERENCES
1. Cohen, S. (1962) Isolation of mouse submaxillary gland protein
accelerating incisor eruption and eyelid opening in the new born
animal. J. Biol. Chem. 237, 1555–1562.
2. Gregory, H. (1975) Isolation and structure of urogastrone and its
relationship to epidermal growth factor. Nature 257, 325–327.
3. DeLarco, J.E., Reynolds, R., Carlberg, K., Engle, C. & Todaro, G.J.
(1980) Sarcoma growth factor from mouse sarcoma virus-
transformed cells. Purification by binding and elution from
epidermal growth factor receptor rich cells. J. Biol. Chem. 255,
3685–3690.
4. Higashiyama, S., Lau, K., Besner, G., Abraham, J.A. & Klagsbrun,
M. (1991) A heparin-binding EGF-like growth factor secreted by
macrophage-like cells is related to EGF. Science 251, 936–939.
5. Shoyab, M., McDonald, V.L., Bradley, J.G. & Todaro, G.J. (1988)
Amphiregulin: a bifunctional growth-modulating glycoprotein
produced by the phorbol 12-myristate 13-acetate-treated human
breast adenocarcinoma cell line MCF-7. Proc. Natl Acad. Sci. USA
85, 6528– 6532.
6. Shing, Y., Christofori, G., Hanahan, D., Ono, Y., Sasada, R.,
Igarashi, K. & Folkman, J. (1993) Betacellulin: a mitogen from
pancreatic b-cell tumors. Science 259, 1604–1607.
7. Toyoda, H., Komurasaki, T., Uchida, D., Takayama, Y., Isobe, T.,
Okuyama, T. & Hanada, K. (1995) Epiregulin. A novel epidermal
growth factor with mitogenic activity for rat primary hepatocytes.
J. Biol. Chem. 270, 7495 –7500.
8. Wen, D., Peles, E., Cupples, R., Suggs, S.V., Bacus, S.S., Luo, Y.,
Trail, G., Hu, S., Silbiger, S.M., Levy, R.B., Koski, R.A., Lu, H.S.
& Yarden, Y. (1992) Neu differentiation factor: a transmembrane
glycoprotein containing an EGF domain and an immunoglobulin
homology unit. Cell 69, 559–572.
9. Marchionni, M.A., Goodearl, A.D.J., Chen, M.S., Bermingham
McDonogh, O., Kirk, C., Hendricks, M., Danehy, F., Misumi, D.,
Sudhalter, J., Kobayashi, K., Wroblewski, D., Lynch, C., Baldassare,
M., Hiles, I., Davis, J.B., Hsuan, J.J., Totty, N.F., Otsu, M.,
McBurney, R.N., Waterfield, M.D., Stroobant, P. & Gwynne, D.
(1993) Glial growth factors are alternatively spliced erbB2 ligands
expressed in the nervous system. Nature 362, 312–318.
10. Carpenter, G. & Wahl, M. (1991) The epidermal growth factor
family. In Peptide Growth Factors and Their Receptors (Sporn,
M.B. &Roberts, A.B., eds), pp. 69–171. Springer-Verlag, New
York.
11. Alroy, I. & Yarden, Y. (1997) The erbB signaling network in
embryogenesis and oncogenesis: signal diversification through
combinatorial ligand–receptor interactions. FEBS Lett. 410,
83–86.
12. Campion, S.R. & Niyogi, S.K. (1994) Interaction of the epidermal
growth factor with its receptor. Prog. Nucleic Acid Res. Mol. Biol.
49, 353– 383.
13. Groenen, L.C., Nice, E.C. & Burgess, A.W. (1994) Structure–
function relationships for the EGF/TGFa family of mitogens.
Growth Factors 11, 235–257.
14. Lemmon, M.A. & Schlessinger, J. (1994) Regulation of signal
transduction and signal diversity by receptor oligomerization.
Trends Biochem. Sci. 19, 459– 463.
15. Beerli, R.R. & Hynes, N.E. (1996) Epidermal growth factor related
peptides activate distinct subsets of ErbB receptors and differ in
their biological activities. J. Biol. Chem. 271, 6071–6076.
16. Tzahar, E., Waterman, H., Chen, X., Levkowitz, G., Karunagaran,
D., Lavi, S., Ratzkin, B.J. & Yarden, Y. (1996) A hierarchical
network of interreceptor interactions determines signal transduction
by neu differentiation factor/neuregulin and epidermal growth
factor. Mol. Cell. Biol. 16, 5276–5287.
17. Puddicombe, S.M., Wood, L., Chamberlin, S.G. & Davies, D.E.
(1996) The interaction of an epidermal growth factor/transforming
growth factor a tail chimera with the human epidermal growth
Table 4. Optimal hydrogen bonds in the family of chimera
structures, found using the program
WHAT-IF [56]. The total score
for the 10 structures is given, which should have a value of 10.0 for a
‘perfect’ hydrogen bond.
Leu15 NH Arg41 O 0.796
Asn16 Nd2 Cys42 O 6.013
Val19 NH Asn32 O 4.177
Met21 NH Thr30 O 3.958
His22 Nd1 Ser28 O 2.625
Ile23 NH Ser28 O 2.262
Leu26 NH Ser25 Og 2.560
Asp27 NH Ile23 O 2.594
Ser28 NH Ile23 O 2.901
Tyr29 NH Ser28 Og 2.939
Thr30 NH Met21 O 3.027
Asn32 NH Val19 O 6.594
Cys33 NH Cys31 O 0.247
Tyr37 NH Val34 O 5.443
Ser38 NH His44 O 3.853
Gly39 NH Ser38 Og 0.377
Gly39 NH His44 O 0.793
Arg41 Nh2 Gly12 O 4.174
Arg41 N1 Tyr13 O 8.107
Arg41 Nh2 Tyr13 O 1.646
Cys42 NH Gly39 O 3.777
Glu43 NH Ser38 O 0.789
Glu43 NH Gly39 O 0.731
Glu43 NH Asp40 O 2.947
His44 NH Ser38 O 1.774
His44 NH Gly39 O 0.557
Ala45 NH Glu43 O 2.645
Asp46 NH Gly36 O 3.909
q FEBS 2001 Solution structure of mEGF/TGFa44–50 (Eur. J. Biochem. 268) 6253
factor receptor reveals unexpected complexities. J. Biol. Chem.
271, 30392–30397.
18. Neelam, B., Richter, A., Chamberlin, S.G., Puddicombe, S.M.,
Wood, L., Murray, M.B., Nandagopal, K. & Davies, D.E. (1998)
Structure–function studies of ligand-induced epidermal growth
factor receptor dimerization. Biochemistry 37, 4884–4891.
19. Chamberlin, S.G. & Davies, D.E. (1998) A unified model of c-erbB
receptor homo- and heterodimerisation. Biochim. Biophys. Acta
1384, 223–232.
20. Montelione, G.T., Wu
¨
thrich,K.&Scheraga,H.A.(1988)
Sequence-specific
1
H NMR assignments and identification of
slowly exchanging amide protons in murine epidermal growth
factor. Biochemistry 27, 2235–2243.
21. Montelione, G.T., Wu
¨
thrich, K., Burgess, A.W., Nice, E.C.,
Wagner, G., Gibson, K.D. & Scheraga, H.A. (1992) Solution
structure of the Murine epidermal growth factor determined by
NMR spectroscopy and refined by energy minimization with
restraints. Biochemistry 31, 236– 249.
22. Kohda, D. & Inagaki, F. (1988) Complete sequence-specific
1
H
Nuclear Magnetic resonance assignments for mouse epidermal
growth factor. J. Biochem. (Tokyo) 103, 554–571.
23. Kohda, D. & Inagaki, F. (1992) Three-dimensional nuclear
magnetic resonance structures of mouse epidermal growth factor
in acidic and physiological pH solutions. Biochemistry 31,
11928–11939.
24. Tejero, R., Bassolinp-Klimas, D., Bruccoleri, R.E. & Montelione,
G. (1996) Simulated annealing with restrained molecular dynamics
using COGEN: Energy refinement of the NMR solution structures
of epidermal and type-a transforming growth factors. Protein Sci.
5, 578– 592.
25. Li, Y.C. & Montelione, G.T. (1995) Human type-a transforming
growth factor undergoes slow conformational exchange between
multiple backbone conformations as characterized by nitrogen-15
relaxation measurements. Biochemistry 34, 2408– 2423.
26. Celda, B., Biamonti, C., Arnau, M.J., Tejero, R. & Montelione,
G.T. (1995) Combined use of
13
C chemical shift and
1
H
a
-
13
C
a
heteronuclear NOE data in monitoring a protein NMR structure
refinement. J. Biomol. NMR 5, 161–172.
27. Fadel, A.R., Jin, D.Q., Montelione, G.T. & Levy, R.M. (1995)
Crankshaft motions of the polypeptide backbone in molecular
dynamics simulations of human type-a transforming growth-factor.
J. Biomol. NMR 6, 221 –226.
28. Hommel, U., Dudgeon, T.J., Fallon, A., Edwards, R.M. &
Campbell, I.D. (1991) Structure–function-relationships in human
epidermal growth-factor studied by site-directed mutagenesis and
1
H-NMR. Biochemistry 30, 8891– 8898.
29. Campbell, I.D., Baron, M., Cooke, R.M., Dudgeon, T.J., Fallon, A.,
Harvey, T.S. & Tappin, M.J. (1990) Structure–function relation-
ships in epidermal growth factor (EGF) and transforming growth
factor-alpha (TGFa). Biochem. Pharmacol. 40, 35– 40.
30. Brennan, L. (1998) NMR of peptides and proteins. PhD Thesis,
University of Southampton, UK.
31. Nilges, M. & O’Donoghue, S.I. (1998) Ambiguous NOEs and
automated NOE assignment. Prog. NMR Spectrosc. 32, 107–139.
32. Turner, D.L. (1994) A method for obtaining precise initial structures
from rotating frame nuclear Overhauser enhancements and its
application to Cyclosporin A. J. Magn. Reson. A107, 239–242.
33. Rees, N.H., Penfold, D.J., Rowe, M.E., Chowdhry, B.Z., Cole,
S.C.J., Samuels, R.I. & Turner, D.L. (1996) NMR studies of the
conformation of destruxin A in water and in acetonitrile. Magnetic
Resonance Chem 34, 237–241.
34. Turner, D.L. (1995) The conformation of the monensin A-sodium
complex in solution determined from self-consistent NOE distance
constraints. J. Magn. Reson. B108, 137–142.
35. Messias, A.C., Kastrau, D.H.W., Costa, H.S., LeGall, J., Turner,
D.L., Santos, H. & Xavier, A.V. (1998) Solution structure of
Desulfovibrio vulgaris (Hildenborough) ferrocytochrome c
3
:
Structural basis for functional cooperativity. J. Mol. Biol. 281,
719–739.
36. Brennan, L., Turner, D.L., Messias, A.C., Teodoro, M.L., LeGall,
J., Santos, H. & Xavier, A.V. (2000) Structural basis for the network
of functional cooperativities in cytochrome c
3
from Desulfovibrio
gigas: solution structures of the oxidised and reduced states. J. Mol.
Biol. 298, 61 –82.
37. Brennan, L., Turner, D.L., Fareleira, P. & Santos, H. (2001)
Solution structure of cytochrome c: insights into the structural basis
for ligand detachment. J. Mol. Biol. 308, 353 –365.
38. Gu
¨
ntert, P., Mumenthaler, C. & Wu
¨
thrich, K. (1997) Torsion angle
dynamics for NMR structure calculation with the new program
DYANA. J. Mol. Biol. 273, 283–298.
39. Kumar, A., Wagner, G., Ernst, R.R. & Wu
¨
thrich, K. (1980) A
two-dimensional nuclear Overhauser enhancement (2D NOE)
experiment for the elucidation of complete proton – proton cross
relaxation networks in biological macromolecules. Biochem.
Biophys. Res. Commun. 95, 1–6.
40. Marion, D. & Wu
¨
thrich, K. (1983) Application of phase sensitive
two-dimensional correlated spectroscopy (COSY) for measure-
ments of
1
H-
1
H spin coupling constants in proteins. Biochem.
Biophys. Res. Commun. 113, 967–974.
41. Braunschweiler, L. & Ernst, R.R. (1983) Coherence transfer by
isotropic mixing: application of proton correlation spectroscopy.
J. Magn. Reson. 53, 521 –528.
42. Bartels, C., Xia, T.H., Billeter, M., Gu
¨
ntert, P. & Wu
¨
thrich, K. (1995)
The program XEASY for computer-supported NMR spectral-
analysis of biological macromolecules. J. Biomol. NMR 6,1–10.
43. Bru
¨
nger, A.T. (1992) X-PLOR. A System for X-Ray Crystal-
lography and NMR. Yale University Press, New Haven, CT, USA.
44. Wareham, R.S., Kilburn, J.D., Rees, N.H., Turner, D.L., Leach,
A.R. & Holmes, D.S. (1995) Synthesis and solution conformation
of a C
2
symmetric macrobicycle. Tetrahedron Lett. 36, 3047– 3050.
45. Wareham, R.S., Kilburn, J.D., Turner, D.L., Rees, N.H. & Holmes,
D.S. (1995) Homeomorphic isomerism in a peptidic macrobicycle.
Angewandte Chemie Int. 34, 2660–2662.
46. Kalk, A. & Berendsen, H.J.C. (1976) Proton magnetic relaxation
and spin diffusion in proteins. J. Magn. Reson. 24, 343 –366.
47. Boelens, R., Koning, T.M.G. & Kaptein, R. (1988) Determination
of biomolecular structures from proton-proton NOEs using a
relaxation matrix approach. J. Mol. Struc. 173, 299 –311.
48. Boelens, R., Koning, T.M.G., van der Marel, G.A., van Boom, J.H.
& Kaptein, R. (1989) Iterative procedure for structure determi-
nation from proton-proton NOEs using a full relaxation matrix
approach. Application to a DNA octamer. J. Magn. Reson. 82,
290–308.
49. Tropp, J. (1980) Dipolar relaxation and nuclear Overhauser effects
in nonrigid molecules: The effect of fluctuating internuclear
distances. J. Chem. Phys. 72, 6035–6043.
50. Olejniczak, E.T. (1989) Including methyl rotation in simulations of
spin-lattice relaxation. J. Magn. Reson. 81, 392–394.
51. Koning, T.M.G., Boelens, R. & Kaptein, R. (1990) Calculation of
the nuclear Overhauser effect and the determination of proton-
proton distances in the presence of internal motions. J. Magn.
Reson. 90, 111–123.
52. Gu
¨
ntert, P., Braun, W. & Wu
¨
thrich, K. (1991) Efficient computation
of 3-dimensional protein structures in solution from nuclear-
magnetic-resonance data using the program DIANA and the
supporting programs CALIBA, HABAS and GLOMSA. J. Mol.
Biol. 217, 517–530.
53. Gu
¨
ntert, P. & Mumenthaler, C. (1997) DYANA User’s Manual,
ETH, Zu
¨
rich, Switzerland.
54. Koradi, R., Billeter, M. & Wu
¨
thrich, K. (1996) MOLMOL: a
program for display and analysis of macromolecular structures.
J. Mol. Graphics. 14, 51–55.
55. Laskowski, R.A., Rullmann, J.A.C., MacArthur, M.W., Kaptein, R.
& Thornton, J.M. (1996) AQUA and PROCHECK-NMR:
6254 S. G. Chamberlin et al.(Eur. J. Biochem. 268) q FEBS 2001
Programs for checking the quality of protein structures solved by
NMR. J. Biomol. NMR 8, 477–486.
56. Hooft, R.W.W., Sander, C. & Vriend, G. (1996) Positioning
hydrogen atoms by optimizing hydrogen-bond networks in protein
structures. Proteins 26, 363–376.
57. Williamson, M.P. & Asakura, T. (1993) Empirical comparisons of
models for chemical-shift calculation in proteins. J. Magn. Reson.
B101, 63–71.
58. Wu
¨
thrich, K. (1986) NMR of Proteins and Nucleic Acids. John
Wiley & Sons, New York, USA.
59. Matsunami, R.K., Yette, M.L., Stevens, A. & Niyogi, S.K. (1991)
Mutational analysis of leucine 47 in human epidermal growth
factor. J. Cell. Biochem. 46, 242–249.
60. Lazar, E., Watanabe, S., Dalton, S. & Sporn, M. (1988)
Transforming growth factor a: mutation of aspartic acid 47 and
leucine 48 results in different biological activities. Mol. Cell Biol.
8, 1247–1252.
61. McInnes, C., Hoyt, D., Harkins, R., Paglia, R.N., Debanne, M.T.,
O’Connor-McCourt, M. & Sykes, B.D. (1996) NMR study of the
transforming growth factor-a (TGF-a) -epidermal growth factor
receptor complex. J. Biol. Chem. 271, 32204–32211.
62. Hoyt, D.W., Harkins, R.N., Debanne, M.T., O’Connor-McCourt,
M. & Sykes, B.D. (1994) Interaction of transforming growth factor
a with the epidermal growth factor receptor: binding kinetics and
differential mobility within the bound TGFa. Biochemistry 33,
15283–15292.
q FEBS 2001 Solution structure of mEGF/TGFa44–50 (Eur. J. Biochem. 268) 6255