Tài liệu Báo cáo Y học: Temperature dependence of thermodynamic properties for DNA/DNA and RNA/DNA duplex formation pdf
Bạn đang xem bản rút gọn của tài liệu. Xem và tải ngay bản đầy đủ của tài liệu tại đây (334.99 KB, 10 trang )
Temperature dependence of thermodynamic properties
for DNA/DNA and RNA/DNA duplex formation
Peng Wu
1,
*, Shu-ichi Nakano
1
and Naoki Sugimoto
1,2
1
High Technology Research Center and
2
Department of Chemistry, Faculty of Science and Engineering, Konan University,
Okamoto, Higashinada–ku, Japan
A clear difference in the enthalpy changes derived from
spectroscopic and calorimetric measurements has recently
been shown. The exact interpretation of this deviation varied
from study to study, but it was generally attributed to the
non-two-state transition and heat capacity change.
Although the temperature-dependent thermodynamics of
the duplex formation was often implied, systemic and
extensive studies have been lacking in universally assigning
the appropriate thermodynamic parameter sets. In the
present study, the 24 DNA/DNA and 41 RNA/DNA
oligonucleotide duplexes, designed to avoid the formation of
hairpin or slipped duplex structures and to limit the base pair
length less than 12 bp, were selected to evaluate the heat
capacity changes and temperature-dependent thermody-
namic properties of duplex formation. Direct comparison
reveals that the temperature-independent thermodynamic
parameters could provide a reasonable approximation only
when the temperature of interest has a small deviation from
the mean melting temperature over the experimental range.
The heat capacity changes depend on the base composition
and sequences and are generally limited in the range of )160
to % )40 calÆmol
)1
ÆK
)1
per base pair. In contrast to the
enthalpy and entropy changes, the free energy change and
melting temperature are relatively insensitive to the heat
capacity change. Finally, the 16 NN-model free energy
parameters and one helix initiation at physiological tem-
perature were extracted from the temperature-dependent
thermodynamic data of the 41 RNA/DNA hybrids.
Keywords: heat capacity change; temperature-dependent
thermodynamics; enthalpy-entropy compensation; the
NN-model parameters.
With the dramatic progress in the human genome project,
many gene sequences are well known but their structure and
function are not yet clearly understood, and therefore,
thermodynamic optimization strategy plays more and more
important role in understanding and predicting the
sequence-dependent higher-ordered structures of nucleic
acids [1–4]. Knowledge of the thermodynamics of nucleic
acids will also be very useful for designing appropriate
screening or scanning experiments for identifying the genetic
markers for diseases [5], sequencing single nucleotide
polymorphisms on a genome-wide scale [6], calculating
hybridization equilibria for purposes of designing the PCR
and rolling-cycle amplification [7,8], selecting optimal con-
ditions for hybridization experiments, and determining the
minimum length of a probe required for the hybridization
and cloning experiments [9,10]. Moreover, the development
of DNA chips for rapidly screening and sequencing
unknown DNAs mainly relies on the ability to predict the
thermodynamic stability of the complexes formed by the
oligonucleotide probes [11,12].
Spectroscopic and calorimetric measurements are two
widely applied methods to determine the thermodynamic
parameters of nucleic acids [13–15]. The UV measurement is
highly sensitive and only small sample units are required for
a full set of measurements on a nucleotide sequence; as a
result, this method has been implemented in many different
ways and applied as a standard way to construct the
thermodynamic database of oligonucleotide sequences [16–
25]. The calorimetric measurement offers the directly
determined thermodynamic parameters of nucleotide
sequences, but this approach requires a substantially larger
sample size for a full set of measurements on a nucleotide
sequence. When the van’t Hoff enthalpy derived from the
UV measurements was directly compared with the calori-
metric enthalpy derived from the calorimetry measure-
ments, it was often found that the two quantities disagreed
with each other and this difference in the two enthalpies
sometimes approached 100% [26–35]. This appears to be a
general problem that has been recently addressed by several
labs, all with slightly different emphases and different
conclusions [26–31,36,37]. The possible interpretation is that
Correspondence to N. Sugimoto, Department of Chemistry,
Faculty of Science and Engineering, Konan University,
Kobe 658-8501, Japan.
Fax: + 81 78 4352539, Tel.: + 81 78 4352497,
E-mail:
Definitions: A, the absorbance of a solution at any temperature; A
helix
,
the linear absorbance as a function of temperature in the pretransition
process; A
coil
, the linear absorbance as a function of temperature in the
post-transition process; T
m
, melting temperature; DC
p
, heat capacity
change; DC
p,H
, the heat capacity change in enthalpy derived from a
linear regression of enthalpy change with respect to melting tempera-
ture (DC
p,H
¼ dDH/dT
m
); DC
p,S
, the heat capacity change in entropy
derived from a linear regression of entropy change with respect to the
logarithmic scale of melting temperature (DC
p,S
¼ dDS/d lnT
m
); T
0
,
the reference temperature; DH
0
, the enthalpy change in the reference
state; DS
0
, the entropy change in the reference state; NN-model, the
nearest-neighbor model.
*Present address: Department of Chemistry, The Pennsylvania State
University, University Park, PA 16802, USA.
(Received 31 October 2001, revised 30 January 2002,
accepted 30 January 2002)
Eur. J. Biochem. 269, 2821–2830 (2002) Ó FEBS 2002 doi:10.1046/j.1432-1033.2002.02970.x
the helix-to-coil melting is a non-two-state transition
[27,30,32] and the difference in hydration between the
duplex-stranded groups and single-stranded groups results
in a heat capacity increase [26–29,34,37–42]. It should be
noted that for short oligonucleotide sequences, the duplex
formation behaves in a two-state transition [17,43], while for
longer oligonucleotide sequences, the duplex formation
often behaves as a non-two-state transition due to the self-
assembled population of single strands [27,30]. Although
the change in heat capacity was generally regarded as a
dominant factor for the difference between the van’t Hoff
enthalpy and the calorimetric enthalpy [28,29,36–38], the
effect of heat capacity change on the thermodynamic
properties of duplex formation, except for a few studies
[39–42], has been lacking. Therefore, systemic and extensive
investigations are still required to assign universally appro-
priate parameter sets of the temperature-dependent ther-
modynamics for the DNA/DNA and RNA/DNA
oligonucleotide duplexes.
In the present study, we determined the temperature-
independent and temperature-dependent thermodynamic
parameters of 24 DNA/DNA and 41 RNA/DNA oligo-
nucleotide duplexes. The heat capacity changes were
derived by two methods: a linear regression of enthalpy
with respect to the melting temperature (DC
p,H
¼ dDH/
dT
m
) and a linear regression of entropy with respect to
the logarithmic scale of the melting temperature
(DC
p,S
¼ dDS/dlnT
m
). The thermodynamic properties of
the duplex formation determined by DC
P
¼ 0and
DC
P
6¼ 0 were extensively discussed and compared. The
compensation of the temperature-dependent enthalpy and
entropy was also taken into account. Finally, the 16 NN-
model free energy parameters and one helix initiation
at physiological temperature were extracted from the
temperature-dependent thermodynamic data of the
41 RNA/DNA hybrids. These observations provide a
thorough insight into the origin of the duplex association/
dissociation transition.
MATERIALS AND METHODS
Material preparations
DNA and RNA oligonucleotides were synthesized on a
solid support using the standard phosphoramidite method
with an Applied Biosystems Model 391 synthesizer and
purified by RP-HPLC with Wakosil-II 5C18RS cartridges
after de-blocking operations, then the oligonucleotides
were aliquoted for the UV melting experiments. The final
purity of these oligonucleotides was greater than 95%. All
experiments were carried out in a buffer solution contain-
ing 1
M
NaCl/10 m
M
Na
2
HPO
4
/1 m
M
Na
2
EDTA
(pH 7.0). The single strand concentrations of the oligonu-
cleotides were determined by measuring the absorbance
(260 nm) at a high temperature. Two complementary
single strands were mixed in an equimolar ratio to form a
duplex.
UV melting measurements
UV thermal scans with single and duplex strands were
performed on Hitachi U-3200 and U-3210 spectrophoto-
meters equipped with a Hitachi SPR-7 and SPR-10
thermoprogrammer and temperature probes. All melting
curves of the duplex denaturation were collected at a 260-nm
wavelength as a function of temperature over the range from
0to95°C. Prior to the melting experiments, the samples
were first heated to 95 °C for 20 min and then slowly
annealed to the starting temperature of each heating-cooling
cycle. The water condensation on the cuvette exterior in the
low temperature region can be avoided by flushing with a
constant stream of dry nitrogen. The heating rates were fixed
at 0.5 or 1.0 °CÆmin
)1
based on the cuvette length. For each
oligonucleotide duplex, at least seven individual scans were
performed to determine the thermodynamic parameters.
Temperature-independent thermodynamic analysis
To provide the maximum likelihood of a two-state pattern
for the duplex association/dissociation transition, all the
oligonucleotide sequences were designed to avoid the
formation of hairpin or slipped duplex structures and to
limit the base pair length less than 12 bp. For any of the
non-self-complementary duplex formations, the thermody-
namic parameters can be determined by two conventional
van’t Hoff analysis methods. One is to plot the reciprocal of
the melting temperature (in Kelvin), T
À 1
m
,vs.ln(C
T
/4) using
the van’t Hoff equation [19,24,25,39–42]:
T
À1
m
¼
R
DH
ln
C
T
4
þ
DS
DH
ð1Þ
where DH and DS are the enthalpy and entropy changes,
respectively. T
m
is melting temperature. C
T
is the total
species concentration and R is the gas constant, 1.987
calÆK
)1
mol
)1
. Another method is to fit the shape of the
melting curves by using nonlinear least-squares program. In
all cases, the absorbance as a function of temperature in the
course of duplex melting can be given by [22,39,44–47]:
AðTÞ¼ð1 À aÞÂA
helix
ðTÞþa  A
coil
ðTÞð2Þ
where A(T) is the absorbance of a solution at the
temperature of interest. A
helix
(T)andA
coil
(T) are defined
as the sloped linear baselines of the melting curves in the
helix and coil states, respectively [45,47]. That is:
A
helix
ðTÞ¼b
ds
þ m
ds
 T ð3Þ
A
coil
ðTÞ¼b
ss
þ m
ss
 T ð4Þ
where b
ds
, b
ss
, m
ds
,andm
ss
are the intercepts and slopes of
the lower and upper baselines of the melting curves,
respectively; T is the temperature of interest in Kelvin, a is
the molar fraction of strands in the coiled state and can be
written as:
a ¼ 1 þ
1 À
ffiffiffiffiffiffiffiffiffiffiffiffiffiffiffiffiffiffiffiffiffiffiffiffiffiffiffiffiffiffiffiffiffiffiffiffiffiffiffiffiffiffiffiffiffiffiffiffiffiffiffiffiffiffiffiffiffiffiffiffiffiffiffiffiffiffiffiffiffiffiffiffi
2C
T
exp½ðÀDH þ TDSÞ=ðRTÞ þ 1
p
C
T
exp½ðÀDH þ TDSÞ=ðRTÞ
ð5Þ
The enthalpy and entropy changes of each transition, as the
estimated parameters, are determined by the best fit to the
shape of the melting curves according to Eqns (2)–(5). The
resulting enthalpy change and entropy changes are obtained
by averaging all the fitted values at the different concentra-
tions. It should be noted that the above two methods imply
the assumption of DC
p
¼ 0 [19–25,44–48].
2822 P. Wu et al. (Eur. J. Biochem. 269) Ó FEBS 2002
Temperature-dependent thermodynamic analysis
The differences in hydration between the structured duplex
strand and the coiled single strands gives rise to an increase
in the heat capacity [27,49–52], resulting in a clear
temperature dependence of the enthalpy and entropy
changes [36–42]. With respect to the reference state, the
enthalpy and entropy changes as a function of temperature
are given by [14,28,39,53–56]:
DHðT
m
Þ¼DH
0
þ
Z
T
T
0
DC
p;H
dT
¼ DH
0
þ DC
p;H
ðT
m
À T
0
Þð6Þ
DSðT
m
Þ¼DS
0
þ
Z
T
T
0
DC
p;S
dlnT
¼ DS
0
þ DC
p;S
lnðT
m
=T
0
Þð7Þ
where DH and DS are the enthalpy and entropy changes at
the temperature of interest, DH
0
and DS
0
are the enthalpy
and entropy changes in the reference state, T
0
is the
reference temperature, DC
p,H
is the heat capacity change in
enthalpy derived from a linear regression of the enthalpy
change with respect to the melting temperature
(DC
p,H
¼ dDH/dT
m
), and DC
p,S
is the heat capacity
change in entropy derived from a linear regression of the
entropy change with respect to the logarithmic scale of the
melting temperature (DC
p,S
¼ dDS/dlnT
m
). In principle,
the heat capacity changes determined by the above two
methods should be equivalent. However, Rouzina &
Bloomfield analyzed the published data on DH and DS
of the duplex formation and revealed that there were
always differences between DC
p,H
and DC
p,S
[28]. Such
differences in heat capacity change were theoretically
confirmed and the arithmetic mean value, DC
ave
p
¼
(DC
p,H
+ DC
p,S
)/2, was suggested [28]. These observations
are further confirmed by recent studies [55]. Thus, the free
energy change at the temperature of interest can be written
as [54]:
DGðT
m
Þ¼DH
0
ð1 À T
m
=T
0
Þ
þ DC
ave
p
½T
m
À T
0
À T
m
lnðT
m
=T
0
Þ ð 8Þ
The mean values of thermodynamic parameters
For DC
p
¼ 0, the statistical mean values of the enthalpy and
entropy changes, DH
mean
and DS
mean
, are simply given by:
DH
mean
¼
P
m
i ¼ 1
DH
i
n
ð9Þ
DS
mean
¼
P
m
i ¼ 1
DS
i
n
ð10Þ
where DH
i
and DS
i
are the enthalpy and entropy changes at
each concentration. n is the number of measurements.
For DC
P
6¼ 0, DH(T)andDS(T) should be taken as a
continuous function of the melting temperature on the
temperature interval [T
min
, T
max
] (Eqns 6 and 7), as a result,
the mean values of the temperature-dependent enthalpy and
entropy changes can be written as:
DH
mean
¼ DH
0
þ DC
ave
P
ðT
mean
À T
0
Þð11Þ
DS
mean
¼ DS
0
þ DC
ave
P
lnðT
mean
=T
0
Þð12Þ
where T
min
and T
max
are the minimum and maximum
temperatures over the experimental temperature range,
respectively. T
mean
is the arithmetic mean value of T
min
and
T
max
, i.e. T
mean
¼ (T
min
+ T
max
)/2. Likewise, the melting
temperature at the concentration of interest, C
T
,canbe
given by:
T
m
¼
DH
0
þ DC
ave
p
ðT
m
À T
0
Þ
RlnðC
T
=4ÞþDS
0
þ DC
ave
p
lnðT
m
=T
0
Þ
ð13Þ
RESULTS AND DISCUSSION
Temperature-independent thermodynamic parameters
In contrast to the temperature-dependent thermodynamic
parameters of the 24 DNA/DNA and 41 RNA/DNA
oligonucleotide duplexes (Table 1), the temperature-inde-
pendent thermodynamic parameters (data not shown)
clearly depend on the experimental temperature range.
Direct comparison of the two parameter sets revealed that
the temperature-independent thermodynamic parameters
could provide a reasonable approximation only when the
temperature of interest deviates only slightly from the mean
melting temperature over the experimental range (data not
shown).
Heat capacity change
It is well known that the heat capacity change is the net
sum of the positive contribution from the exposure of
nonpolar groups and the negative contribution from the
exposure of polar groups [49,51]. When the structured
double strand is melted into the coiled single strands, the
difference in hydration between the different strands
results in an increase of the heat capacity. This heat
capacity change is related to the ratio of the nonpolar to
polar buried surface in an oligonucleotide duplex [27,49–
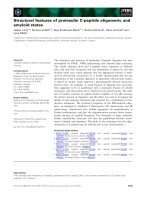
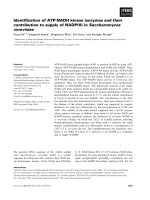
52]. Figures 1 and 2 show the representative plots of
temperature dependence of the enthalpy and entropy
changes for the different base-pair compositions and
sequence lengths. As the perturbation contributed from
the enthalpy and entropy changes might be different in
the course of duplex melting, the heat capacity change in
enthalpy, DC
p,H
, is not always in agreement with the heat
capacity change in entropy, DC
p,S
, as summarized in
Table 1. Nevertheless, these differences are mostly limited
to 5%. Recently, Rouzina & Bloomfield theoretically
confirmed that the difference between DC
p,H
and DC
p,S
should equal the transition entropy [28]. The current
experimental studies strongly support this conclusion [55].
Similar reports have also been seen in previous studies
[39]. This insight suggests that the extent of enthalpy and
entropy changes along with temperature might be differ-
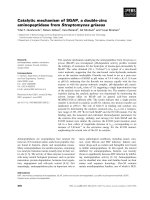
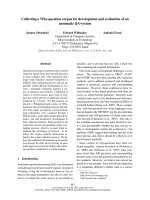
ent in the real course of the duplex melting. The heat
capacity change depends somewhat on the base-pair
compositions and sequences; the mean values are gener-
ally limited in the range )160 to )40 calÆmol
)1
ÆK
)1
per
base-pair (see Fig. 3), consistent with the previous spect-
roscopic [28,39–42,55,56] and calorimetric measurements
[27,34,36]. Additionally, the current studies further
Ó FEBS 2002 Temperature dependence of thermodynamic properties (Eur. J. Biochem. 269) 2823
Table 1. Heat capacity changes and temperature-dependent thermodynamic parameters of DNA complexes. Only the top sequences are shown and all the complementary sequences are DNA strands. All
experiments were carried out in a buffer containing 1
M
NaCl/10 m
M
Na
2
HPO
4
/1 m
M
Na
2
EDTA (pH 7.0). Temperature range indicates the melting temperatures over the entire experimental range. DC
p,H
is the
heat capacity change in enthalpy derived from a plot of DH vs. T
m
, DC
p,H
¼ dDH/dT
m
. DC
p,S
is the heat capacity change in entropy derived from plot of DS vs. ln T
m
, DC
p,S
¼ dDS/dLnT
m
. DC
ave
p
are the
arithmetic mean value of DC
p,H
and DC
p,S
. The temperature-dependent thermodynamic parameters at 25 °C and at 37 °C are estimated by Eqns (6)–(8). T
m
was calculated by Eqn (13) at a total species
concentration of 100 l
M
.
Temperature
range
(°C)
Heat capacity change Thermodynamic parameters at 37 °C Thermodynamic parameters at 25 °C
)DC
p,H
(kcalÆmol
)1
ÆK
)1
)
)DC
p,S
(kcalÆmol
)1
ÆK
)1
)
)DC
ave
p
(kcalÆmol
)1
ÆK
)1
)
)DH
37
(kcalÆmol
)1
)
)DS
37
(calÆmol
)1
ÆK
)1
)
)DG
37
(kcalÆmol
)1
)
)DH
25
(kcalÆmol
)1
)
)DS
25
(calÆmol
)1
ÆK
)1
)
)DG
25
(kcalÆmol
)1
)
T
m
(°C)
DNA/DNA
dAGCCG/d 20.4–34.1 0.46 0.41 0.43 45.9 129.4 5.74 40.4 113.2 6.64 31.6
dCGTGC/d 20.5–33.9 0.62 0.59 0.61 48.2 137.6 5.48 40.7 114.2 6.68 30.1
dCGGTGC/d 30.8–44.6 0.94 0.96 0.95 57.9 164.3 6.99 46.7 126.5 8.98 39.4
dCACGGC/d 26.1–44.9 2.04 1.94 1.99 68.0 196.0 7.21 43.6 119.4 7.97 40.0
dACCGCA/d 21.6–39.3 0.28 0.27 0.28 41.0 110.8 6.67 37.6 100.1 7.78 38.0
dAATACCG/d 19.1–33.0 0.89 0.88 0.88 54.3 157.7 5.39 43.7 123.0 6.99 30.3
dAGCTTCA/d 19.9–36.2 0.86 0.84 0.85 52.8 150.8 5.99 42.4 117.5 7.36 33.8
dAGCCGTG/d 35.8–48.7 0.70 0.70 0.70 49.8 133.7 8.31 41.4 106.1 9.79 47.7
dGGATTGA/d 15.1–30.2 0.94 0.92 0.93 55.8 162.4 5.39 44.5 126.0 6.88 30.4
dACCTAGTC/d 26.9–40.0 1.46 1.53 1.51 57.7 164.8 6.59 39.9 104.5 8.70 37.3
dCTAGTGGA/d 30.6–42.9 0.66 0.69 0.68 50.6 140.4 7.07 42.6 113.1 8.93 40.3
dGTCGAACA/d 33.9–45.5 0.38 0.40 0.39 54.6 149.7 8.15 50.1 134.0 10.11 46.2
dGCCAGTTA/d 35.0–49.4 0.66 0.65 0.66 49.8 135.0 7.93 41.9 109.2 9.32 45.5
dCGCTGTAA/d 31.4–43.9 0.32 0.31 0.32 49.8 136.2 7.53 45.9 123.8 8.96 43.2
dCACGGCTC/d 42.3–53.1 0.35 0.42 0.39 52.8 137.2 10.22 48.6 120.6 12.61 58.5
dAATCCAGT/d 26.5–40.5 0.28 0.27 0.28 52.0 145.8 6.76 48.6 135.0 8.34 38.4
dAGTCCTGA/d 24.4–40.4 0.70 0.69 0.70 48.8 133.2 7.45 40.4 105.9 8.77 42.7
dACGACCTC/d 35.9–47.5 0.42 0.41 0.42 55.2 150.5 8.53 50.1 134.5 10.04 48.2
dCTCACGGC/d 39.9–51.2 0.97 1.01 0.99 47.3 123.2 9.14 35.7 83.4 10.79 52.5
dAGCGTAAG/d 31.6–44.7 0.38 0.38 0.38 47.8 130.2 7.37 43.2 115.4 8.81 42.4
dATCTATCCG/d 37.8–46.7 1.03 1.11 1.07 54.7 148.5 8.59 42.3 104.9 11.03 48.0
dGCCAGTTAA/d 37.0–47.6 0.11 0.12 0.12 61.1 169.6 8.53 59.8 164.9 10.59 47.4
dGCCAGTTAT/d 38.9–48.5 0.76 0.81 0.78 57.2 155.8 8.91 48.2 123.9 11.20 49.4
dGCATAATACGT/d 42.9–52.5 0.05 0.10 0.08 74.6 206.1 10.72 74.0 202.0 13.76 55.5
RNA/DNA
rCGGCU/d 15.2–30.4 0.21 0.19 0.20 49.9 141.9 5.93 47.4 134.3 7.34 33.3
rAGCCG/d 24.9–38.7 0.68 0.68 0.68 49.7 141.6 5.73 41.6 114.8 7.33 31.9
rGCACG/d 19.2–31.4 0.27 0.26 0.27 44.5 126.8 5.18 41.3 116.5 6.50 27.6
rCAAUCG/d 10.5–23.7 0.77 0.77 0.77 58.9 177.9 3.76 50.0 147.6 5.97 21.6
rGGCACG/d 29.6–45.9 0.59 0.53 0.56 61.1 173.5 7.29 54.1 153.0 8.46 40.8
rCGUGCC/d 25.4–40.6 0.22 0.19 0.21 50.4 141.7 6.48 47.8 134.2 7.75 36.7
rGCACCG/d 20.5–47.6 0.37 0.27 0.32 56.4 159.0 7.08 51.9 148.3 7.70 40.0
rCGGUGC/d 27.7–42.7 0.86 0.84 0.85 51.2 142.1 7.11 40.9 108.8 8.45 40.5
2824 P. Wu et al. (Eur. J. Biochem. 269) Ó FEBS 2002
Table 1. (Continued)
Temperature
range
(°C)
Heat capacity change Thermodynamic parameters at 37 °C Thermodynamic parameters at 25 °C
)DC
p,H
(kcalÆmol
)1
ÆK
)1
)
)DC
p,S
(kcalÆmol
)1
ÆK
)1
)
)DC
ave
p
(kcalÆmol
)1
ÆK
)1
)
)DH
37
(kcalÆmol
)1
)
)DS
37
(calÆmol
)1
ÆK
)1
)
)DG
37
(kcalÆmol
)1
)
)DH
25
(kcalÆmol
)1
)
)DS
25
(calÆmol
)1
ÆK
)1
)
)DG
25
(kcalÆmol
)1
)
T
m
(°C)
rGCCGUG/d 21.9–35.9 0.81 0.78 0.80 59.3 170.2 6.48 49.5 139.4 7.98 36.7
rCACGGC/d 23.2–41.7 0.95 0.89 0.92 52.4 146.0 7.16 41.1 111.0 7.98 40.7
rACGUAUG/d 15.8–33.0 1.02 0.96 0.99 61.9 181.2 5.76 49.7 143.1 7.05 33.1
rCGGUAUU/d 20.0–33.2 0.61 0.60 0.60 53.9 156.2 5.42 46.6 132.6 7.05 30.5
rAAUACCG/d 16.5–30.3 1.02 0.99 1.00 58.7 173.2 4.93 46.5 134.2 6.44 28.1
rUGAAGCU/d 28.6–40.2 1.10 1.06 1.08 59.7 171.2 6.62 46.5 129.5 7.93 37.5
rAGCUUCA/d 14.5–30.0 1.00 0.95 0.97 55.8 161.6 5.69 43.9 124.2 6.82 32.2
rCACGGCU/d 34.5–49.1 0.65 0.62 0.63 51.2 138.1 8.35 43.4 113.7 9.48 47.7
rAAUGUCGC/d 29.5–42.2 1.35 1.36 1.35 64.8 185.8 7.19 48.7 132.3 9.22 40.1
rGACUAGGU/d 30.7–48.2 0.69 0.67 0.68 59.3 165.4 8.04 51.0 139.1 9.57 44.8
rACCUAGUC/d 31.3–42.7 1.26 1.26 1.26 58.6 165.3 7.31 43.4 115.5 8.98 41.0
rCUAGUGGA/d 34.8–46.7 0.88 0.88 0.88 58.2 161.6 8.07 47.7 126.8 9.88 45.0
rGCCAGUUA/d 27.9–41.8 0.82 0.76 0.79 59.1 166.4 7.48 49.3 136.2 8.66 41.9
rUUACAGCG/d 26.9–40.6 1.13 1.16 1.15 55.7 158.1 6.63 42.1 112.3 8.61 37.6
rCGCUGUAA/d 29.8–37.1 1.89 1.89 1.89 67.1 196.1 6.31 44.5 121.5 8.25 36.0
rUUGGCACC/d 36.9–51.6 0.76 0.78 0.77 45.2 118.0 8.63 36.1 87.4 10.08 50.5
rCUACGCUU/d 20.7–35.6 0.59 0.58 0.58 56.1 160.0 6.49 49.0 137.3 8.07 36.8
rAAGCGUAG/d 31.6–45.0 0.66 0.69 0.68 60.9 171.7 7.63 52.9 144.3 9.91 42.6
rGAGCCGUG/d 40.0–56.0 1.36 1.33 1.34 52.3 139.3 9.12 36.0 86.9 10.13 50.7
rCACGGCUC/d 36.9–51.5 0.96 0.91 0.94 54.7 146.8 9.15 43.1 110.9 10.04 50.9
rACUGGAUU/d 31.9–42.8 0.38 0.36 0.37 59.0 166.4 7.40 54.5 152.1 9.11 41.6
rAAUCCAGU/d 21.5–36.0 0.58 0.62 0.60 49.0 139.2 5.82 42.1 114.9 7.80 32.5
rGGACUCAG/d 30.4–44.7 0.56 0.59 0.57 53.7 147.4 7.96 47.0 124.1 9.94 45.1
rCUGAGUCC/d 23.8–42.1 1.60 1.56 1.58 52.3 143.7 7.70 33.1 82.2 8.61 43.5
rGAGGUCGU/d 38.3–51.7 0.93 1.00 0.96 51.6 135.3 9.68 40.5 95.9 11.91 54.2
rACGACCUC/d 30.6–42.0 1.00 0.92 0.96 54.1 147.9 8.16 42.0 111.5 8.78 45.9
rAGUCCUGA/d 20.3–35.4 1.23 1.12 1.17 62.3 177.9 7.12 47.6 133.6 7.76 39.9
rGCCGUGAG/d 39.6–51.8 0.45 0.45 0.45 53.2 141.5 9.32 47.8 123.6 10.97 53.0
rCUUACGCU/d 23.6–36.9 1.58 1.60 1.59 59.8 172.7 6.20 40.8 109.7 8.04 35.2
rAUCUAUCCG/d 25.1–39.6 1.14 1.15 1.14 59.4 169.6 6.82 45.8 124.3 8.70 38.5
rCGCUGUUAG/d 33.8–44.6 0.38 0.50 0.44 61.5 172.7 7.93 56.9 152.9 11.29 44.0
rCAACAGCAA/d 31.0–48.3 1.07 1.07 1.07 44.5 117.5 8.02 31.6 75.4 9.10 46.6
rUUAACUGGC/d 37.6–52.0 1.38 1.28 1.33 65.6 185.0 8.25 49.1 134.4 9.05 44.7
Ó FEBS 2002 Temperature dependence of thermodynamic properties (Eur. J. Biochem. 269) 2825
confirmed that the heat capacity changes derived from the
spectroscopic and calorimetric measurements were in
good agreement [54].
Temperature-dependent enthalpy and entropy changes
As the enthalpy and entropy changes are state functions,
their values, in nature, are dependent on the temperature of
interest. Table 1 summarizes the thermodynamic para-
meters of the 24 DNA/DNA and 41 RNA/DNA duplexes
at standard temperature (25 °C) and physiological
temperature (37 °C). Direct comparison shows that the
temperature-independent and temperature-dependent ther-
modynamic parameters are clearly different, while the two
mean values of the thermodynamic parameters derived
from DC
P
¼ 0andDC
P
6¼ 0 are in excellent agreement (data
not shown). These observations further support that the
assumption of DC
P
¼ 0 would be more reasonable only
when the statistical mean values of the thermodynamic
parameters are taken into account.
To our knowledge, the published nearest-neighbor model
parameters were generally extracted from the temperature-
independent thermodynamic data of the oligonucleotide
duplexes [16–25,57]. This requires that the melting tempera-
tures of all the investigated sequences should have a small
deviation from 37 °C over the experimental range. How-
ever, with the intrinsic limitation of the UV measurements,
it is impossible to determine the thermodynamic parameters
at the same temperature for all the duplexes only by
Fig. 1. The representative temperature dependence of the thermody-
namic parameters for various base-pair compositions. (A) DH vs. T
m
;(B)
DS vs. lnT
m
. rCGCUGUAA/dTTACAGCG (h), rCACGGCUC/
dGAGCCGTG (·), rACCUAGUC/dGACTAGGT (n), rAGU
CCUGA/dTCAGGACT (s), and rGAGCCGUG/dCACGGCTC
(e).
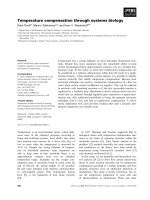
Fig. 2. The representative temperature dependence of the thermody-
namic parameters for various base-pair lengths. (A) DH vs. T
m
;(B)DS
vs. lnT
m
. rAGCCG/dCGGCT (h), rCGGUGC/dGCACCG (·),
rACGUAUG/dCATACGT (n), rACCUAGUC/dGACTAGGT
(s), and rGUAACAGCG/dCGCTGTTAC (e).
Fig. 3. Heat capacity change vs. the number of base pairs for DNA/
DNA (s) and RNA/DNA (d) oligonucleotide duplexes.
2826 P. Wu et al. (Eur. J. Biochem. 269) Ó FEBS 2002
temperature-independent thermodynamic analysis. In other
words, the experimental temperature range may be far lower
than 37 °C for shorter oligonucleotide sequences or higher
than 37 °C for longer oligonucleotide sequences. As a result,
the simple extrapolation of the thermodynamic parameters
to 37 °C is completely necessary. In this case, Eqns (6) and
(7) provide a reasonable and valid way to estimate the
thermodynamic parameters at the temperature of interest.
With the difference in detecting principles, the strand
concentrations of the UV measurements are generally
smaller than those of the DSC measurements for the same
nucleotide sequences. Such differences in the strand con-
centration are rarely taken into account in the previous
reports when the van’t Hoff enthalpy changes were com-
pared with the calorimetric enthalpy changes [30,31,33]. In
fact, the melting temperature essentially depends on the
strand concentration for a bimolecular transition. This
implies that due to great different in the strand concentra-
tion, the van’t Hoff enthalpy change derived from the
temperature-independent thermodynamic analysis should
be different from the calorimetric enthalpy change. If the
two enthalpy changes were compared at the same tempera-
ture, the clear deviation would be cancelled. Recent studies
have confirmed that there should be not statistically
significant discrepancies in the enthalpy change when the
heat capacity changes were taken into account [54,55]. As an
alternative method, a plot of T
À 1
m
vs. ln(C
T
/4) by combining
theUVandDSCmeasurementswasused[26].
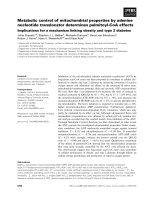
Enthalpy–entropy compensation
Figure 4 shows the compensation correlation of the
temperature-dependent enthalpy and entropy changes for
all the sequences listed in Table 1. Although a rectangular
hyperbola relationship between the enthalpy and entropy
changes was proposed [28,58], the plot in Fig. 4 is an
approximate straight line [21,48,52,53,59]. The empirical
correlation of the temperature-dependent enthalpy and
entropy changes can be given by:
DH ¼ 0:983 Â T
m
DS À 8:218 ð14Þ
where the correlation coefficient is 0.997 and the standard
deviation is 0.734, respectively. This reflects the fact that the
enthalpy–entropy compensation is significant and a large
increase in the enthalpy change is necessarily accompanied
by the large increase in the entropy change. Compared with
the compensation of the temperature-independent enthalpy
and entropy changes reported in a previous study (DH/
T
m
DS ¼ 1.15 [48]), the extent of the compensation of the
temperature-dependent enthalpy and entropy changes
might be more significant.
The effects of heat capacity change on the free energy
change and melting temperature
The free energy change and melting temperature are two
critically important parameters, which are often used to
characterize the stability of base pairing, to predict secon-
dary or tertiary structures of nucleic acids, and to determine
the optimal temperature in PCR, RCA, and in situ
hybridization. In contrast to clear temperature-dependence
of the enthalpy and entropy changes, the free energy change
and melting temperature are relatively insensitive to the heat
capacity change (data not shown). This suggests that the
free energy change determined by DC
p
¼ 0 would be a more
accurate parameter than either the individual enthalpy
change or entropy change [13,21,39,52,53]. These observa-
tions have been confirmed by the DSC measurements, in
which, despite an almost 100% difference in the two
enthalpy changes for the investigated duplexes, the trans-
ition temperatures determined by the DSC measurements
were in excellent agreement with the melting temperatures
of the corresponding concentrations linearly extrapolated
by the UV measurements [31].
The improved NN-model parameters
The nearest-neighbor model has been widely applied to
predict the thermodynamic properties and secondary or
tertiary structures of the sequence-dependent nucleotides
[1–4,8]. In this model, the contribution of a given sequence
to the thermodynamic properties is assumed to be directly
related to the identity of the nearest-neighbor doublets and
to have a linear dependence on the occurrence of these
nearest neighbors [17,19,21,22,25,48,60,61]. Herein, we
attempted to extract the NN-model free energy parameters
at physiological temperature from the temperature-depend-
ent thermodynamic data of the 41 RNA/DNA hybrids
listed in Table 1 (see Table 2). As for the previous study
Fig. 4. Compensation plot of temperature-dependent enthalpy and
entropy for 5 bp (h), 6 bp (·), 7 bp (n), 8 bp (s), and 9 bp (e). (A) A
plot of DH vs. DS;(B)AplotofDH vs. T
m
DS. The straight lines were
obtained by linear regression.
Ó FEBS 2002 Temperature dependence of thermodynamic properties (Eur. J. Biochem. 269) 2827
[19], we find that the two NN-model free energy sets have
nearly identical trends but there are clear differences for
many nearest-neighbor sequences and helix initiation (see
Table 2). Nevertheless, the mean values of 16 NN-model
parameters determined by two different methods are similar
()1.5 kcalÆmol
)1
for DC
p
¼ 0and)1.2 kcalÆmol
)1
for
DC
p
„ 0). A possible interpretation is that the two studies
selected different oligonucleotide sequences and applied
different thermodynamic analysis methods. As the thermo-
dynamic parameters derived from DC
p
¼ 0 clearly depend
on the experimental temperature range, it is impossible to
determine the thermodynamic parameters at exactly 37 °C
for all the investigated duplexes only by the temperature-
independent thermodynamic analysis, thus small deviations
in the free energy change of different sequences would
accumulate and result in a large contribution to the
NN-model parameters.
It should be noted that the published NN-model param-
eters were generally extracted from the temperature-inde-
pendent thermodynamic data [17,19,21,22,25]. It is not
surprising that some disagreement in the NN-model
parameters has been revealed by several laboratories
[17,20–22,57,62,63]. Although the unified NN-model
parameters were suggested to be the salt concentration
dependence of the oligonucleotide sequences [64], the heat
capacity change would be an important factor [34,37–
42,54,55]. Moreover, the primary results of Turner and
coworkers confirmed that the NN-model parameter sets
derived from the temperature-independent thermodynamics
were somewhat different from those derived from the
temperature-dependent thermodynamics [65]. Our work
extended their studies and extracted the NN-model free
energy parameters from the temperature-dependent ther-
modynamic data. This improvement will enhance the
accuracy of the predictions of the secondary or tertiary
structures for nucleotide hybrids in vivo.
ACKOWLEDGEMENTS
This work was supported in part by Grants-in-Aids from the Ministry
of Education, Science, Sports and Culture, Japan, and a Grant from
ÔResearch for the FutureÕ Program of the Japan Society for the
Promotion of Science to N. S.
REFERENCES
1. Lu
¨
ck, R., Steger, G. & Riesner, D. (1996) Thermodynamic pre-
diction of conserved secondary structure: application to the RRE
element of HIV, the tRNA-like element of CMV and the mRNA
of prion protein. J. Mol. Biol. 258, 813–826.
2. Mathews,D.H.,Sabina,J.,Zuker,M.&Turner,D.H.(1999)
Expanded sequence dependence of thermodynamic parameters
improves prediction of RNA secondary structure. J. Mol. Biol.
288, 911–940.
3. Zuker, M. (1989) On finding all suboptimal foldings of an RNA
molecule. Science 244, 48–52.
4. Chen, J.H., Le, S.Y. & Maizel, J.V. (2000) Prediction of common
secondary structures of RNAs: a genetic algorithm approach.
Nucleic Acids Res. 28, 991–999.
5. Chee,M.,Yang,R.,Hubbel,E.,Berno,A.,Huang,X.H.C.,Stern,
D., Winkler, J., Lockhart, D.J., Morris, M.S. & Fodor, S.P. (1996)
Accessing genetic information with high-density DNA arrays.
Science 274, 610–614.
6. Howell, W.M., Jobs, M., Gyllensten, U. & Brookes, A.J. (1999)
Dynamic allele-specific hybridization. A new method for scoring
single nucleotide polymorphisms. Nat. Biotechnol. 17, 87–88.
7. Shi, G.Y. & Wu, H.L. (1988) Isolation and characterization of
microplasminogen. A low molecular weight form of plasminogen.
J. Biol. Chem. 263, 17071–17075.
8. Lizardi, P.M., Huang, X., Zhu, Z., Bray-Ward, P., Thomas, D.C.
& Ward, D.C. (1998) Mutation detection and single-molecule
counting using isothermal rolling-circle amplification. Nat. Genet.
19, 225–232.
9. Gibbs, R.A. (1990) DNA amplification by the polymerase chain
reaction. Anal. Chem. 62, 1202–1214.
10. Valenzuela, J.G., Francischetti, I.M.B. & Ribeiro, M.C. (1999)
Purification, cloning, and synthesis of a novel salivary anti-
thrombin from the mosquito Anopheles albimanus. Biochemistry
38, 11209–11215.
11. Service, R.F. (1998) DNA chips survey an entire genome. Science
281, 1122.
12. Marshall, A. & Hodgson, J. (1998) DNA chips: an array of pos-
sibilities. Nat. Biotechnol. 16, 27–31.
13. SantaLucia, J. Jr & Turner, D.H. (1997) Measuring the thermo-
dynamics of RNA secondary structure formation. Biopolymers
44, 309–319.
14. Cooper, A. (1999) Thermodynamic analysis of biomolecular
interactions. Curr. Opin. Chem. Biol. 3, 557–563.
15. Freire, E. (1995) Thermal denaturation methods in the study of
protein folding. Methods Enzymol. 259, 144–168.
16. Freier, S.M., Kierzek, R., Jaeger. J.A., Sugimoto, N., Caruthers,
M.H.,Neilson,T.&Turner,D.H.(1986)Improvedfree-energy
parameters for predictions of RNA duplex stability. Proc. Natl
Acad. Sci. USA 83, 9373–9377.
17. Breslauer, K.J., Frank, R., Blocker, H. & Marky, L.A. (1986)
Predicting DNA duplex stability from the base sequence. Proc.
Natl Acad. Sci. USA 83, 3746–3750.
Table 2. Comparison of the NN-model free energy parameters at 37 °C
for RNA/DNA hybrids. The temperature-independent free energy
parameters were reported previously [19]. The temperature-dependent
free energy parameters were extracted from the 41 RNA/DNA
hybrids by the following equation: DG ¼ DG
int
þ
P
n
i
DG
i
ðNNÞ,
where DG
int
is the initiation free energy, DG
i
(NN) is the free energy
change for the 16 possible Watson-Crick nearest neighbor base–pair
interactions, and n
i
is the occurrence number of the i-th nearest
neighbor, respectively.
Sequences
Temperature-
independent DG
37
(kcalÆmol
)1
)
Temperature-
dependent DG
37
(kcalÆmol
)1
)
rAA/dTT )1.0 )0.4
rAC/dTG )2.1 )1.6
rAG/dTC )1.8 )1.4
rAU/dTA )0.9 )1.0
rCA/dGT )0.9 )1.0
rCC/dGG )2.1 )1.5
rCG/dGC )1.7 )1.2
rCU/dGA )0.9 )0.9
rGA/dCT )1.3 )1.4
rGC/dCG )2.7 )2.4
rGG/dCC )2.9 )2.2
rGU/dCA )1.1 )1.5
rUA/dAT )0.6 )0.3
rUC/dAG )1.5 )0.8
rUG/dAC )1.6 )1.0
rUU/dAA )0.2 )0.2
Initiation 3.1 1.0
2828 P. Wu et al. (Eur. J. Biochem. 269) Ó FEBS 2002
18. Walter, A.E. & Turner, D.H. (1994) Sequence dependence of
stability for coaxial stacking of RNA helixes with Watson–Crick
base paired interfaces. Biochemistry 33, 12715–12719.
19. Sugimoto, N., Nakano, S., Katoh, M., Matsumura, A.,
Nakamuta, H., Ohmichi, T., Yoneyama, M. & Sasaki, M. (1995)
Thermodynamic parameters to predict stability of RNA/DNA
hybrid duplexes. Biochemistry 34, 11211–11216.
20. Sugimoto, N., Nakano, S., Yoneyama, M. & Honda, K. (1996)
Improved thermodynamic parameters and helix initiation factor
to predict stability of DNA duplexes. Nucleic Acids Res. 24, 4501–
4505.
21. Allawi, H. & SantaLucia, J. Jr (1997) Thermodynamics and NMR
of internal GÆT mismatches in DNA. Biochemistry 36, 10581–
10594.
22. Xia, T., SantaLucia, J. Jr, Burkard, M.E., Kierzek, R., Schroeder,
S.J.,Jiao,X.,Cox,C.&Turner,D.H.(1998)Thermodynamic
parameters for an expanded nearest-neighbor model for formation
of RNA duplexes with Watson–Crick base pairs. Biochemistry 37,
14719–14735.
23. Bommarito,S.,Peyret,N.&SantaLucia,J.Jr(2000)Thermo-
dynamic parameters for DNA sequences with dangling ends.
Nucleic Acids Res. 28, 1929–1934.
24. Sugimoto, N., Nakano, M. & Nakano, S. (2000) Thermo-
dynamics–structure relationship of single mismatches in RNA/
DNA duplexes. Biochemistry 39, 11270–11281.
25. Chen, X., Kierzek, R. & Turner, D.H. (2001) Stability and
structure of RNA duplexes containing isoguanosine and iso-
cytidine. J. Am. Chem. Soc. 123, 1267–1274.
26.Jelesarov,I.,Crane-Robinson,C.&Privalov,P.L.(1999)The
energetics of HMG box interactions with DNA: thermodynamic
description of the target DNA duplexes. J. Mol. Biol. 294,
981–995.
27. Holbrook,J.A.,Capp,M.W.,Saecker,R.M.&Record,M.T.Jr
(1999) Enthalpy and heat capacity changes for formation of an
oligomeric DNA duplex: interpretation in terms of coupled pro-
cesses of formation and association of single-stranded helices.
Biochemistry 38, 8409–8422.
28. Rouzina, I. & Bloomfield, V.A. (1999) Heat capacity effects on
the melting of DNA. 1. General aspects. Biophys. J. 77, 3242–
3251.
29. Rouzina, I. & Bloomfield, V.A. (1999) Heat capacity effects on the
meltingofDNA.2.Analysisofnearest-neighborbasepaireffects.
Biophys. J. 77, 3252–3255.
30. Wu, P. & Sugimoto, N. (2000) Transition characteristics and
thermodynamic analysis of DNA duplex formation: a quantitative
consideration for the extent of duplex association. Nucleic Acids
Res. 28, 4762–4768.
31. Vallone, P.M. & Benight, A.S. (2000) Thermodynamic, spectro-
scopic, and equilibrium binding studies of DNA sequence context
effects in four 40 base pair deoxyoligonucleotides. Biochemistry 39,
7835–7846.
32. Vesnaver, G., Chang, C.N., Eisenberg, M., Grollman, A.P.
& Breslauer, K.J. (1989) Influence of abasic and anucleosidic sites
on the stability, conformation, and melting behavior of a DNA
duplex: correlations of thermodynamic and structural data. Proc.
Natl Acad. Sci. USA 86, 3614–3618.
33. Riccelli, P.V., Vallone, P.M., Kashin, I., Faldasz, B.D., Lane, M.J.
& Benight, A.S. (1999) Thermodynamic, spectroscopic, and
equilibrium binding studies of DNA sequence context effects in six
22-base pair deoxyoligonucleotides. Biochemistry 38, 11197–
11208.
34. Naghibi, H., Tamura, A. & Sturtevant, J.M. (1995) Significant
discrepancies between van’t Hoff and calorimetric enthalpies.
Proc. Natl. Acad. Sci. USA 92, 5597–5599.
35. Sugimoto, N., Wu, P., Hara, H. & Kawamoto, Y. (2001) pH and
cation effects on the properties of parallel pyrimidine motif DNA
triplexes. Biochemistry 40, 9396–9405.
36. Chalikian, T.V., Vo
¨
lker, J., Plum, G.E. & Breslauer, K.J. (1999)
A more unified picture for the thermodynamics of nucleic acid
duplex melting: a characterization by calorimetric and volume tric
techniques. Proc. Natl Acad. Sci. USA 96, 7853–7858.
37. Liu, Y. & Sturtevant, J.M. (1997) Significant discrepancies
between van’t Hoff and calorimetric enthalpies. Biophys. Chem.
64, 121–126.
38. Chaires, J.B. (1997) Possible origin of differences between van’t
Hoff and calorimetric enthalpy estimates. Biophys. Chem. 64,
15–23.
39. Petersheim, M. & Turner, D.H. (1983) Base-stacking and base-
pairing contributions to helix stability: thermodynamics of double-
helix formation with CCGG, CCGGp, CCGGAp, ACCGGp,
CCGGUp, and ACCGGUp. Biochemistry 22, 256–263.
40. Freier,S.M.,Burger,B.J.,Alkema,D.,Neilson,T.&Turner,
D.H. (1983) Effects of 3¢ dangling end stacking on the stability of
GGCC and CCGG double helices. Biochemistry 22, 6198–6206.
41. Freier, S.M., Alkema, D., Sinclair, A., Neilson, T. & Turner, D.H.
(1985) Contributions of dangling end stacking and terminal base-
pair formation to the stabilities of XGGCCp, XCCGGp,
XGGCCYp, and XCCGGYp helixes. Biochemistry 24, 4533–
4539.
42. Kierzek, R., Caruthers, M.H., Longfellow, C.E., Swinton, D.,
Turner,D.H.&Freier,S.M.(1986)Polymer-supportedRNA
synthesis and its application to test the nearest-neighbor model for
duplex stability. Biochemistry 25, 7840–7846.
43. Rentzeperis, D., Ho. J. & Marky, L.A. (1993) Contribution of
loops and nicks to the formation of DNA dumbbells: melting
behavior and ligand binding. Biochemistry 32, 2564–2572.
44. Longfellow, C.E., Kierzek, R. & Turner, D.H. (1990) Thermo-
dynamic and spectroscopic study of bulge loops in oligor-
ibonucleotides. Biochemistry 29, 278–285.
45. Evertsz, E.M., Rippe, K. & Jovin, T.M. (1994) Parallel-stranded
duplex DNA containing blocks of trans purine-purine and purine-
pyrimidine base pairs. Nucleic Acids Res. 22, 3293–3303.
46. McDowell, J.A. & Turner, D.H. (1996) Investigation of the
structural basis for thermodynamic stabilities of tandem GU
mismatches: solution structure of (rGAGGUCUC)
2
by two-
dimensional NMR and simulated annealing. Biochemistry 35,
14077–14089.
47. Ratilainen, T., Holmen, A., Tuite, E., Nielsen, P.E. & Norden, B.
(2000) Thermodynamics of sequence-specific binding of PNA to
DNA. Biochemistry 39, 7781–7791.
48. Nakano, S., Fujimoto, M., Hara, H. & Sugimoto, N. (1999)
Nucleic acid duplex stability: influence of base composition on
cation effects. Nucleic Acids Res. 27, 2957–2965.
49. Makhatadze, G.I. & Privalov, P.L. (1990) Heat capacity of
proteins. I. Partial molar heat capacity of individual amino acid
residues in aqueous solution: hydration effect. J. Mol. Biol. 213,
375–384.
50. Privalov, P.L. & Makhatadze, G.I. (1992) Contribution of
hydration and non–covalent interactions to the heat capacity effect
on protein unfolding. J. Mol. Biol. 224, 715–723.
51. Spolar, R.S., Livingstone, J.R. & Record, M.T. Jr (1992) Use of
liquid hydrocarbon and amide transfer data to estimate con-
tributions to thermodynamic functions of protein folding from the
removal of nonpolar and polar surface from water. Biochemistry
31, 3947–3955.
52. Sigurskjold, B.W. & Bundle, D.R. (1992) Thermodynamics of
oligosaccharide binding to a monoclonal antibody specific for a
Salmonella O-antigen point to hydrophobic interactions in the
binding site. J. Biol. Chem. 267, 8371–8376.
53. McPhail, D. & Cooper, A. (1997) Thermodynamics and kinetics
of dissociation of ligand-induced dimers of vancomycin anti-
biotics. J. Chem. Soc. Faraday Trans. 93, 2283–2289.
54. Horn, J.R., Russell, D., Lewis, E.A. & Murphy, K.P. (2001) van’t
Hoff and calorimetric enthalpies from isothermal titration calori-
Ó FEBS 2002 Temperature dependence of thermodynamic properties (Eur. J. Biochem. 269) 2829
metry: are there significant discrepancies? Biochemistry 40, 1774–
1778.
55. Diamond, J.M., Turner, D.H. & Mathews, D.H. (2001) Ther-
modynamics of three-way multibranch loops in RNA. Biochem-
istry 40, 6971–6981.
56. Barnes, T.W. III & Turner, D.H. (2001) Long-range cooperativity
in molecular recognition of RNA by oligodeoxynucleotides with
multiple C5-(1-propynyl) pyrimidines. J. Am. Chem. Soc. 123,
4107–4118.
57. SantaLucia, J. Jr, Allawi, H. & Seneviratne, P.A. (1996) Improved
nearest-neighbor parameters for predicting DNA duplex stability.
Biochemistry 35, 3555–3562.
58. Petruska, J. & Goodman, M.F. (1995) Enthalpy-entropy com-
pensation in DNA melting thermodynamics. J. Biol. Chem. 270,
746–750.
59. SantaLucia, J. Jr, Kierzek, R. & Turner, D.H. (1991) Functional
group substitutions as probes of hydrogen bonding between GA
mismatches in RNA internal loops. J. Am. Chem. Soc. 113, 4313–
4322.
60. Crothers, D.M. & Zimm, B.H. (1964) Theory of the melting
transition of synthetic polynucleotides: evaluation of the stacking
free energy. J. Mol. Biol. 9,1–9.
61. Ohmichi, T., Nakamuta, H., Yasuda, K. & Sugimoto, N. (2000)
Kinetic property of bulged helix formation: analysis of kinetic
behavior using nearest-neighbor parameters. J. Am. Chem. Soc.
122, 11286–11294.
62. Borer, P.N., Dengler, B., Tinoco, I. Jr & Uhlenbeck, O.C. (1974)
Stability of ribonucleic acid double-stranded helices. J. Mol. Biol.
86, 843–853.
63. Doktycz, M.J., Goldstein, R.F., Paner, T.M., Gallo, F.J. &
Benight, A.S. (1992) Studies of DNA dumbbells. I. Melting curves
of 17 DNA dumbbells with different duplex stem sequences linked
by T4 endloops: evaluation of the nearest–neighbor stacking
interactions in DNA. Biopolymers 32, 849–864.
64. SantaLucia, J. Jr (1998) A unified view of polymer, dumbbell, and
oligonucleotide DNA nearest-neighbor thermodynamics. Proc.
Natl. Acad. Sci. USA 95, 1460–1465.
65. Freier, S.M., Sinclair, A., Neilson, T. & Turner, D.H. (1985)
Improved free energies for GÆCbase-pairs.J. Mol. Biol. 185,645–
647.
SUPPLEMENTARY MATERIAL
The following material is available from http://www.
blackwell-science.com/products/journals/suppmat/EJB/
EJB2970/EJB2970sm.htm
Detailed derivations of Eqns (11) and (12).
Table S1. Temperature-independent thermodynamic
parameters of DNA complexes.
Table S2. Direct comparison of temperature-independent
and temperature-dependent thermodynamic parameters for
DNA complexes
Table S3. Mean values of the fitted thermodynamic
parameters derived from DC
P
¼ 0andDC
P
6¼ 0.
2830 P. Wu et al. (Eur. J. Biochem. 269) Ó FEBS 2002