Tài liệu Báo cáo Y học: The solution structure and activation of visual arrestin studied by small-angle X-ray scattering pot
Bạn đang xem bản rút gọn của tài liệu. Xem và tải ngay bản đầy đủ của tài liệu tại đây (445.53 KB, 9 trang )
The solution structure and activation of visual arrestin studied
by small-angle X-ray scattering
Brian H. Shilton
1
, J. Hugh McDowell
2
, W. Clay Smith
2
and Paul A. Hargrave
2,3
1
Department of Biochemistry, University of Western Ontario, London, Ontario, Canada;
2
Departments of Ophthalmology and
3
Biochemistry and Molecular Biology University of Florida, Gainesville, Florida, USA
Visual arrestin is converted from a ÔbasalÕ state to an
ÔactivatedÕ state by interaction with the phosphorylated
C-terminus of photoactivated rhodopsin (R*), but the
conformational changes in arrestin that lead to activation
are unknown. Small-angle X-ray scattering (SAXS) was
used to investigate the solution structure of arrestin and
characterize changes attendant upon activation. Wild-type
arrestin forms dimers with a dissociation constant of
60 l
M
. Small conformational changes, consistent with
local movements of loops or the mobile N- or C-termini
of arrestin, were observed in the presence of a phospho-
peptide corresponding to the C-terminus of rhodopsin,
and with an R175Q mutant. Because both the phospho-
peptide and the R175Q mutation promote binding to
unphosphorylated R*, we conclude that arrestin is acti-
vated by subtle conformational changes. Most of the
arrestin will be in a dimeric state in vivo.Usingthe
arrestin structure as a guide [Hirsch, J.A., Schubert, C.,
Gurevich, V.V. & Sigler, P.B. (1999) Cell 97, 257–269], we
have identified a model for the arrestin dimer that is
consistent with our SAXS data. In this model, dimeriza-
tion is mediated by the C-terminal domain of arrestin,
leaving the N-terminal domains free for interaction with
phosphorylated R*.
Keywords: visual arrestin; rhodopsin; G-protein coupled
receptor signalling; small-angle X-ray scattering; solution
structure.
The first event in the visual cycle is activation of rhodopsin
by light. Photoactivated rhodopsin (R*) initiates a signal
transduction cascade that culminates in membrane hyper-
polarization and the sensation of light (reviewed in [1]). The
sensitivity of the system requires that the signal transmitted
by R* be rapidly attenuated. This is accomplished by a two-
step process involving phosphorylation of the C-terminus of
R* and binding by arrestin. Phosphorylation somewhat
decreases the ability of R* to signal transducin. Rapid shut-
off of R* signalling is then accomplished by binding of
arrestin to photoactivated phosphorylated rhodopsin (R*P
[2–5]).
Arrestin plays a critical role in visual signalling by
completely blocking the ability of R*P to bind and activate
transducin. Arrestin is present in rod cells at high concen-
trations [6] and therefore a mechanism must exist that
prevents arrestin from inappropriately associating with R*.
In fact, arrestin shows very little propensity to bind to R*
until the C-terminal region of R* becomes phosphorylated.
Thus, the C-terminal peptide appears to act as a ÔswitchÕ
that, once phosphorylated, converts arrestin into a state that
is able to bind to R*. The effects of rhodopsin’s phospho-
rylated C-terminal peptide can be mimicked by a synthetic
phosphopeptide or even certain point mutations: both
wild-type arrestin in the presence of the synthetic phospho-
peptide [7], and arrestin-R175Q on its own [8] are able to
bind to unphosphorylated R* and abrogate signalling to
transducin.
The crystal structure of arrestin is known [9,10], but it
is not clear how binding of the phosphorylated C-terminal
peptide of rhodopsin promotes tight complex formation
between arrestin and R*. One possibility is that binding of
phosphopeptide leads to a conformational change in
arrestin that increases its affinity for R*. Conformational
changes in arrestin can take place in solution, as
demonstrated by changes in the proteolytic digestion
pattern that result from phosphopeptide binding [7] or by
heparin binding [11], and changes in cysteine reactivity
due to phosphopeptide binding or the activating R175Q
mutation [12]. The nature and extent of the conforma-
tional change that leads to activation of arrestin is not
known. The situation is complicated by the fact that
visual arrestin participates in a monomer–dimer equilib-
rium [13,14]. It has been suggested that the arrestin dimer
may function as an inert storage form of the protein,
which can be recruited by dissociation to terminate the
visual signal [14].
To characterize further the mechanism and nature of
arrestin’s activation, we conducted small-angle X-ray scat-
tering (SAXS) studies of arrestin in solution to measure
directly the quaternary structure and conformation of
arrestin, and changes associated with phosphopeptide
binding or the R175Q mutation. We demonstrate that the
conformation and oligomeric structure of arrestin are not
drastically altered by either phosphopeptide binding or by
the R175Q mutation. The arrestin dimer will probably be
Correspondence to B. H. Shilton, Department of Biochemistry, The
University of Western Ontario, London ON, N6A 5C1 Canada.
Fax: + 1 519 6613175, Tel: + 1 519 6614124,
E-mail:
Abbreviations: R*, photoactivated rhodopsin; R*P, phosphorylated
and photoactivated rhodopsin; R
g
, radius of gyration; S, momentum
transfer equal to 2sinh/L; SAXS, small-angle X-ray scattering.
Note: a web site is available at
(Received 24 January 2002, revised 19 June 2002,
accepted 25 June 2002)
Eur. J. Biochem. 269, 3801–3809 (2002) Ó FEBS 2002 doi:10.1046/j.1432-1033.2002.03071.x
the major species in vivo [14], and because the changes
attendant upon activation are relatively minor, it is
conceivable that the dimer plays an active role in binding
to R*. We have identified a model for the arrestin dimer in
solution that is consistent with our SAXS data; in this
model, dimerization is mediated by the C-terminal domains
of arrestin, leaving each of the N-terminal domains free to
interact with R*. This dimer could play an active role in
attenuation of R* signalling.
EXPERIMENTAL PROCEDURES
Protein expression and purification
Wild-type arrestin was prepared from bovine retina [7],
while arrestin R175Q was expressed from yeast cells and
purified as previously described [12]. In both cases, the
arrestin yielded a single band when analysed by SDS/
PAGE. Protein preparations were dialysed against 10 m
M
Hepes, 400 m
M
NaCl, pH 7.5, and concentrated to
approximately 0.13 m
M
by ultrafiltration; the ultrafiltrate
was retained and used for buffer subtraction during the
SAXS experiments. Following concentration, the protein
was flash frozen and maintained at )80 °C. When required,
additional concentration was carried out just prior to SAXS
measurements using 0.5 mL centrifugal ultrafilters (Milli-
pore Corp., Bedford, MA, USA).
Protein concentration
The concentration of BSA was measured using
A
280
(1%) ¼ 6.14, while the concentration of arrestin was
measured using A
278
(1%) ¼ 6.38 [15].
Preparation of the phosphopeptide
The peptides used correspond to residues 330–348 from
bovine rhodopsin, which comprises the carboxyl terminal
phosphorylation site (DDEASTTVSKTETSQVAPA).
Peptide synthesis, for both the unphosphorylated and
fully phosphorylated versions, has been described previ-
ously [7,16]. The lyophilized phosphopeptide was dis-
solved in 500 m
M
Hepes, pH 7.6, to yield a final pH that
was above 7. For arrestin in the concentration range of
30–150 l
M
(1.3–6.5 mgÆmL
)1
), 90 lL of arrestin solution
was mixed with 10 lLof10m
M
peptide solution to
yield a final peptide concentration of 1 m
M
. For higher
concentrations of arrestin a 130 m
M
solution of peptide
was used to yield a final peptide concentration of
13 m
M
.
SAXS measurements
All measurements were made at the European Molecular
Biology Laboratory Outstation at the Deutsches Elektro-
nen-Synchrotron (Hamburg, Germany), beamline X33
[17], at 15 °C using radiation with a wavelength of
0.15 nm. Measurements were made with either a position-
sensitive linear detector or a Quadrant segment-shaped
multiwire detector [18,19]. Sample–detector distances of
1.2 m (high angle) and 3 m (low angle) were used to cover
therangeofmomentumtransfer(S ¼ 2sinh/k,where2h
is the scattering angle) from 0.02 to 0.8 nm
)1
. Fifteen
successive 1-min exposures were recorded for each sample;
there was no evidence of protein degradation over this
time interval. Recording of each protein sample was
preceded and followed by recording from the buffer alone;
these buffer measurements were compared and provided a
check on beam properties and the cleanliness of the cell
between readings of protein solutions. Averaging of
frames, corrections for detector response and beam
intensity, and buffer subtraction, were performed using
the programs
SAPOKO
(Svergun, D.I. & Koch, M.H.J.,
unpublished material) and
OTOKO
[20]. Phosphopeptide
was added to the protein samples and matching buffer
just prior to measurement.
Determination of binding constants from forward
scattering
The intensity of Ôforward scatteringÕ,orI(0), is the X-ray
solution scattering that is parallel to the incident beam,
and was determined by extrapolation using Guinier curves
[21] or from the distance distribution function, P(r), as
evaluated by the indirect transform package GNOM
[22,23]. Because of the changing oligomeric state of
arrestin in these experiments, Guinier analysis was
preferred over the use of the distance distribution
function, which requires a prior estimation of the maximal
dimension.
The forward scattering is proportional to the product of
the molecular mass and concentration of the scattering
particle. For a mixture of particles, the total forward
scattering, I(0)
total
is equal to the sum of contributions from
individual species. Therefore, if I(0)
M
is the forward
scattering of monomeric arrestin, the forward scattering
from a mixture of monomers and dimers is:
Ið0Þ
Total
¼ f
M
Ið0Þ
M
þ 2f
D
Ið0Þ
M
ð1Þ
where f
M
and f
D
are the mass fractions of monomer and
dimer, respectively. Assuming that the monomer and dimer
are the only species present, the expression for total forward
scattering can be simplified as follows.
f
D
¼ 1 À f
M
Ið0Þ
Total
¼ð2 À f
M
ÞIð0Þ
M
ð2Þ
In the experiments, the total amount of protein is varied and
the forward scattering is measured. The dissociation con-
stant for dimerization, K
d
, is defined as:
K
d
¼
½M
2
½D
ð3Þ
where [M] and [D] are the molar concentrations of
monomer and dimer, respectively. The K
d
canalsobe
expressed in terms of the total mass concentration of
protein, [arrestin]
total
(in mgÆmL
)1
), the mass fraction of
monomer, f
M
, and the molecular mass of the monomer,
W
M
in Daltons, as follows:
K
D
¼
2f
2
M
½arrestin
Total
W
M
ð1 À f
M
Þ
ð4Þ
This expression for K
d
canbesolvedforthemassfractionof
monomer, f
M
, which can then be used in the expression for
I(0)
total
to yield the following equation:
3802 B. H. Shilton et al. (Eur. J. Biochem. 269) Ó FEBS 2002
Forward scattering, I(0)
total
, was plotted as a function of the
mass concentration of arrestin, [arrestin]
total
, and the curve
was fit to Eqn (5) using nonlinear regression as implemented
in the program
KALEIDAGRAPH
(v3.08, Synergy Software),
setting the molecular mass of the monomer equal to
45.3 kDa and the forward scattering of the monomer,
I(0)
M
to the appropriate value, as determined using a BSA
standard. The only variable fitted was the value for K
d
.
To account for the formation of large aggregates, a linear
term (k) was inserted into Eqn (5), to yield the following:
In this case, the values of both K
d
and k were varied to fit the
experimental data.
Radius of gyration, model fitting and analysis
For a mixture of monomeric and dimeric scattering species,
the radius of gyration is given by:
R
2
g
¼ f
M
R
2
gM
þ f
D
R
2
gD
ð7Þ
where f
M
and f
D
are the mass fractions of monomer and
dimer, respectively, and R
gM
and R
gD
are the radii of
gyration for the monomer and dimer, respectively.
Missing pieces of crystallographic models were built as
extended polypeptide using the program
O
[24]. Crystallo-
graphic models, which did not include crystallographic
water molecules, were fit to experimental SAXS data using
the program
CRYSOL
[25], with a solvent density of 0.36
electronsÆA
˚
)3
, using default limits for the contrast of the
hydration shell and average displaced solvent volume per
atomic group. The target function for
CRYSOL
is the v value,
which is a measure of the agreement between the theoretical
scattering from a model and the experimental data:
v
2
¼
1
N À 1
X
N
j¼1
IðS
j
ÞÀI
exp
ðS
j
Þ
rðS
j
Þ
2
ð8Þ
where for each momentum transfer value, S
j
, I(S
j
)isthe
theoretical scattering, I
exp
(S
j
) is the experimentally observed
scattering, and r(S
j
)istheerrorfortheexperimental
measurement.
RESULTS AND DISCUSSION
Arrestin participates in a monomer–dimer equilibrium
in solution
Dimers of arrestin have been detected by sedimentation
velocity [13] and sedimentation equilibrium [14]; in addition
to the dimer, an arrestin tetramer was taken to be the
predominant species when the protein was at high concen-
tration (220 l
M
or 10 mgÆmL
)1
), even though the tetramer
constituted only a minor component at 62 l
M
[14]. Our first
task in understanding the solution structure and activation
of visual arrestin was to ascertain its oligomeric state in our
preparations.
The X-ray solution scattering from particles at an angle
of 0° with respect to the direct beam, the Ôforward
scatteringÕ, is directly proportional to the molecular mass
of the scattering species. The forward scattering values for
various concentrations of wild-type arrestin were measured
by extrapolation of Guinier curves [21] to an S value of
0nm
)1
. With a 3-m sample–detector distance, useful data
began at an S value of 0.04 nm
)1
and the linear Guinier
region extended to approximately S ¼ 0.08 nm
)1
(Fig. 1).
Ið0Þ
Total
¼ Ið0Þ
M
2 þ
K
D
W
M
À
ffiffiffiffiffiffiffiffiffiffiffiffiffiffiffiffiffiffiffiffiffiffiffiffiffiffiffiffiffiffiffiffiffiffiffiffiffiffiffiffiffiffiffiffiffiffiffiffiffiffiffiffiffiffiffiffiffiffiffiffiffiffiffiffiffi
K
2
D
W
2
M
þ 8½arrestin
Total
K
D
W
M
q
4½arrestin
Total
0
@
1
A
ð5Þ
Ið0Þ
Total
¼ Ið0Þ
M
2 þ
K
D
W
M
À
ffiffiffiffiffiffiffiffiffiffiffiffiffiffiffiffiffiffiffiffiffiffiffiffiffiffiffiffiffiffiffiffiffiffiffiffiffiffiffiffiffiffiffiffiffiffiffiffiffiffiffiffiffiffiffiffiffiffiffiffiffiffiffiffiffi
K
2
D
W
2
M
þ 8½arrestin
Total
K
D
W
M
q
4½arrestin
Total
0
@
1
A
þ k½arrestin
ð6Þ
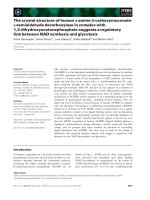
Fig. 1. Guinier plot of wild-type arrestin. (A) Small-angle X-ray scat-
tering from arrestin (110 l
M
)in10m
M
Hepes buffer, pH 7.5, con-
taining 400 m
M
NaCl, was measured using a 3-
M
sample to detector
distance. Complete scattering data are represented by a fine line con-
necting data points, while data used for the Guinier analysis are
highlighted as filled circles. For data analysis, Guinier curves (solid
straight line) were fitted to the data using weighted linear least squares
as implemented in the program
OTOKO
[20].(B)Identicalto(A),except
expandedintheregion0<S <0.09nm
)1
.
Ó FEBS 2002 Activation of visual arrestin (Eur. J. Biochem. 269) 3803
One preparation of wild-type arrestin, with a concentration
of 140 l
M
, was diluted with buffer to yield concentrations of
110, 86, 57 and 29 l
M
. These five points were plotted
(Fig. 2A, circles) and it was clear that there was a
concentration dependence for the I(0) values. The apparent
molecular masses at the different protein concentra-
tions were calculated based on a BSA standard, and ranged
from 50 to 80 kDa, consistent with a monomer–dimer
equilibrium.
We sought to characterize further the arrestin self-
association, and to this end measured SAXS from solutions
with concentrations of arrestin from 180 to 1300 l
M
(Fig. 2A, squares). Some of these data were recorded using
a 1.2 m sample–detector distance, and only the outer part of
the Guinier region (S values from 0.06 to 0.08 nm
)1
)was
available for the analysis. The increase of molecular mass in
response to increased protein concentration was much less
dramatic through this concentration range, progressing
from just over 80 kDa at 180 l
M
, to just under 100 kDa at
1300 l
M
.
A qualitative analysis of these data indicates that the
apparent molecular mass at low protein concentrations
approaches that of a monomer, and increases with protein
concentration to that of a dimer, with an equilibrium
dissociation constant, K
d
, of approximately 100 l
M
(corre-
sponding to 4–5 mgÆmL
)1
). In contrast to a previous study
[14], there does not seem to be a significant concentration of
tetrameric arrestin, even at very high protein concentrations.
The arrestin tetramer present in the asymmetric unit of both
crystal structures [9,10] has a radius of gyration of almost
4.3 nm, and would have a forward scattering approximately
twice as large as that observed by us. Neither of these
parameters are within the range of our experimental
observations, and therefore the predominant species in
solution are the monomer and dimer. Additional evidence
that the crystallographic tetramer is not a major species in
solution is provided by comparison of the theoretical
scattering from the crystallographic tetramer with our
experimental scattering (Fig. 2B), where it is quite clear that
the overall shape of the tetramer does not match what we
have observed in solution.
These data were fit to a simple model that incorporates a
monomer–dimer equilibrium, and relates the protein con-
centration to the forward scattering using the K
d
as the
single variable. Using this equation, it was found that the K
d
was 40 ± 20 l
M
. Other fits to the data were also tested. A
monomer–tetramer equilibrium was found to be incompat-
ible with the data because it requires a monomer molecular
mass of 30 kDa. Incorporation of a simple linear term in the
monomer–dimer model, with the slope of the line as a
second variable, results in a better overall fit to the data. In
this case, the K
d
of the monomer–dimer interaction
increases to 60 ± 25 l
M
. This linear term represents the
formation of high molecular mass, irreversible arrestin
aggregates, which have been observed in other studies
[14,26,27]. Because the forward scattering is directly pro-
portional to molecular mass, these high molecular mass
species comprise only a minor component of the mixture
and their effect is limited to the low angle Guinier region.
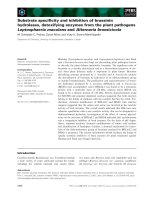
Fig. 2. Self-association of wild-type arrestin. (A) Guinier analysis was
used to calculate the I(0) value for arrestin solutions of varying con-
centrations. The sample–detector distance was 3 m for the concen-
trations from 1.3 to 260 l
M
(first seven points), allowing a momentum
transfer range of 0.04 < S <0.08nm
)1
for the Guinier curves. For
the concentrations of 310, 500 and 1300 l
M
(last three points), a 1.2-m
sample to detector distance was used, limiting the momentum transfer
range available for Guinier analysis to 0.06 < S < 0.08. Data points
obtained by dilution of a 140-l
M
stocksolutionareindicatedbycircles,
while those obtained by further concentration of the stock solution are
indicated by squares. All of the data points were fit to an equation that
describes a monomer–dimer equilibrium in terms of the I(0) value and
protein concentration, with the equilibrium dissociation constant, K
d
,
as the sole variable (curve, short dashes; Eqn 5). To account for the
formation of aggregates at higher protein concentrations, a linear term
(single variable) was incorporated into the binding equation (Eqn 6),
resulting in a better fit to the data (solid curve). The contribution from
this Ôlinear componentÕ is illustrated by the dashed line at the bottom of
the graph. (B) Calculated scattering from the crystallographic tetramer
does not agree with experimental solution scattering. Data collected at
two protein concentrations, 140 and 1300 l
M
, were merged to provide
a representative scattering curve (dots) that covers a broad range of
momentum transfer values. The structure of the crystallographic
tetramer [9,10] was used to calculate the theoretical solution scattering
for this particle (solid curve), which was fit to the experimental data
using the program
CRYSOL
[25].
3804 B. H. Shilton et al. (Eur. J. Biochem. 269) Ó FEBS 2002
Effect of rhodopsin C-terminal phosphopeptide
on arrestin conformation
Interaction between arrestin and the C-terminal phospho-
rylated peptide of rhodopsin leads to tight binding of
arrestin so that it is able to stop R* signalling [28]. It has
been shown that the phosphopeptide does not have to be
covalently bound to rhodopsin: a short, soluble phospho-
peptide corresponding to the C-terminus of rhodopsin is
sufficient to ÔactivateÕ arrestin and allow it to bind to
photoactivated but not phosphorylated rhodopsin [7].
Given the structure of arrestin, it is conceivable that binding
of the phosphopeptide could drive large conformational
changes, such as a reorientation of the N- and C-terminal
domains, that produce the dramatically increased affinity
for R*; on the other hand, binding of the phosphopeptide
may simply alter the surface features and cause relatively
minor conformational changes. To distinguish between
these two possibilities, we investigated the changes in
arrestin structure and conformation produced by rhodop-
sin’s C-terminal phosphopeptide.
We first wanted to determine whether the peptide had any
effect on the oligomeric state of arrestin. A peptide
concentration of 1 m
M
was chosen because this had been
shown previously to change the proteolytic digestion pattern
of arrestin in solution [7]. We compared arrestin solutions
with and without 1 m
M
phosphopeptide, at arrestin
concentrations ranging from 20 to 130 l
M
monomer
(1–6 mgÆmL
)1
), using the same protein preparation, buffer
composition, and SAXS camera settings. Under these
conditions, the phosphopeptide had a minor effect on
forward scattering at low arrestin concentrations (up to
66 l
M
), but no effect on arrestin from 66 to 130 l
M
(Fig. 3A). The phosphopeptide appears to produce a
small increase in the amount of dimer at low arrestin
concentrations, but has little effect at higher arrestin
concentrations.
To detect conformational changes in the arrestin mono-
mers and dimers at a fixed arrestin concentration, the entire
scattering curves for arrestin (110 l
M
) in the presence and
absence of phosphopeptide were compared (Fig. 3B), and it
can be seen that the scattering curves are identical out to an
S value of 0.2 nm
)1
. If the phosphopeptide caused a
reorientation of the N- and C-terminal domains, one would
expect to see a change in this scattering curve: the absence of
any such change indicates that the phosphopeptide has little
effect on the gross conformation of arrestin.
Because the effect of the phosphopeptide was not
detectable at low angles, additional measurements were
carried out at arrestin concentrations of 260 and 500 l
M
using a 1.2-m sample to detector distance to measure higher
angle scattering, which is sensitive to more subtle changes in
structure. The scattering in the presence and absence of
approximately 13 m
M
(33 mgÆmL
)1
) phosphopeptide was
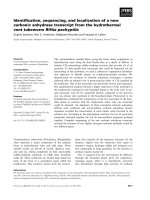
Fig. 3. Effect of phosphopeptide on arrestin. (A) Dependence of I(0) on
protein concentration for wild type arrestin in the presence (squares) or
absence (circles) of phosphopeptide (1 m
M
). (B) Comparison of low-
angle scattering from arrestin (110 l
M
) in the presence (solid curve) or
absence (dashed curve) of 1 m
M
phosphopeptide. (C) Comparison of
high-angle scattering from arrestin (500 l
M
) in the presence (solid
curve) or absence (dashed curve) of phosphopeptide (12 m
M
). To aid
visualization, curves were smoothed using a running five-point aver-
age. The difference between free arrestin and arrestin in the presence of
phosphopeptide is given at the top of the (B) and (C), expressed as a
percentage of the total signal from the detector.
Ó FEBS 2002 Activation of visual arrestin (Eur. J. Biochem. 269) 3805
compared. A very high concentration of peptide was used in
these measurements to ensure that the arrestin was fully
saturated. When the entire scattering curve for arrestin at
500 l
M
is inspected (Fig. 3C), it can be seen that there is no
observable difference produced by the phosphopeptide in
the S range from 0.07 to 0.2 nm
)1
. The phosphopeptide
does alter arrestin scattering at higher angles, particularly in
region 0.2 < S <0.4nm
)1
, where the two curves have
different shapes. At S values above 0.4 nm
)1
, the scattering
signal is not sufficiently strong to determine whether the
difference between the two curves is significant. The changes
in scattering at S values greater than 0.2 nm
)1
could be
produced by the presence of the phosphopeptide on the
surface of arrestin and/or by changes in ÔlocalÕ arrestin
structure. These results are consistent with a model where
binding of phosphopeptide causes a displacement of arres-
tin’s C-terminus [29] and/or changes in the conformation of
certain loops that facilitate R* binding [9].
The structure of arrestin R175Q resembles
that of wild-type arrestin
Replacement of arginine 175 with either glutamine or
glutamic acid produces a constitutively activated arrestin
molecule that binds photoactivated but unphosphorylated
rhodopsin [8,30]. We used SAXS to elucidate the structural
changes leading to activation of the R175Q mutant.
Increases in the concentration of arrestin R175Q produce
increases in forward scattering that are virtually identical to
those observed for wild-type arrestin (data not shown),
indicating that the R175Q mutation does not influence the
monomer–dimer equilibrium. Comparison of arrestin-
R175Q (110 l
M
) with the wild-type protein (130 l
M
)further
demonstrates that there is no change in low-angle scattering
due to the R175Q mutation (Fig. 4A). Thus, the R175Q
mutation does not affect the quaternary structure of arrestin,
nor does it cause a large conformational change in arrestin.
To define further any differences between wild-type and
R175Q arrestin, scattering was measured from more con-
centrated solutions (500 l
M
;Fig.4B):uptoanS value of
0.2 nm
)1
, X-ray scattering from the two proteins is identical,
but there are small differences in the curves between S values
of 0.2 and 0.4 nm
)1
(Fig. 4B), similar to what was observed
when phosphopeptide was bound to wild-type arrestin.
The effect of the R175Q mutation on the properties of
arrestin is consistent with the observed effect of the
phosphopeptide: both cause activation of arrestin but
produce very little change in arrestin’s solution structure
and conformation. In summary, the transition in arrestin
from a ÔbasalÕ state to an ÔactivatedÕ state that binds R* with
high affinity involves relatively subtle structural changes.
Models for the arrestin dimer in solution
Guinier curves provide the radius of gyration (R
g
), defined
as the root mean square distance of all atoms from their
common centre of mass. The R
g
canbeusedtoevaluatethe
overall shape of a scattering particle. The R
g
for a mixture of
scattering species depends on the R
g
for each species and
their mass fraction according to Eqn (7). The radius of
gyration of the monomer is 2.6 nm, determined using the
crystallographic coordinates [10]. The measured R
g
for wild-
type arrestin at 110 l
M
is 3.6 nm: at 110 l
M
the mass
fraction of monomer is 0.35, and therefore the R
g
for the
dimer is approximately 4.0 nm. Measurements at other
protein concentrations also indicated an R
g
for the dimer of
between 4.0 and 4.1. The dimer is therefore a highly
elongated molecule. The only way to make such an
elongated molecule from the monomeric species is to put
two monomers together such that their long axes are
arranged in tandem; that is, dimerization must be mediated
by either the N-terminal or C-terminal domain to yield a
dimer that is even more elongated than the monomer.
The dimer in solution may be contained in the crystal
structures of arrestin. Arrestin has been crystallized in two
different space groups: P2
1
2
1
2 [9] and C222
1
[10]. In both
cases, a tetramer of arrestin was present in the asymmetric
unit. Referring to the C222
1
structure, the four polypeptide
chains in each asymmetric unit have names A, B, C and D.
Fig. 4. Effect of R175Q mutation on arrestin. (A) Comparison of low-
angle scattering from arrestin R175Q (dashed curve) and wild-type
arrestin (solid curve), both at 110 l
M
. (B) Comparison of high-angle
scattering from arrestin R175Q (dashed curve) and wild-type arrestin
(solid curve), both at 500 l
M
. The curves in graphs A and B were
smoothed and difference curves plotted as in Fig. 3.
3806 B. H. Shilton et al. (Eur. J. Biochem. 269) Ó FEBS 2002
A twofold noncrystallographic symmetry axis runs through
the tetramer, which means that it can be viewed as a dimer
of dimers. The tetramer may be composed of either AB and
CD dimers, or AD and CB dimers. The AB dimer has a
radius of gyration of 4.0 nm, but has an extremely limited
contact area (less than 1000 A
˚
2
of buried surface), making it
an unlikely candidate for the solution dimer, as noted
previously [14]. The AD dimer is the most compact in the
crystal, with an R
g
of 3.4 nm, yielding a relatively poor fit to
the scattering data (not shown). On purely theoretical
grounds, it is unlikely that either the AB or AD dimers exist
to a significant degree in solution for the following reason:
these dimers participate in Ôheterologous associationÕ [31].
That is, they do not have inherent two-fold symmetry, the
surface used for the dimer interface is different for each
protomer. Such an arrangement is unlikely to result in the
formation of stable dimers as observed in solution; rather,
the formation of such dimers in solution would be expected
to progress to larger and larger polymers.
In the C222
1
structure, there are two other dimers formed
by crystallographic symmetry operations: one of these
consists of two A chains interacting through their C-termi-
nal domains (the ÔAAÕ dimer), while the other consists of a B
chain and D chain interacting through their N-terminal
domains (the ÔBDÕ dimer). These dimers possess twofold
symmetry, and have similar R
g
values of approximately
3.6 nm and 3.5 nm, respectively, making them reasonable
candidates for the solution dimer.
How well do the various molecular models agree with
solution scattering data? Low angle SAXS data collected at
140 l
M
arrestin were merged with high angle data collected
with 1300 l
M
arrestin; in this way, the entire scattering
curve could be used to evaluate models for the arrestin
dimers and other species. We tested the agreement of the
monomer, four dimers and tetramer against the merged
SAXS data and found that neither the monomer nor
tetramer yielded a reasonable fit to the data (Fig. 2B), in
agreement with the results from analysis of forward
scattering. Of the dimer models, the AA dimer yielded the
best fit, with the BD dimer a close second (data not shown).
The crystallographic models were missing regions of the
protein that were disordered: residues 1–9, 363–378, and
393–404. These disordered elements in the crystal structure
will also be disordered in solution, but they will contribute
to the solution X-ray scattering. These pieces were modelled
into the AA and BD dimers as extended polypeptide [26],
and produced an improvement in the fit of the AA model at
S values between 0.15 and 0.2 nm
)1
(Fig. 5A; v ¼ 3.2) but
only a slight improvement in the fit of the BD dimer model
(Fig. 5B; v ¼ 4.4). The agreement between the theoretical
scattering from the models and the experimental scattering
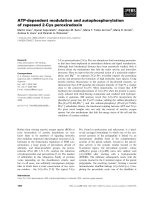
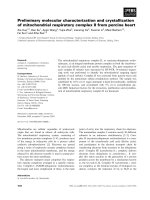
Fig. 5. Models of the arrestin dimer in solution. Models of the arrestin
dimer in solution. Structural models were constructed from dimers
present in the crystal structure of arrestin [10] using the macromolecular
modelling program
O
[24]. Approximately 3 kDa of polypeptide was
missing from the N-terminus, C-terminus and two internal loops of the
crystal structures; these missing pieces were modelled as extended
polypeptide to improve the agreement with experimental SAXS data
(dashed curves in both graphs). (A) Structure (ribbon diagram) and
predicted scattering (solid curve) of the ÔAAÕ dimer formed by interac-
tion between the C-terminal domains of arrestin monomers. (B)
Structure (ribbon diagram) and predicted scattering (solid curve) of the
ÔBDÕ dimer formed by interaction of N-terminal domains of arrestin
monomers. Ribbon diagrams were drawn using the Swiss PDB Viewer
[32]. (C) The agreement between theoretical and experimental scattering
curves is indicated by the square of the weighted residual (summed term
in Eqn 8) for each momentum transfer value; the solid line is for the AA
dimer, and the dashed line is for the BD dimer.
Ó FEBS 2002 Activation of visual arrestin (Eur. J. Biochem. 269) 3807
is indicated in Fig. 5(C), where the squared residuals are
plotted as a function of the momentum transfer: the AA
dimer has the best agreement in the lower angle region, up
to S ¼ 0.3 nm
)1
. Within the crystal structures of arrestin,
the AA dimer is the most likely candidate for the major
species in solution.
CONCLUSION
The activation of arrestin involves structural alterations that
promote a high–affinity interaction with photoactivated
rhodopsin (R*). Arrestin has been shown previously to
form dimers in solution [13,14], and activation of arrestin
could involve changes in the monomer–dimer equilibrium.
A perturbation in the equilibrium would result in significant
changes in the SAXS curve at a given protein concentration
(Fig. 6A), which we did not observe. A second possibility is
that the activation involves domain movements in either the
monomer, dimer, or both. For example, a 15° rotation of
the N-terminal domain relative to the C-terminal domain
results in a subtle alteration of the arrestin dimer (Fig. 6B)
which produces a small but detectable change in its solution
scattering (Fig. 6C). We did not observe such a change in
the solution structure of arrestin. We conclude that
activation of arrestin in solution involves small and localized
changes in conformation and no observable change in
oligomeric structure.
What is the biological role of the arrestin dimer? Studies
of arrestin binding to R*P in vitro are conducted with dilute,
monomeric arrestin, and therefore it is clear that the
monomer is sufficient for binding to R*P. This does not
preclude a biological role for the dimer. As noted by
Schubert et al. [14] the fraction of dimeric arrestin found
in vitro would be over 50% in the biologically relevant
concentration range, an estimate that is a lower limit in vivo
because of volume exclusion effects. Thus, dimeric arrestin
is likely the major species in vivo. It has been proposed that
the biological function of the arrestin dimer is to provide an
inert ÔstorageÕ form of the protein [14]; the implication is that
the dimer is not capable of binding to R*. However, the
ÔAAÕ dimer identified in this study has the intriguing
characteristic that the N-terminal domains are left open
and available for interaction with rhodopsin. In fact, the
structure of this dimer is such that both N-terminal domains
could conceivably interact with two rhodopsin molecules
simultaneously.
It may be that only monomeric arrestin is able to
effectively interact with R*P, and that the arrestin dimer is
a storage form of the protein [14]. An alternative possibility
raised by the present study is that dimeric arrestin has a
more active role in attenuation of rhodopsin signalling or
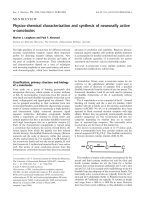
Fig. 6. Detection of structural changes in arrestin. To demonstrate
how changes in oligomeric structure and/or conformational would
affect scattering patterns, theoretical SAXS curves were calculated
from model structures derived from the high resolution crystal
structure of arrestin [10]. (A) The theoretical scattering from the
putative arrestin dimer (dotted curve; see Fig. 5A) is compared to that
of monomeric arrestin (solid curve). (B) The arrestin dimer (grey
backbone) is superimposed over a possible alternative conformation
(black backbone). In the alternative conformation, the N-terminal
domains of each monomer are rotated approximately 15° with respect
to the C-terminal domains; the overall effect is a slight ÔclosureÕ of the
arrestin dimer. (C) The theoretical scattering curves for the two
structures in (B) are compared: the dashed curve represents scattering
from the grey structure, while the solid curve represents scattering
from the black, structure. The difference between scattering from the
two structures is given in the top of the graph, expressed as a per-
centage of the total signal, as in Figs 3 and 4.
3808 B. H. Shilton et al. (Eur. J. Biochem. 269) Ó FEBS 2002
in postsignalling processes such as rhodopsin recycling.
The proposed structure for the arrestin dimer allows us to
design experiments to study the precise role of the
C-terminal domain and the biological function of the
arrestin dimer.
ACKNOWLEDGEMENTS
The assistance of Michel Koch at beamline X33 is gratefully
acknowledged. Supported by Canadian Institutes for Health Research
grant MT-15624 to BHS; and National Institutes of Health grants
EY06225, EY06226, and EY08571 to PAH and a departmental award
from Research to Prevent Blindness. PAH is a recipient of a Senior
Investigator Award and WCS is recipient of a Research Career
Development Award from Research to Prevent Blindness.
REFERENCES
1. Yau, K.W. (1994) Phototransduction mechanism in retinal rods
and cones. The Friedenwald Lecture. Invest. Ophthalmol. Vis. Sci.
35, 9–32.
2. Ku
¨
hn, H., Hall, S.W. & Wilden, U. (1984) Light-induced binding
of 48-kDa protein to photoreceptor membranes is highly
enhanced by phosphorylation of rhodopsin. FEBS Lett. 176, 473–
478.
3. Miller, J.L., Fox, D.A. & Litman, B.J. (1986) Amplification of
phosphodiesterase activation is greatly reduced by rhodopsin
phosphorylation. Biochemistry 25, 4983–4988.
4. Krupnick, J.G., Gurevich, V.V. & Benovic, J.L. (1997) Mechan-
ism of quenching of phototransduction. Binding competition
between arrestin and transducin for phosphorhodopsin. J. Biol.
Chem. 272, 18125–18131.
5. Gibson, S.K., Parkes, J.H. & Liebman, P.A. (2000) Phosphor-
ylation modulates the affinity of light-activated rhodopsin for G
protein and arrestin. Biochemistry 39, 5738–5749.
6. Hamm,H.E.&Bownds,M.D.(1986)Proteincomplementofrod
outer segments of frog retina. Biochemistry 25, 4512–4523.
7. Puig, J., Arendt, A., Tomson, F.L., Abdulaeva, G., Miller, R.,
Hargrave, P.A. & McDowell, J.H. (1995) Synthetic phosphopep-
tide from rhodopsin sequence induces retinal arrestin binding to
photoactivated unphosphorylated rhodopsin. FEBS Lett. 362,
185–188.
8. Gray-Keller, M.P., Detwiler, P.B., Benovic, J.L. & Gurevich, V.V.
(1997) Arrestin with a single amino acid substitution quenches
light-activated rhodopsin in a phosphorylation-independent
fashion. Biochemistry 36, 7058–7063.
9. Granzin,J.,Wilden,U.,Choe,H.W.,Labahn,J.,Krafft,B.&
Bu
¨
ldt, G. (1998) X-ray crystal structure of arrestin from bovine
rod outer segments. Nature 391, 918–921.
10. Hirsch, J.A., Schubert, C., Gurevich, V.V. & Sigler, P.B. (1999)
The 2.8 A
˚
crystal structure of visual arrestin: a model for arrestin’s
regulation. Cell 97, 257–269.
11. Palczewski, K., Pulvermuller, A., Buczylko, J. & Hofmann, K.P.
(1991) Phosphorylated rhodopsin and heparin induce similar
conformational changes in arrestin. J. Biol. Chem. 266, 18649–
18654.
12. McDowell, J.H., Smith, W.C., Miller, R.L., Popp, M.P., Arendt,
A., Abdulaeva, G. & Hargrave, P.A. (1999) Sulfhydryl reactivity
demonstrates different conformational states for arrestin, arrestin
activated by a synthetic phosphopeptide, and constitutively active
arrestin. Biochemistry 38, 6119–6125.
13. Wacker, W.B., Donoso, L.A., Kalsow, C.M., Yankeelov, J.A.
Jr & Organisciak, D.T. (1977) Experimental allergic uveitis.
Isolation, characterization, and localization of a soluble uveito-
pathogenic antigen from bovine retina. J. Immunol. 119, 1949–
1958.
14. Schubert, C., Hirsch, J.A., Gurevich, V.V., Engelman, D.M.,
Sigler, P.B. & Fleming, K.G. (1999) Visual arrestin activity may be
regulated by self association. J. Biol. Chem. 274, 21186–21190.
15. Buczylko, J. & Palczewski, K. (1993) Purification of arrestin from
bovine retinas. Methods Neurosci. 15, 226–236.
16. Arendt, A., Palczewski, K., Moore, W.T., Caprioli, R.M.,
McDowell, J.H. & Hargrave, P.A. (1989) Synthesis of phospho-
peptides containing O-phosphoserine or O-phosphothreonine. Int.
J. Pept. Protein Res. 33, 468–476.
17. Koch, M.H.J. & Bordas, J. (1983) X-ray diffraction and scattering
on disordered systems using synchrotron radiation. Nucl. Instrum.
Methods 208, 461–469.
18. Gabriel,A.&Dauvergne,F.(1982)Thelocalisationmethodused
at EMBL. Nucl. Instrum. Methods 201, 223–224.
19. Boulin, C.J., Kempf, R., Gabriel, A. & Koch, M.H.J. (1988) Data
acquisition systems for linear and area X-ray detectors using delay
line readout. Nucl. Instrum. Methods A269, 312–320.
20. Boulin, C., Kempf, R., Koch, M.H.J. & McLaughlin, S. (1986)
Data appraisal, evaluations and display for synchrotron radiation
experiments: hardware and software. Nucl. Instrum. Methods
A249, 399–407.
21. Guinier, A. & Fournet, G. (1955) Small Angle Scattering of
X-rays. Wiley, New York.
22. Svergun, D.I., Semenyuk, A.V. & Feigin, L.A. (1988) Small-angle
scattering data treatment by the regularization method. Acta
Cryst. A44, 244–250.
23. Svergun, D.I. (1992) Determination of the regularization param-
eter in indirect-transform methods using perceptual criteria.
J. Appl. Cryst. 25, 495–503.
24. Jones, T.A., Bergdoll, M. & Kjeldgaard, M. (1990) O: a macro-
molecular modeling environment. In Crystallographic and Mod-
eling Methods in Molecular Design (Bugg,C.&Ealick,S.E.,eds),
pp. 189–195. Springer-Verlag, New York.
25. Svergun, D.I., Barberato, C. & Koch, M.H.J. (1995) CRYSOL – a
program to evaluate X-ray solution scattering of biological
macromolecules from atomic coordinates. J. App. Cryst. 28,
768–773.
26. Palczewski, K., Riazance-Lawrence, J.H. & Johnson, W.C. Jr
(1992) Structural properties of arrestin studied by chemical mod-
ification and circular dichroism. Biochemistry 31, 3902–3906.
27. Kotake, S., Hey, P., Mirmira, R.G. & Copeland, R.A. (1991)
Physicochemical characterization of bovine retinal arrestin. Arch.
Biochem. Biophys. 285, 126–133.
28. Wilden, U., Hall, S.W. & Ku
¨
hn, H. (1986) Phosphodiesterase
activation by photoexcited rhodopsin is quenched when rhodopsin
is phosphorylated and binds the intrinsic 48-kDa protein of rod
outer segments. Proc. Natl Acad. Sci. USA 83, 1174–1178.
29.Palczewski,K.,Buczylko,J.,Imami,N.R.,McDowell,J.H.&
Hargrave, P.A. (1991) Role of the carboxyl-terminal region of
arrestin in binding to phosphorylated rhodopsin. J. Biol. Chem.
266, 15334–15339.
30. Gurevich, V.V., Dion, S.B., Onorato, J.J., Ptasienski, J., Kim,
C.M., Sterne-Marr, R., Hosey, M.M. & Benovic, J.L. (1995)
Arrestin interactions with G protein-coupled receptors. Direct
binding studies of wild type and mutant arrestins with rhodopsin,
beta 2-adrenergic, and m2 muscarinic cholinergic receptors. J. Biol.
Chem. 270, 720–731.
31. Monod, J., Wyman, J. & Changeaux, J P. (1965) On the nature of
allosteric transitions: a plausible model. J. Mol. Biol. 12, 88–118.
32. Guex, N. & Peitsch, M.C. (1997) Swiss-model and the Swiss-
PdbViewer: An environment for comparative protein modeling.
Electrophoresis 18, 2714–2723.
33. Palczewski, K., Kumasaka, T., Hori, T., Behnke, C.A.,
Motoshima, H., Fox, B.A., Le Trong, I., Teller, D.C., Okada, T.,
Stenkamp, R.E., Yamamoto, M. & Miyano, M. (2000) Crystal
structure of rhodopsin: a G protein-coupled receptor. Science 289,
739–745.
Ó FEBS 2002 Activation of visual arrestin (Eur. J. Biochem. 269) 3809