Tài liệu Báo cáo Y học: Dissecting the effect of trifluoroethanol on ribonuclease A Subtle structural changes detected by nonspecific proteases ppt
Bạn đang xem bản rút gọn của tài liệu. Xem và tải ngay bản đầy đủ của tài liệu tại đây (289.26 KB, 7 trang )
Dissecting the effect of trifluoroethanol on ribonuclease A
Subtle structural changes detected by nonspecific proteases
Jens Ko¨ ditz, Ulrich Arnold and Renate Ulbrich-Hofmann
Department of Biochemistry/Biotechnology, Martin-Luther University Halle-Wittenberg, Halle, Germany
With the aim to distinguish between local and global
conformational changes induced by trifluoroethanol in
RNase A, spectroscopic and activity measurements in
combination with proteolysis by unspecific proteases have
been exploited for probing structural transitions of RNase A
as a function of trifluoroethanol concentration. At > 30%
(v/v) trifluoroethanol (pH 8.0; 25 °C), circular dichroism
and fluorescence spectroscopy indicate a cooperative col-
lapse of the tertiary structure of RNase A coinciding with
the loss of its enzymatic activity. In contrast to the dena-
turation by guanidine hydrochloride, urea or temperature,
the breakdown of the tertiary structure in trifluoroethanol is
accompanied by an induction of secondary structure as
detected by far-UV circular dichroism spectroscopy. Prote-
olysis with the nonspecific proteases subtilisin Carlsberg or
proteinase K, both of which attack native RNase A at the
Ala20-Ser21 peptide bond, yields refined information on
conformational changes, particularly in the pretransition
region. While trifluoroethanol at concentrations > 40%
results in a strong increase of the rate of proteolysis and new
primary cleavage sites (Tyr76-Ser77, Met79-Ser80) were
identified, the rate of proteolysis at trifluoroethanol con-
centrations < 40% (v/v) is much smaller (up to two orders of
magnitude) than that of the native RNase A. The proteolysis
data point to a decreased flexibility in the surrounding of the
Ala20-Ser21 peptide bond, which we attribute to subtle
conformational changes of the ribonuclease A molecule.
These changes, however, are too marginal to alter the overall
catalytic and spectroscopic properties of ribonuclease A.
Keywords: ribonuclease A; trifluoroethanol; unfolding;
proteolysis: spectroscopy.
The application of organic solvents in enzymatically cata-
lyzed reactions has gained increasing importance [1,2].
Unfortunately, most of these solvents act as a denaturant.
Like conventional denaturants such as guanidine hydro-
chloride (GdnHCl), urea or elevated temperatures, they
destroy the tertiary structure of proteins which results in the
loss of enzymatic activity. Regarding the secondary struc-
ture of proteins, however, organic solvents generally differ
from the aforementioned denaturants. Elements of the
secondary structure, especially helices, were found to be
stabilized [3], induced [4,5] or re-arranged [6,7]. Therefore,
organic solvents, mainly halogenated alcohols, have also
come into focus in connection with membrane mimetics
[8,9], folding assistance [10] and aggregation processes [11],
being important for prion proteins or Alzheimer’s
b-amyloid peptide [12].
Trifluoroethanol has been established as a model
solvent with which to investigate structural changes in
protein molecules under the influence of water-miscible
organic solvents (reviewed in [13]). The reasons for its
ability to propagate secondary structure, the replacement
of water molecules bound to the peptide backbone by
trifluoroethanol molecules, the proton donator/acceptor
properties of the trifluoroethanol molecule for hydrogen
bonds and the influence of trifluoroethanol on the
dielectric constant of the medium, have been discussed
[14]. For model peptides [3] and unfolded proteins such as
disulfide reduced hen lysozyme [15], b-lactoglobulin A [6]
or RNase A [16], intense helix formation was found even
at low concentrations of trifluoroethanol. For folded
proteins, however, an appreciable effect on the tertiary
and secondary structure was found only at higher
concentrations of the solvent [13]. At low concentrations
of trifluoroethanol, the propagation of helical structures
seems to be hampered by the still intact tertiary structure.
Only after disrupting the tertiary structure of the protein,
trifluoroethanol is presumed to be able to induce helical
structures due to Ôthe need to overcome the global stability
ofthenativefoldÕ [13]. Despite obstructions by the still-
intact tertiary structure, however, subtle changes of the
secondary structure elements are conceivable even in the
pretransition region of global unfolding. Such small con-
formational changes will not be detectable in spectroscopic
equilibrium studies. Proteolysis, however, has proven to be
a valuable probe for detecting local conformational chang-
es if they are adjacent to a potential cleavage site [17]. The
local accessibility and flexibility of the peptide bond is the
crucial prerequisite for a successful proteolytic attack [18].
Changes in the proteolytic susceptibility of a protein
therefore yield information on structural changes at the
Correspondence to R. Ulbrich-Hofmann, Martin-Luther University
Halle-Wittenberg, Department of Biochemistry/Biotechnology,
Kurt-Mothes-Str. 3, D-06120 Halle, Federal Republic of Germany.
Fax: +49 3455527303. Tel: +49 3455524865,
E-mail:
Abbreviations: GdnHCl, guanidine hydrochloride; RNase A,
ribonuclease A; cCMP, cytidine 2¢-3¢-cytidine monophosphate.
Enzymes: proteinase K (EC 3.4.21.64); ribonuclease A (EC 3.1.27.5);
subtilisin Carlsberg (EC 3.4.21.62).
Note: a web site is available at />biotech/index.html
(Received 7 March 2002, revised 6 June 2002, accepted 25 June 2002)
Eur. J. Biochem. 269, 3831–3837 (2002) Ó FEBS 2002 doi:10.1046/j.1432-1033.2002.03079.x
respective cleavage sites [19,20]. In the present paper, we
have exploited limited proteolysis with subtilisin Carlsberg
and proteinase K completed by spectroscopy and activity
measurements to investigate the conformational changes
of RNase A (EC 3.1.27.5) under the influence of triflu-
oroethanol. Both proteases are able to degrade RNase A
under native conditions [21–23]. With the addition of
trifluoroethanol, the susceptibility of RNase A to both
proteases changes considerably. Whilst global conforma-
tional changes of RNase A could also be disclosed by
spectroscopy, proteolysis allowed detection of subtle local
conformational changes in the pretransition region of
global unfolding.
MATERIALS AND METHODS
Materials
RNase A from Sigma was purified to homogeneity on a
MONO S FPLC column (Pharmacia). Subtilisin Carlsberg,
proteinase K, cytochrome c (horse heart), soybean trypsin
inhibitor and bovine pancreatic trypsin inhibitor were
purchased from Sigma and used without further purifica-
tion. Trifluoroethanol and cytidine 2¢:3¢-cyclic monophos-
phate (cCMP) were from Fluka, phenylmethanesulfonyl
fluoride was from Merck, and N-succinyl-Ala-Ala-Ala-
p-nitroanilide from Bachem. All other chemicals were the
purest ones commercially available.
Determination of RNase A concentration
The protein concentration of RNase A stock solution
was determined by using the molar absorption coefficient
e ¼ 9800
M
)1
Æcm
)1
at 278 nm [24].
Spectroscopy and determination of the transition curve
CD spectroscopy was carried out on a 62-A DS CD
spectrophotometer (Aviv) at 25 °C. Samples were prepared
in 50 m
M
Tris/HCl buffer, pH 8.0, containing 0–70% (v/v)
trifluoroethanol. CD spectra were recorded at an RNase A
concentration of 2 mgÆmL
)1
using a quartz cuvette of
0.1 mm path length or 0.5 mgÆmL
)1
using a quartz cuvette
of 1 cm path length in the far-UV (200–260 nm) and in the
near-UV region (250–340 nm), respectively.
Fluorescence spectroscopy was carried out on a Fluoro-
Max-2 spectrometer (Yvon-Spex) at 25 °Cusingacuvette
of 1 cm path length. The slit width was 1 nm for excitation
at 278 nm and 10 nm for emission. Fluorescence spectra
were recorded from 290 to 350 nm with a step width of
1 nm. Integration time at each wavelength was 0.5 s. Ten
single spectra were averaged. The RNase A samples were
100 lgÆmL
)1
in 50 m
M
Tris/HCl buffer, pH 8.0, containing
0–70% (v/v) trifluoroethanol. For the transition curve, the
fluorescence signal was recorded at 303 nm and averaged
over 200 s. RNase A samples were 130 lgÆmL
)1
in 50 m
M
Tris/HCl buffer, pH 8.0, containing 0–64% (v/v) trifluoro-
ethanol.
The fluorescence signals at 303 nm and the CD signals
at 278 nm were fitted to a two-state model according
to Pace et al. [25] by nonlinear regression. The fraction
of native protein (f
N
) was calculated from the fitted
signals.
RNase A activity assay
RNase A activity was determined at 25 °CwithcCMPas
substrate. Assay mixtures were composed of 50 m
M
Tris/HCl buffer, pH 8.0, trifluoroethanol (0–50%, v/v),
cCMP (7 m
M
) and RNase A (20–100 lgÆmL
)1
). The reac-
tion was followed at 286 nm in a quartz cuvette of 0.1 cm
path length. Initial velocities were calculated from the linear
increase of absorbance. Each value given in Fig. 4 is the
average of three independent measurements ± SD.
Proteinase K activity assay
Proteinase K activity was determined at 25 °Cwith
N-succinyl-Ala-Ala-Ala-p-nitroanilide as substrate [26].
Assay mixtures were composed of 50 m
M
Tris/HCl buffer,
pH 8.0, CaCl
2
(1 m
M
), trifluoroethanol (0–60%, v/v),
N-succinyl-Ala-Ala-Ala-p-nitroanilide (1 m
M
) and protein-
ase K (2.5–20 lgÆmL
)1
). The reaction was followed at
410 nm in a cuvette of 1 cm path length. Initial velocities
were calculated from the linear increase of absorbance. Each
value given in Fig. 1 is the average of three independent
measurements ± SD.
Trifluoroethanol-induced denaturation and proteolysis
Limited proteolysis of RNase A was performed in 50 m
M
Tris/HCl buffer, pH 8.0, containing CaCl
2
(1 m
M
)and
trifluoroethanol (0–60%, v/v) at 25 °C. To 160 lLofthis
solution were added 20 lL of protease solution [subtilisin
Carlsberg (40 lgÆmL
)1
) or proteinase K (0.02–10 mgÆmL
)1
)
in 50 m
M
Tris/HCl buffer, pH 8.0, containing 10 m
M
CaCl
2
]and20lLRNaseA(2mgÆmL
)1
in 50 m
M
Tris/
HCl buffer, pH 8.0). After defined time intervals, samples of
10 lL were rapidly removed, mixed with 13 lLofa
stopping solution (1 mL of 50 m
M
phenylmethanesulfonyl
fluoride in 2-propanol and 300 lL0.1
M
HCl), and heated
at 95 °C for 10 min. After cooling, the samples were
neutralized by addition of 3 lL0.1
M
NaOH.
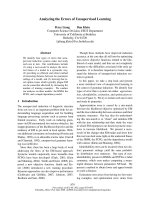
Fig. 1. Activity of proteinase K as a function of the concentration
of trifluoroethanol. Activity of proteinase K was determined with
N-succinyl-Ala-Ala-Ala-p-nitroanilide as substrate at 25 °Cas
described in Materials and methods.
3832 J. Ko
¨
ditz et al. (Eur. J. Biochem. 269) Ó FEBS 2002
RP-HPLC of the proteolytic fragments
Reduction of the disulfide bonds was performed in 50 m
M
Tris/HCl buffer, pH 8.0, containing 1,4-dithiothreitol
(10 m
M
) and GdnHCl (5
M
) for 2 h. Afterwards, the SH
groups were carbamidomethylated by treatment with
100 m
M
iodoacetamide for 15 min. Both reactions were
performed in the dark under nitrogen at room temperature.
Protein fragments were separated on an inert HPLC system
(Merck-Hitachi) using a C
8
reverse-phase column (Vydac).
The solvent gradient was produced from degassed HPLC-
grade water containing 0.07% trifluoroacetic acid and
degassed acetonitrile containing 0.056% trifluoroacetic acid.
The flow rate was 1.0 mLÆmin
)1
. Absorbance was followed
at 214 nm and fractions for protein sequencing and
MALDI-MS were collected manually.
MALDI-MS and N-terminal protein sequencing
MALDI-MS was carried out as described previously [27] on
a reflectron-type time-of-flight mass spectrometer Reflex
TM
(Bruker-Franzen, Bremen, Germany). Amino acid
sequences were determined using the protein sequencer
476 A (Applied Biosystems, Foster City, CA, USA)
according to the manufacturer’s instructions.
Electrophoresis and densitometric evaluation
Electrophoresis was carried out under reducing conditions
on a Midget electrophoresis unit (Hoefer) according to
Scha
¨
gger & von Jagow [28] but using 10% and 18% (w/v)
acrylamide for sampling and separation gels without spacer
gel. Silver staining of the SDS/PAGE gels was performed
according to Blum et al. [29]. For densitometric evaluation
of the band of intact RNase A, the SDS/PAGE gels were
stained with Coomassie brilliant blue G 250 and scanned at
595 nm using a CD 60 densitometer (Desaga).
Rate constants of proteolysis and relative proteolytic
susceptibility
The rate constants of proteolysis (k
p
)werecalculatedfrom
the time-dependent decrease of the peak areas of intact
RNase A in the scanned SDS/PAGE gels, which followed a
first-order reaction. Due to the wide range of k
p
values it
was not possible to determine k
p
at a constant concentration
of proteinase K for all concentrations of trifluoroethanol.
Therefore, k
p
was determined as a function of the concen-
tration of proteinase K for each concentration of trifluoro-
ethanol (see ÔTrifluoroethanol-induced denaturation and
proteolysisÕ). The k
p
values were found to increase linearly
with the increase of the protease concentration. The slopes
of these linear functions (k
p
vs. proteinase K concentration)
were corrected by the proteinase K activity for each
trifluoroethanol concentration (Fig. 1) to eliminate the
influence of changes of the protease activity on k
p
.The
relative proteolytic susceptibility given in Fig. 4 was
obtained by relating these values to the value determined
for 0% trifluoroethanol.
Analytical ultracentrifugation
Analytical ultracentrifugation was carried out on a Beck-
man Optima XL-A ultracentrifuge at 20 °C according to
the manufacturer’s instructions. Protein concentration was
adjusted to 0.7 mgÆmL
)1
in 20 m
M
Tris/HCl buffer, pH 8.0,
containing 0 or 20% trifluoroethanol, respectively.
RESULTS
Spectroscopy
To dissect changes of the secondary and tertiary structure of
RNase A in the presence of trifluoroethanol, CD spectra in
the near- and far-UV regions were recorded at trifluoro-
ethanol concentrations of between 0 and 70% (Fig. 2). In
the near-UV region, characterizing the tertiary structure, no
noticeable changes were observed at concentrations of up to
30% trifluoroethanol. Above 30% trifluoroethanol, the
spectra revealed that the tertiary structure was increasingly
disturbed. At 50% trifluoroethanol, the tertiary structure
was fully disrupted, and the CD signal remained unchanged
at even higher trifluoroethanol concentrations (Fig. 2A).
From the respective CD signals at 278 nm a transition curve
was constructed (Fig. 4). As an alternative approach to
detect changes of the tertiary structure, we recorded
fluorescence spectra of RNase A in 0–70% (v/v) trifluoro-
ethanol (Fig. 3). Both the slight shift of the emission
maximum to a shorter wavelength and the strong increase
of the fluorescence signal indicate changes of the tertiary
structure of the RNase A molecule. Furthermore, fluores-
cence emission of RNase A at 303 nm was followed as a
Fig. 2. Near-UV (A) and far-UV (B) CD
spectra of RNase A in trifluoroethanol.
RNase A was dissolved in 50 m
M
Tris/HCl,
pH 8.0, in the absence of trifluoroethanol and
in the presence of 30, 40, 45, 50 and 70% (v/v)
trifluoroethanol. CD spectra were recorded
as described in Materials and methods.
Ó FEBS 2002 Proteolysis of RNase A in trifluoroethanol (Eur. J. Biochem. 269) 3833
function of the concentration of trifluoroethanol. The
respective transition curve coincides with that obtained
from CD measurements (Fig. 4).
As found for near-UV CD spectra, no changes were
detected in the far-UV CD spectra for concentrations up to
30% trifluoroethanol. Above 30% trifluoroethanol, an
increase of the negative ellipticity in the far-UV region
indicates the induction of additional secondary structure
(mainly helical structures) (Fig. 2B). However, no pro-
nounced transition could be detected and the process was
not completed at 70% trifluoroethanol.
To gain insight into the changes detected by proteolysis
(see below), we investigated RNase A in the absence and
presence of 20% trifluoroethanol by NOESY and TOCSY
NMR spectroscopy. However, due to the high pH value
(8.0) and the high flexibility of the loop region of interest
(around Ala20) the signal was very weak and no assignment
to the protein sequence was possible.
RNase A activity
To determine whether the differences in the changes of the
tertiary and secondary structures are reflected in the activity
of RNase A, its activity towards cCMP was measured as a
function of the concentration of trifluoroethanol (Fig. 4).
While the decrease of RNase A activity above 30%
trifluoroethanol coincides with the disruption of the tertiary
structure, a slight activation of RNase A was observed at
low concentrations of trifluoroethanol.
Proteolytic susceptibility of RNase A
Fragmentation of RNase A by proteinase K and subtilisin
Carlsberg. The proteolytic susceptibility of RNase A to
proteinase K and subtilisin Carlsberg as a function of the
concentration of trifluoroethanol was analysed by SDS/
PAGE. In Fig. 5, typical proteolytic fragment patterns of
RNase A emerging in 0, 20 and 40% trifluoroethanol (v/v)
as a function of time are shown. Under native conditions,
proteinase K and subtilisin Carlsberg efficiently cleave
RNase A at the peptide bond Ala20-Ser21 [21,22] yielding
the so-called RNase S. The large fragment of RNase S
(residues 21–124), called S-protein, is visible in the SDS/
PAGE gel (Fig. 5B). Surprisingly, in 20% trifluoroethanol
no fragmentation of RNase A by both proteases was
observed (Fig. 5C), whereas in 40% trifluoroethanol, again
a degradation of RNase A was detected (Fig. 5D). In
contrast to native conditions where only the S-protein was
observed, various fragments were found in 40% trifluoro-
ethanol. The same trend of proteolytic susceptibility of
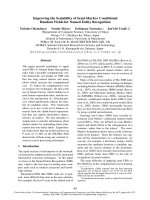
Fig. 4. Conformational changes of RNase A as a function of trifluoro-
ethanol concentration followed by fluorescence and CD spectroscopy,
activity measurements and proteolysis. f
N
represents the fraction of
native protein as determined by fluorescence spectroscopy at 303 nm
(s)orbyCDspectroscopyat278nm(d)at25°C. Residual activity
of RNase A (n) was determined with cCMP as substrate. The relative
proteolytic susceptibility of RNase A towards proteinase K (h)was
obtained from first-order rate constants of proteolysis (k
p
) as described
in Materials and methods.
Fig. 3. Fluorescence spectra of RNase A in trifluoroethanol. RNase A
was dissolved in 50 m
M
Tris/HCl, pH 8.0, in the absence of
trifluoroethanol and in the presence of 20, 35, 40, 50 and 70% (v/v)
trifluoroethanol. Fluorescence spectra were recorded as described in
Materials and methods.
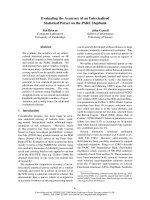
Fig. 5. Time course of the proteolytic degradation of RNase A by
subtilisin Carlsberg (upper panel) and proteinase K (lower panel) in
trifluoroethanol. RNase A was incubated in the presence of subtilisin
Carlsberg or proteinase K at a ratio of 50 : 1 (w/w) in (B) 0% (C) 20%,
and (D) 40% trifluoroethanol (v/v) at 25 °C. The reaction was stopped
after30s,10min,30min,1h,2hand6h(fromlefttorightineach
SDS/PAGE gel). Lane (A) shows the reference proteins soybean
trypsin inhibitor (21 kDa), cytochrome c (12.4 kDa) and bovine
pancreatic trypsin inhibitor (6.5 kDa).
3834 J. Ko
¨
ditz et al. (Eur. J. Biochem. 269) Ó FEBS 2002
RNase A was found with elastase (results not shown) but
due to the low stability of elastase in higher concentrations
of trifluoroethanol, we did not investigate further with this
protease.
To characterize the fragments of RNase A observed after
proteolysis at higher concentrations of trifluoroethanol
(40%), samples were analysed by RP-HPLC, MALDI-MS
and N-terminal protein sequencing. A typical RP-HPLC
chromatogram for the proteolytic digestion of RNase A by
subtilisin Carlsberg is shown in Fig. 6. The results for
subtilisin and proteinase K are summarized in Table 1. For
both proteases the same four fragments could be found: the
N-terminal fragments 1–76 and 1–79 and the complemen-
tary C-terminal fragments 77–124 and 80–124. Thus, the
peptide bonds 76–77 and 79–80 of RNase A were identified
as cleavage sites which become first accessible under
denaturation by trifluoroethanol (Ôprimary cleavage sitesÕ).
Due to the low concentration, the fragment with the highest
molecular mass in Fig. 5D, upper panel, could not be
characterized. According to its behaviour in electrophoresis,
it probably represents fragment 21–124, as in Fig. 5A.
Quantification of the proteolytic susceptibility of
RNase A. To gain further insight into the changes of the
proteolytic susceptibility of RNase A as a function of
trifluoroethanol concentration, the proteolytic degradation
by proteinase K was quantified at 0–60% trifluoroethanol.
From the decrease of the RNase A band in SDS/PAGE gels
as a function of time, rate constants of proteolysis were
determined, converted into the (protease-concentration
independent) proteolytic susceptibility, and corrected for
differences in proteolytic activity as described in Materials
and methods. Figure 4 demonstrates that differences in the
proteolytic susceptibility range three orders of magnitude
with k
p
under native conditions being (9.7 ± 0.7) · 10
)3
s
)1
(at 100 lgÆmL
)1
proteinase K). While above 30% triflu-
oroethanol the proteolytic susceptibility of RNase A
strongly increases, which coincides with the disruption of
the tertiary structure of the RNase A molecule, in 20%
trifluoroethanol the proteolytic susceptibility is reduced by
two orders of magnitude (Fig. 4).
To test whether aggregation of RNase A in 20%
trifluoroethanol is the reason for the decrease of k
p
,we
applied respective samples to ultracentrifugation (not
shown). The results unambiguously confirm that RNase A
solely exists as soluble monomer under these conditions.
DISCUSSION
Whilst global unfolding significantly changes the spectro-
scopic properties of a protein, the detection of subtle
conformational changes of the protein structure, which can
already occur clearly before global unfolding, is more
challenging. In this paper we investigated the influence of
trifluoroethanol on the conformation of RNase A with
particular consideration of the pretransition region of global
unfolding.
In correspondence to reports by other authors [16,30,31],
CD spectra in the near-UV region, as well as fluorescence
signals, unveil the disruption of the tertiary structure of
RNase A in > 30% trifluoroethanol. CD spectra in the
far-UV region, on the other hand, indicate a detectable
increase in the content of secondary structure only after the
disruption of the native tertiary structure of RNase A
(Figs 2–4). Interestingly, the preservation of the tertiary
structure coincides with the activity profile of RNase A
(Fig. 4). This behaviour differs from that reported for the
denaturation by GdnHCl or temperature [20], where the
decrease of the activity of RNase A precedes the disruption
of the tertiary structure. Apart from a slight activation, an
effect which was also reported for other enzymes in the
presence of various solvents [32], low concentrations of
Fig. 6. RP-HPLC separation of RNase A fragments. RNase A was
treated with subtilisin (50 : 1, w/w) in 50% trifluoroethanol at 25 °C
for 2 h and subsequently treated as described in Materials and
methods.
Table 1. N-Terminal sequences and molecular masses of RNase A fragments obtained by limited proteolysis with subtilisin or proteinase K. RNase A
was treated with subtilisin or proteinase K (50 : 1, w/w) in 50% trifluoroethanol (v/v) at 25 °C for 2 h or 1 h, respectively, and analysed by
RP-HPLC, protein sequencing and MALDI-MS as described in Materials and methods. The fraction numbers correspond to those in Fig. 6.
a
N-Terminal sequencing was performed for fragments generated by digestion of RNase A by subtilisin Carlsberg only.
N-Terminal sequence
determined
Assigned
RNase A
Molecular mass determined
by MALDI-MS (Da)
Suggested
RNase fragment
Fraction by protein sequencing
a
sequence Subtilisin Proteinase K Sequence Molecular mass (Da)
I Ser-Ile-Thr-Asp 80–83 5087 5088 80–124 5088
II Ser-Thr-Met-Ser 77–80 5407 5408 77–124 5407
III Lys-Glu-Thr-Ala 1–4 8758 8760 1–76 8758
IV Lys-Glu-Thr-Ala 1–4 9079 9079 1–79 9077
Ó FEBS 2002 Proteolysis of RNase A in trifluoroethanol (Eur. J. Biochem. 269) 3835
trifluoroethanol seem to have no impact on the activity of
RNase A.
Limited proteolysis by unspecific proteases resulted in
more detailed information on conformational changes of
RNase A in trifluoroethanol. In the absence of trifluoroeth-
anol, subtilisin Carlsberg and proteinase K degrade RNa-
se A by primarily cleaving the Ala20-Ser21 peptide bond
(Figs 5B and 7 [21,22]). This cleavage is possibly due to the
high flexibility of the loop region around this peptide bond
[33], whereas the rest of the RNase A molecule is not acces-
sible enough to be attacked. With the addition of trifluoro-
ethanol, alterations of the susceptibility of RNase A toward
proteolysis and changes of the proteolytic fragment patterns
occur. The lack of proteolytic fragments in 5–30% triflu-
oroethanol (Fig. 5C) is caused by the drastically decreased
rate of primary cleavage of RNase A (Fig. 4), as discussed
below. As a consequence of the breakdown of the tertiary
structure of RNase A in concentrations of trifluoroethanol
> 30%, new primary cleavage sites (Tyr76-Ser77, Met79-
Ser80) become accessible (Fig. 5D, Table 1). These peptide
bonds are located in a bulge and a b strand [34] (Fig. 7)
which belongs to the core of the RNase A and is not
accessible under native conditions [35]. In comparison with
the denaturation by GdnHCl or temperature [20], however,
a fewer number of new primary cleavage sites arise in
denaturation by trifluoroethanol. This result reflects the
different content of secondary structure in the denatured
state of RNase A, which decreases in the order trifluoro-
ethanol > temperature [36] > GdnHCl [37]. In accordance
with the emergence of new primary cleavage sites, the
proteolytic susceptibility of RNase A increases dramatically
at high trifluoroethanol concentrations (Fig. 4).
As reasons for the strong decrease of the proteolytic
susceptibility of the RNase A molecule to proteinase K in
5–30% trifluoroethanol, aggregation of the protein, as
reported for creatine kinase [38], and activity changes of the
protease, could be ruled out. It is noteworthy that in this
range of trifluoroethanol concentration, no significant
changes of the spectroscopic properties of the enzyme could
be detected. Therefore, the decrease of the proteolytic
susceptibility has to be attributed to a decreased (local)
flexibility of the RNase A molecule at the loop region
around Ala20 which is located between helices I and II of
RNase A [34]. For the isolated fragment 1–19 of RNase A,
helix formation with the addition of low concentrations of
trifluoroethanol has been reported [39,40], as well as for
fragments 21–42 [41] and 50–61 [42] resembling helices II
and III, respectively, of RNase A. As a consequence, we
propose that subtle changes of confined regions (e.g. at the
ends of the helices) brought about by trifluoroethanol result
in a rigidity of the loop and, hence, to a proteolytically less
susceptible state of the RNase A molecule without affecting
the overall structure of the protein. Interestingly, the
stabilization of RNase A toward subtilisin and protein-
ase K by 20% trifluoroethanol is similar to that caused by
the substitution of Ala20 with Pro [23]. While the helix-
forming effect is well known for both peptides [3] and
unfolded proteins [16], trifluoroethanol-induced propaga-
tion of secondary structure in a natively folded protein is
described here for the first time.
ACKNOWLEDGEMENTS
We thank Dr A. Schierhorn and Dr H. Lilie, Martin-Luther University
Halle, Germany, for performing MALDI-MS and analytical ultracen-
trifugation measurements. We thank Dr K P. Ru
¨
cknagel, Max-Planck
Forschungsstelle ÔEnzymologie der PeptidbindungÕ,Halle,Germany,
for performing N-terminal protein sequencing. We thank Dr P. Bayer,
Max-Planck Institute of Molecular Physiology, Dortmund, Germany,
for performing NMR spectroscopy experiments. The support for Jens
Ko
¨
ditz by the Land Sachsen-Anhalt and by the Max-Buchner-
Forschungsstiftung, Frankfurt/Main, Germany, is gratefully acknowl-
edged.
REFERENCES
1. Dordick, J.S. (1991) Enzymatic catalysis in organic media: fun-
damentals and selected applications. ASGSB Bull. 4, 125–132.
2. Melo, E.P., Aires-Barros, M.R. & Cabral, J.M. (2001) Reverse
micelles and protein biotechnology. Biotechnol. Annu. Rev. 7,
87–129.
3. Luo, P. & Baldwin, R.L. (1997) Mechanism of helix induction by
trifluoroethanol: a framework for extrapolating the helix-forming
properties of peptides from trifluoroethanol/water mixtures back
to water. Biochemistry 36, 8413–8421.
4. Mizuno, K., Kaido, H., Kimura, K., Miyamoto, K., Yoneda, N.,
Kawabata, T., Tsurusaki, T., Hashizume, N. & Shindo, Y. (1984)
Studies of the interaction between alcohols and amides to identify
the factors in the denaturation of globular proteins in haloalcohol
+ water mixtures. J. Chem. Soc., Faraday Trans. 1, 879–894.
5. Uversky, V.N., Narizhneva, N.V., Kirschstein, S.O., Winter, S. &
Lober, G. (1997) Conformational transitions provoked by organic
solvents in beta-lactoglobulin: can a molten globule like inter-
mediatebeinducedbythedecreaseindielectricconstant?Fold.
Des. 2, 163–172.
6. Shiraki, K., Nishikawa, K. & Goto, Y. (1995) Trifluoroethanol-
induced stabilization of the alpha-helical structure of beta-lacto-
globulin: implication for non-hierarchical protein folding. J. Mol.
Biol. 245, 180–194.
7. Liu, Z.P., Rizo, J. & Gierasch, L.M. (1994) Equilibrium folding
studies of cellular retinoic acid binding protein, a predominantly
beta-sheet protein. Biochemistry 33, 134–142.
8. Mukhopadhyay, K. & Basak, S. (1998) Conformation induction
in melanotropic peptides by trifluoroethanol: fluorescence and
circular dichroism study. Biophys. Chem. 74, 175–186.
Fig. 7. Tertiary structure of RNase A. The model was taken from the
Brookhaven protein data bank and drawn with PDBViewer. a Helices
and b sheets are presented as ribbons and sites of proteolytic attack are
indicated by arrows.
3836 J. Ko
¨
ditz et al. (Eur. J. Biochem. 269) Ó FEBS 2002
9. Yoon, M.K., Park, S.H., Won, H.S., Na, D.S. & Lee, B.J. (2000)
Solution structure and membrane-binding property of the
N-terminal tail domain of human annexin I. FEBS Lett. 484,
241–245.
10. Hamada, D., Chiti, F., Guijarro, J.I., Kataoka, M., Taddei, N. &
Dobson, C.M. (2000) Evidence concerning rate-limiting steps in
protein folding from the effects of trifluoroethanol. Nat. Struct.
Biol. 7, 58–61.
11. Chiti, F., Webster, P., Taddei, N., Clark, A., Stefani, M.,
Ramponi, G. & Dobson, C.M. (1999) Designing conditions for
in vitro formation of amyloid protofilaments and fibrils. Proc. Natl
Acad.Sci.USA96, 3590–3594.
12. Cohen, F.E. & Prusiner, S.B. (1998) Pathologic conformations of
prion proteins. Annu. Rev. Biochem. 67, 793–819.
13. Buck, M. (1998) Trifluoroethanol and colleagues: cosolvents come
of age. Recent studies with peptides and proteins. Q. Rev. Biophys.
31, 297–355.
14. Rajan, R. & Balaram, P. (1996) A model for the interaction of
trifluoroethanol with peptides and proteins. Int. J. Pept. Protein
Res. 48, 328–336.
15. Yang, J.J., Buck, M., Pitkeathly, M., Kotik, M., Haynie, D.T.,
Dobson, C.M. & Radford, S.E. (1995) Conformational properties
of four peptides spanning the sequence of hen lysozyme. J. Mol.
Biol. 252, 483–491.
16. Sivaraman, T., Kumar, T.K., Hung, K.W. & Yu C. (1999)
Influence of disulfide bonds on the induction of helical con-
formationinproteins.J. Protein Chem. 18, 481–488.
17. Price, N.C. & Johnson, C.M. (1990) Proteinases as probes of
conformation of soluble proteins. In Proteolytic Enzymes. A
Practical Approach (Beynon, R.J. & Bond, J.S., eds), pp. 163–180.
IRL Press, Oxford.
18. Hubbard, S.J. (1998) The structural aspects of limited proteolysis
of native proteins. Biochim. Biophys. Acta 1382, 191–206.
19. Arnold, U., Ru
¨
cknagel, K.P., Schierhorn, A. & Ulbrich-
Hofmann, R. (1996) Thermal unfolding and proteolytic suscept-
ibility of ribonuclease A. Eur. J. Biochem. 237, 862–869.
20. Arnold, U. & Ulbrich-Hofmann, R. (2000) Differences in the
denaturation behavior of ribonuclease A induced by temp-
erature and guanidine hydrochloride. J. Protein Chem. 19, 345–
352.
21. Richards, F.M. & Vithayathil, P.J. (1959) The preparation of
subtilisin-modified ribonuclease and the separation of the peptide
and protein components. J. Biol. Chem. 234, 1459–1465.
22. Rauber, N.R., Jany, K.D. & Pfleiderer, G. (1978) Ribonuclease A
digestion by proteinase K. Z. Naturforsch. C33, 660–663.
23. Markert, Y., Ko
¨
ditz, J., Mansfeld, J., Arnold, U. & Ulbrich-
Hofmann, R. (2001) Increased proteolytic resistance of ribonu-
clease A by protein engineering. Protein Eng. 14, 791–796.
24. Sela, M. & Anfinsen, C.B. (1957) Some spectrophotometric and
polarimetric experiments with ribonuclease. Biochim. Biophys.
Acta 24, 229–235.
25. Pace, C.N., Shirley, B.A. & Thomson, J.A. (1989) Measuring the
conformational stability of a protein. In Protein Structure – a
Practical Approach (Creighton, T.E., ed.), pp. 331–330. IRL Press,
Oxford.
26. Peters, K., Pauli, D., Hache, H., Boteva, R.N., Genov, N.C. &
Fittkau, S. (1989) Subtilisin DY – kinetic characterization
and comparison with related proteinases. Curr. Microbiol. 18,
171–177.
27. Arnold, U., Schierhorn, A. & Ulbrich-Hofmann, R. (1998)
Influence of the carbohydrate moiety on the proteolytic cleavage
sites in ribonuclease B. J. Protein Chem. 17, 397–405.
28. Scha
¨
gger, H. & von Jagow, G. (1987) Tricine-sodium dodecyl
sulfate-polyacrylamide gel electrophoresis for the separation
of proteins in the range from 1 to 100 kDa. Anal. Biochem. 166,
368–379.
29. Blum, H., Beier, H. & Gross, J.H. (1987) Improved silver staining
of plant proteins, RNA and DNA in polyacrylamide gels.
Electrophoresis 8, 93–99.
30. Polverino de Laureto, P., Scaramella, E., De Filippis, V., Bruix,
M., Rico, M. & Fontana, A. (1997) Limited proteolysis of ribo-
nuclease A with thermolysin in trifluoroethanol. Protein Sci. 6,
860–872.
31. Gast,K.,Zirwer,D.,Mu
¨
ller-Frohne, M. & Damaschun, G. (1999)
Trifluoroethanol-induced conformational transitions of proteins:
insights gained from the differences between alpha-lactalbumin
and ribonuclease A. Protein Sci. 8, 625–634.
32. Ulbrich-Hofmann, R. & Selisko, B. (1993) Soluble and
immobilized enzymes in water-miscible organic solvents: glucoa-
mylase and invertase. Enzyme Microb. Technol. 15, 33–41.
33.Santoro,J.,Gonzalez,C.,Bruix,M.,Neira,J.L.,Nieto,J.L.,
Herranz, J. & Rico, M. (1993) High-resolution three-dimensional
structure of ribonuclease A in solution by nuclear magnetic
resonance spectroscopy. J. Mol. Biol. 229, 722–734.
34. Wlodawer, A., Bott, R. & Sjolin, L. (1982) The refined crystal
structure of ribonuclease A at 2.0 A
˚
resolution. J. Biol. Chem. 257,
1325–1332.
35. Kiefhaber, T. & Baldwin, R.L. (1996) Hydrogen exchange and
the unfolding pathway of ribonuclease A. Biophys. Chem. 59,
351–356.
36.Navon,A.,Ittah,V.,Laity,J.H.,Scheraga,H.A.,Haas,E.&
Gussakovsky, E.E. (2001) Local and long-range interactions in the
thermal unfolding transition of bovine pancreatic ribonuclease A.
Biochemistry 40, 93–104.
37. Takeda, K., Sasa, K., Nagao, M. & Batra, P.P. (1988) Secondary
structural changes of non-reduced and reduced ribonuclease A in
solutions of urea, guanidine hydrochloride and sodium dodecyl
sulfate. Biochim. Biophys. Acta 957, 340–344.
38. Huang, K., Park, Y.D., Cao, Z.F. & Zhou, H.M. (2001)
Reactivation and refolding of rabbit muscle creatine kinase
denatured in 2,2,2-trifluoroethanol solutions. Biochim. Biophys.
Acta 1545, 305–313.
39. Nelson, J.W. & Kallenbach, N.R. (1986) Stabilization of the
ribonuclease S-peptide alpha-helix by trifluoroethanol. Proteins 1,
211–217.
40. Storrs, R.W., Truckses, D. & Wemmer, D.E. (1992) Helix
propagation in trifluoroethanol solutions. Biopolymers 32, 1695–
1702.
41. Jime
´
nez, M.A., Rico, M., Herranz, J., Santoro, J. & Nieto, J.L.
(1988)
1
H-NMR assignment and folding of the isolated ribonu-
clease 21–42 fragment. Eur. J. Biochem. 175, 101–109.
42. Jime
´
nez,M.A.,Nieto,J.L.,Herranz,J.,Rico,M.&Santoro,J.
(1987)
1
H NMR and CD evidence of the folding of the isolated
ribonuclease 50–61 fragment. FEBS Lett. 221, 320–324.
Ó FEBS 2002 Proteolysis of RNase A in trifluoroethanol (Eur. J. Biochem. 269) 3837