Tài liệu Does Foreign Direct Investment Work For Sustainable Development? A case study of the Brazilian pulp and paper industry potx
Bạn đang xem bản rút gọn của tài liệu. Xem và tải ngay bản đầy đủ của tài liệu tại đây (302.88 KB, 23 trang )
Working Group on Development
and Environment in the Americas
Discussion Paper Number 8
Does Foreign Direct Investment Work
For Sustainable Development?
A case study of the Brazilian pulp and
paper industry
Sueila dos Santos Rocha
Luciana Togeiro de Almeida
March 2007
The Working Group on Development and Environment in the Americas,
founded in 2004, brings together economic researchers from several countries in
the Americas who have carried out empirical studies of the social and
environmental impacts of economic liberalization. The Working Group’s goal is to
contribute empirical research and policy analysis to the ongoing policy debates on
national economic development strategies and international trade. The Working
Group held its inaugural meeting in Brasilia, March 29-30, 2004. The initial papers
were the basis for “Globalization and the Environment: Lessons from the
Americas,” a policy report published by the Heinrich Böll Foundation in July
2004.
The Policy Report (in Spanish and English), the Discussion Papers (in English),
and a book-length collection of the papers in Spanish can be found on the Web at:
/>
Luciana Togeiro de Almeida is a professor in the Department of Economics at Sao Paulo State
University and former President of the Brazilian Society for Ecological Economics. She has
published widely on trade and sustainable development and has served as a consultant and
advisor to the Brazilian Ministry of the Environment.
Sueila dos Santos Rocha holds a Master in Economics from the State University of Sao Paulo
(UNESP). Her research interests are in the field of sustainable development and foreign direct
investment issues. She is currently working as an economist at the Federal University of Espirito
Santo where she is also lecturing Rural Economics at the Center for Agrarian Sciences
© 2007, Luciana Togeiro de Almeida and the Working Group on Development and Environment
in the Americas
-2-
Does Foreign Direct Investment Work For Sustainable
Development?
A case study of the Brazilian pulp and paper industry
Sueila dos Santos Rocha
Luciana Togeiro de Almeida
Abstract
Foreign direct investment (FDI) is identified as a channel of development, promoting easy access to
new technologies, increasing employment and income in the host economies. Transnational companies
(TNCs) are increasing their share in the world production, generating and introducing advanced
technologies. A new branch of the literature on FDI has been addressing its contribution to sustainable
development in the host country. TNCs are supposed to transfer clean technologies and advanced
environmental management systems, besides creating jobs, qualifying workers and so on. This article
aims to contribute to this debate with a case study of the Brazilian pulp and paper industry, comparing
the performance between transnational and national companies concerning sustainable development
issues. This industry has been receiving increasing FDI since 2000. The study is based on secondary
and primary data from nine big companies (five national and four TNCs), making use of indicators for
the three dimensions of sustainable development – economic, social and environmental - to compare
their performance. The main findings are: concerning economic performance, national and
transnational companies are similar; national companies are ahead on the environmental performance;
while the TNCs push for better social conditions, providing higher salaries and training for their
workers. Based on these contradictory empirical evidences, we cannot conclude that FDI in the
Brazilian pulp and paper industry works for sustainable development. Although national and TNCs
have “good environmental practices”, the increasing FDI in this industry is pushing for a higher
environmental scale effect in a sector with a high potential for environmental damage.
Keywords: foreign direct investment, transnational corporations, Brazil, pulp and paper industry,
environment, technology, sustainable development
-1-
Introduction
Transnational companies1 have an important role to play in favor of the sustainable development
pushing for environmentally friendly patterns of production especially in developing countries. This
argument is based on the increasing participation of the TNCs in the global economy and their wide
access to advanced technologies. TNCs are supposed to transfer advanced technologies to the host
economies, contributing to increase the productivity, reducing the resources consumption and abating
pollution.
According to the literature (Zarsky, 1999; UNCTAD, 2004; Araya, 2005) the FDI sustainable
development impacts are very varied, i.e., case specific. That is why UNCTAD recommends a
microeconomic approach based on sectoral studies as a proper methodology to assess the sustainable
development impacts of FDI.
This study is based on the methodological approach suggested by UNCTAD (2004) and is focused on
the Brazilian pulp and paper sector. The reasons for addressing this sector case are: the importance of
the pulp and paper TNCs in the total FDI influx into Brazil in the last years; the high potential for
environmental impacts of this sector; and the high share of this sector in the national production and
exports. The fieldwork for this study involved a sample of nine companies, including five national and
four foreign companies, seven sessions of pulp and paper sector labour unions and six regional sessions
of the environmental control agency of the state of Sao Paulo (CETESB).
The paper is organized in three main sections, counting out the introduction and the conclusion. In the
first section, departing from the literature the hypotheses to be considered for the fieldwork are
identified. In the second section, a general picture of the participation of TNCs in the Brazilian pulp
and paper sector is presented. The empirical research and findings are detailed in the third section.
1.
Transnational Companies and Sustainable Development
Considering that there are many different views of the sustainable development concept and to clarify
the methodological approach of this study, two preliminary comments are important: (i) the assessment
of the sustainable development impacts of FDI considers the three analytical dimensions of the
concept: economic, environmental and social; (ii) alternatively it is used here the term sustainability
meaning a dynamic movement of the companies aiming to improve their economic efficiency, to
reduce or eliminate their harmful environmental impacts and to improve their workers’ livelihood
conditions and the welfare of the communities around them.
In this section the main findings of the literature on FDI or TNC sustainable development impacts are
identified and adopted as hypotheses for the fieldwork.
Concerning the economic dimension, the technology transfer is considered the main route of TNC
impacts in the host economies. The TNC can transfer technology to the local firms due to technological
spillover effects, i.e., the TNC technological knowledge can generate positive externalities to the
technological learning of the local firms, workers and institutions. Technology spillovers can occur
through several routes, including (Blomstrom & Kokko, 1996; Lall, 2000; Carvalho, 2005): copying of
1
Considering the fact that the major players in FDI are TNC, these concepts are indistinctly mentioned here.
-2-
TNC technology and management practices by the local firms (the “contagion” effect); competitive
pressure put by the TNC affiliates; TNC demand for local suppliers and sellers; P&D activities in the
TNC affiliates; partnerships for P&D activities jointed by TNC affiliates, local firms and institutions;
and transfer of skilled workers from the TNC affiliates to the local firms.
The extension of the spillover effects depends on several factors: the FDI objective (market-driven,
resource-driven or technology-driven); the market destination of the TNC production (domestic or
foreign markets); the technological profile of the sector FDI; the role of the TNC affiliate into the
technological network of the TNC; the modality of the FDI; the technological gap between the TNC
affiliates and the local firms; the domestic market structure; and the institutional context in the host
country (Carvalho, 2005).
There are no conclusive empirical evidences concerning TNC environmental performance in
developing countries, occurring different situations from TNC best technology and management
practices to condemned actions as the transfer of dirtier activities indifferent to their harmful
environmental impacts in the host country (Zarsky, 1999). So, the FDI environmental impacts tend to
be context specific involving the interaction of several factors (Araya, 2005).
The recent researches on TNC environmental performance in developing countries focus on two
microeconomic aspects: the TNC affiliate technological profile and the TNC corporate environmental
management system. These aspects are determined by: the regulatory system in the TNC home
country; the company specific characteristics; the market preferences for cleaner process and
production methods (green markets); the industry specific characteristics that TNC operates; the
informal regulatory forces as pressures from non-governmental organizations (NGOs) and the local
community for a better environmental performance (Hansen, 1999; OECD, 2002). Moreover, it is
necessary to consider the determinants mentioned above of technology spillover effects and their
potential positive environmental impacts.
Finally, the FDI social impacts occur through direct and indirect jobs creation, human capital
investments and social policies and programs. Moreover, TNCs tend to pay higher salaries compared to
the salaries paid by the local firms (Almeida, 2003; Görg & Greenaway, 2003) and they are an
important channel for human capital formation, mainly in developing countries with a deficient
education system (Slaugther, 2002; Kapstein, 2002; Miyamoto, 2003). It is supposed that TNCs benefit
from properties advantages to contract skilled workers and then achieving higher productivity and so
affording higher salaries. It is also supposed that when transferring technology to the local firms, even
though this transfer is restricted to the TNC affiliates, the TNC contributes to increase the demand for
human capital and so for the local labor force to become more skilled. The TNC can also contribute to
the local education system, for instance, through funding programs to the improvement of
undergraduate and graduate courses, including equipments donations and grants to students and
researchers.
Reviewing the literature on FDI and TNC sustainable development impacts, the following hypotheses
are identified for conducting the work field:
•
•
H.1: TNC affiliates generate positive technological externalities to the local firms in developing
host countries;
H.2: TNC affiliates adopt advanced environmental and technology management systems which
assure them higher environmental control compared to the local firms in developing host
countries;
-3-
•
2.
H.3: TNC affiliates pay higher salaries compared to the salaries paid by the local firms and they
are a channel for developing human capital in developing host countries.
FDI in the Brazilian Pulp and Paper Sector
The picture of the Brazilian pulp and paper sector presented in this section is useful to qualify the
preliminary hypotheses pointed out above based on the general review of the literature on FDI
sustainable development impacts.
The Brazilian pulp and paper sector is presently composed by 220 firms widely located in 16 Brazilian
states. To give an idea about this sector importance for the Brazilian economy, in 2005: this sector
directly employed 108.000 workers; it produced 10.1 millions tons of pulp and 8.6 millions tons of
paper, corresponding to 1.4% of the GDP. It is a sector characterized by high degree of international
insertion with positive trade balance. The sector trade surplus was 2.5 billions in 2005 that is equivalent
to 7% of the trade surplus accumulated in Brazil this year (Associaỗóo Brasileira de Papel e Celulose –
BRACELPA, 2006a).
The presence of TNCs in the Brazilian pulp and paper sector has not been significant from a historical
perspective. The FDI in this sector represented just 4.5% of the FDI accumulated in Brazil in 2000. But
since 2000 the sector has been receiving increasing influx of FDI. On average foreign investment in the
sector increased from US$ 8.6 millions per year between 1996-1999 to US$ 139.4 millions per year
between 2000-2004.
This recent trend of the FDI into the Brazilian pulp and paper sector is probably connected to the
general international trend for substituting long for short-fiber pulp that has been observed in the pulp
industry. The international producers are searching for new mixtures of the two fibers aiming to
increase the content of short-fiber pulp, which is the cheapest one. Consequently a strong increase in
the international demand for short-fiber pulp is expected2. This trend implies that Brazil has become
the preferential destination for the big pulp and paper TNCs investments, because this a water and land
resources abundant country and, above all, because it is highly competitive in the production of shortfiber pulp controlling the eucalyptus3 technology production and the paper production based on shortfiber pulp (O Papel, december./2005).
It is reasonable to suppose that TNCs affiliates operating in the Brazilian pulp and paper sector search
for exploring the advantages of producing lower costs pulp to the domestic and international paper
markets, but it is also expected that they make innovation efforts to absorb and to extend the short-fiber
pulp technological knowledge based on eucalyptus. The participation of four important TNCs in two
Research Consortiums on Eucalyptus in Brazil at the present time corroborates to this expectation. This
implies a qualification on the first hypothesis (H.1): the technology spillover effects in the Brazilian
pulp and paper industry could be occurring in both directions, i.e, from TNCs to local firms and from
these last ones to the TNCs.
2
3
See Access in July 2006.
Eucalyptus is the most used timber specie for producing pulp and paper in Brazil.
-4-
The pulp and paper production is a high potential environmental activity, because it is a natural
resources intensive production with high levels of timber, water and energy consumption, generating
toxic chemical substances that can pollute water and causes an unpleasant smell. These are reasons
why this sector has been constantly supervised by government authorities, environmental NGOs and
consumers (Dalcomuni, 1997).
Since evidences of dioxins wastes that are cancerous substances were found in paper packages in the
decade of 1980, the pulp and paper sector has been under increasing environmental pressure (Corazza,
1996).
According to available studies on the environmental performance of the Brazilian pulp and paper
sector, the Brazilian firms reacted promptly to these increasing environmental requirements in the
international markets enhancing their environmental management systems, for instance introducing the
ISO4 14001 certificate, investing in pollution prevention technologies and resource consumption
reduction technologies, resulting in environmental performance as good as or superior compared to the
environmental performance of the firms located in countries with more stringent environmental
regulations (Dalcomuni, 1997; Hilgemberg & Bacha, 2003). Concerning the forest resource, the
Brazilian pulp and paper sector makes use of timber from cultivated forests according to advanced
forest management practices and has been searching for globally recognized forest certifications as the
FSC5 (Dalcomuni, 1997; Marinho, 2000).
All these reported environmental improvements that have been introduced by the Brazilian pulp and
paper sector are against the second hypothesis (H.2) indicated above based on the review of the general
literature on the FDI sustainable development impacts. It means that H.2 has to be qualified here: the
TNC affiliates in the Brazilian pulp and paper sector would hardly present a higher environmental
management system compared to the local firms mainly the biggest and exporter ones.
The wide technological modernization occurred in the nineties in this sector has driven the demand for
skilled workers to operate advanced equipments with microelectronic components and for
administrative workers with higher education, versatility and learning capacity to implement more
advanced management systems (Pereira, 2003; Daura, 2004). But the sector has been facing scarcity of
skilled productive workers and to solve this problem the local firms have been investing in training and
formal education for their employees (O Papel, february/2006).
According to the Social Responsible Report published by BRACELPA6 (2003, 2004 and 2005), the
TNC affiliates have also been promoting initiatives to educate, to train and to build professional
capacities focusing their own employees and individuals from the community in their neighborhood.
Therefore, the evidences show that both TNC affiliates and the local firms have an active role in
promoting the human capital formation required in the sector.
A preliminary analysis of the TNCs role in the Brazilian pulp and paper sector based on the available
studies and data points to their potential to contribute to the country sustainable development. They can
cooperate to extend the technological competencies in pulp production owned by the local firms; they
can keep or improve the sector environmental performance; and they can contribute to the human
capital formation for the sector.
4
International Standart Organization - ISO
Forest Stewardship Council - FSC
6
The Brazilian Association for Pulp and Paper.
5
-5-
3.
Fieldwork: sample and methodology
The sample encompasses 9 companies, 7 labor unions and 6 units from the environmental agency from
Sao Paulo state – CETESB. The inclusion of the environmental agency and labor unions aimed to get
information from the two most affected parts by the industry activities, i.e., the workers and
communities near pulp and paper mills. This fieldwork is an attempt of assessing the real extension of
the efforts that have been made by foreign and local firms to reach the economic efficiency with social
justice and ecological protection.
The sample companies have many mills spread on several Brazilian states. For practical reasons we
tried to select only one CETESB unit and one labor union unit for each firm of the sample. Then, to
associate a CETESB unit to a company plant, it was necessary that the company had at least one plant
in São Paulo. It was not possible in three cases and that is why the sample includes just 6 CETESB
units in place of 9. On the situations where firms had more than one plant in Sao Paulo, we selected
integrated plants, it means plants that produce paper and pulp. This option is justified because pulp
production generates much more emissions than the paper production.
Concerning the labor unions selection, it was based on the indications from the National Labor Union
of Workers in Pulp and Paper Industry (SINAP). In this case as well, we chose, when possible, labor
unions that were linked to integrated plants localized in Sao Paulo. It was not possible to count on the
participation of two unions, so this sample has just 7 labor unions that are spread on 3 different
Brazilian states – 5 in Sao Paulo, 1 in Espirito Santo and 1 in Parana.
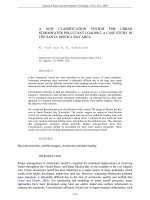
Nine companies of the sample represent a set of 45 mills that are capable to produce 9.1 millions tons
of pulp per year and 5.1 millions tons of paper per year. In 2004 these companies were responsible for
81.4% of pulp production and 52.3% of paper production. Only 2 companies are not integrated (see
table 1).
The TNCs are totally foreign-owned, what makes easy the comparison between them and the Brazilian
companies. According to BRACELPA, in 2004 the four subsidiaries from the sample represented
98.4% of the foreign production of pulp in Brazil and 46.2% of paper production.
To elaborate the indicators of technological, environmental and social performance, the data were
collected through interviews, questionnaires sent by e-mail and based on the analysis of companies’
reports for years 2002, 2003 and 2004. We expect that including data based on three years, we can
count on a more trustful average. The data collecting was done between September 2005 and June
2006; in cases where data were not available for one of these years, we considered the 2006 data.
-6-
Table 1 –Companies Sample
Companies
Products
Participation in Brazilian
production in 2004
Production capacity in ton/year
in 2005
Pulp
Paper
Pulp
Paper
Pulp
25.96%
-
3,000,000
40,000
Klabin
Pulp, eucalyptus and pinus logs, improved
seeds of eucalyptus and pinus, packaging
paper, corrugated box, boards, kraft paper
for sacks and envelops, sacks
11.87%
17.19%
1,200,000
Ripasa
Pulp, industrial base paper, cut size, coated
and uncoated paper and paperboard
4.87%
6.17%
Pulp, cut size, coated and uncoated paper
and paperboard
11.47%
Pulp, cut size, coated and uncoated paper
and chemical papers
Number
of plants
in 2005
Production percentage
yearly exported
Pulp
Paper
3
97%
-
1,500,000
18
-
55.7%
570,000
380,000
4
-
46.7%
9.32%
1,290,000
1,350,000
3
36.1%
40%
14%
7.07%
1,300,000
635,000
4
44.3%
28.7%
-
68.17%
39.75%
7,360,000
3,905,000
32
-
-
Pulp
9.51%
-
940,000
-
1
95%
-
Pulp, eucalyptus and Pinus chips, improved
wood of pinus, coated and uncoated paper.
4.68%
7.38%
450,000*
600,000
2
n.d.
n.d.
Newsprint paper
1.77%
2.08%
170,000*
185,000
1
-
1.33%
Packaging paper and corrugated paperboard
packages
2.26%
3.73%
220,000*
320,000*
9
n.d.
n.d.
Total 2
18.22%
13.19%
1,780,000
1,105,000
Total 1+ 2
86.39%
52.94%
9,140,000
5,101,000
Source: our elaboration based on the work field, reports from companies for years 2002, 2003 and 2004 and on Bracelpa (2005).
* Data elaborated by ourselves based on information on companies production in 2003 and 2004 from Bracelpa (2005)
13
45
-
-
Brazilian
Aracruz
Suzano Bahia
Sul
Votorantim
Total 1
Foreign
Cenibra
(Japan)
Internacional
Paper
(EUA)
Norske Skog
(Denmark)
Rigesa
(EUA
-7-
3.1
TNCs and Technological Spillovers: empirical findings
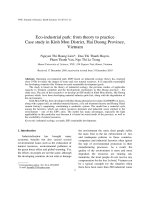
The spillovers indicators can be divided in two groups. The purpose of the first group is to
measure the extension of internal R&D efforts of the companies and is presented in table 2.
Table 2 – Technological spillovers: innovation efforts
Companies
Does the company have
a R&D department?
R&D participation
in sales
Workforce
percentage
occupied in R&D
Education level of employees
occupied in R&D
Brazilian
Aracruz
Yes
0.56%
3.32%
Graduates: 10
Masters and doctors: 12
Klabin
Yes
0.09%
0.30%
Graduates: 19
Masters and doctors: 6
Ripasa
Yes
0.12%
0.40%
Graduates: 4
Masters and doctors: 7
Suzano Bahia
Sul
Yes
0.49%
0.79%
Graduates: 8
Masters and doctors: 7
Votorantim
Yes
0.13%
0.83%
Graduates: 13**
Masters and doctors: 9
Graduates: 10.8
Masters and doctors: 7.40
Mean
-
0.28%
1.13%
Number of graduates and posgraduates by company: 18.20
Foreign
Cenibra
Yes
-
1.07%***
Graduates: 14
Masters and doctors: 6
Internacional
Paper
Yes
-
1.56%
Graduates: 40
Masters and doctors: 4
Norske Skog
Yes
0.40%
2.54%
Graduates: 3
Masters and doctors: 2
Rigesa
Yes
-
-
Graduates: 13**
Masters and doctors: 9
Graduates: 19
Masters and doctors: 3.3
Mean
-
0.40%
1.72%
Number of graduates and posgraduates by company: 22.30
Source: our elaboration based on the fieldwork.
*Average from years 2002, 2003 and 2004, excepting in the following cases: Klabin and Norske Skog only
have data for years 2003 and 2004, Suzano for 2004 and 2005 and Votorantim for 2001, 2002 and 2003.
** This data includes just employees dedicated to the paper R&D, it does not cover scientists occupied in pulp
R&D and trainees. So this value is underestimated.
*** This data includes just graduate and post-graduate workers and it does not cover trainees. So this value is
underestimated as well.
-8-
The second group investigates the existence of forward linkages and it is presented in tables
3 and 4.7 Table 2 shows that all local firms and TNCs have R&D departments. However,
while the local firms occupy only 1.13% of their workforce in this kind of activity, foreign
subsidiaries occupy 1.72%. It is expressed as well in the number of graduates and posgraduates occupied by each group of firms: the national group has 18.20 employees against
22.3 of the foreign group. On the other hand, domestic companies employ a superior number
of masters and doctors, 7.40 against 3.30 of TNCs what indicates that local firms have more
qualified researchers.
Domestic firms spent around 0.28% of their sales in R&D between 2002 and 2004. Norske
Skog, the only TNC from which was possible to get this information, spent more: 0.40%. It
is important to note that the Norske Skog R&D expenditure is higher than Klabin and Ripasa
R&D expenditure which are local firms that have a productive capacity higher than Norske
Skog.
According to UNCTAD (2005), among TNCs, the European companies have the greatest
R&D investments in foreign affiliates. In second position are the American TNCs which are
followed by Japanese and Korean companies. If we consider the size of the R&D
department as an indicator of innovation efforts, we conclude that the UNCTAD´s evidences
are corroborated here as well. The TNC that has the biggest R&D department is Norske Skig
(European), followed by International Paper (American) and in the last position is Cenibra
(Japanese).
The only two foreign subsidiaries that reported their position in terms of the main process
and product technologies – Norske Skog and International Paper – informed that they have
just used and adapted the technologies developed in their parent companies or in other
company’s affiliates.
Thus the evidences brought by the empirical study on the innovation efforts are
contradictory. On the other hand, we can explain it through the hypothesis that the TNCs
locate in Brazil just the initial phases of their R&D projects, it means just the simplest parts
of the projects which are further transferred to the parent company or others company’s
subsidiaries. Since the most complex parts of the R&D projects are not made in Brazil,
despite of having bigger R&D departments, TNCs do not need a high qualified R&D team
and do not set up deep links with the Brazilian universities and research institutions. The
TNCs participation in national research groups on eucalyptus may be an attempt of
absorbing the Brazilian technology on reforestation that can be transferred to the parent
company.
The forward linkages indicators presented in table 3 show that 41.7% of capital goods
demanded by the sample is produced in Brazil by foreign companies. Only 25.4% of capital
goods are made in the country by domestic forms. It reveals the weakness of Brazilian
capital goods producers that serve the pulp and paper industry. Domestic firms demand
around 57.5% of machines and equipment in Brazil, while foreign firms demand 66.7%.
7
It is necessary to note that these indicators can be under or overestimated considering that from 4 TNCs only
3 and for some variables only 2 answered the questions related to these indicators.
-9-
On the other hand, table 3 indicates that the production of raw material is almost totally
made in Brazil, around 96.8% from which 57.4% are supplied by Brazilian firms and 39.4%
by TNCs. Local firms from the sample buy 46.5% of their raw material from Brazilian
suppliers and 48.7% from foreign suppliers; while the TNCs buy 68.5% from local and 30%
from foreign raw material suppliers. Thus, regarding raw materials, TNCs buy more from
Brazilian suppliers than the local firms.
Table 4 presents the channels for supplier’s development that have been used by the
companies from the sample. Klabin and Ripasa, two Brazilian companies, are the only firms
that do not adopt any policy for supplier’s development. The most used channel is technical
assistance to introduce quality control and other management systems. All TNCs adopt at
least one supplier development channel that means these companies have a consistent policy
in this field. Besides giving assistance for management systems, Rigesa offers training to
suppliers and Cenibra develops suppliers to produce parts and components for import
substitution. Among domestic firms, Votorantim and Suzano have been transferring
production technologies to their suppliers. Thus, the two groups – TNCs and local firms –
have been investing in supplier’s development.
Table 3 – Technological spillovers: supply nationality
Companies
Brazilian
Aracruz
Klabin
Ripasa
Suzano Bahia Sul
Votorantim
Mean
Foreign
Cenibra
International
Paper
Norske Skog
Rigesa
Mean
Made in Brazil by Brazilian
suppliers
Capital goods Row material
50%
10%
30%
40%
32.50
30%
15%
10%
18.33%
Made in Brazil by foreign
suppliers
Capital goods Row material
Capital goods
Row material
10%
50%
40%
95%
48.75
10%
20%
40%
60%
32.50
10%
4%
0%
5%
4.75
-
-
-
-
60%
70%
10%
5%
80%
46%
60%
0%
46.50
40%
70%
30%
0%
35.0
25%
Imports
100%
80%
68.33%
75%
10%
48.33%
0%
20%
30%
10%
80%
33.33%
0%
0%
1.67%
Sample Mean
25.42%
57.42%
Source: our elaboration based on the fieldwork.
41.67%
39.38%
32.92%
3.21%
-10-
Table 4 – Technological spillovers: supplier development strategy
Has the company contributed to
the development of the Brazilian
supplier chain?
Suppliers development channels
Aracruz
Yes
Suppliers training;
technical assistance to implant quality control and other
management systems.
Klabin
No
None
Ripasa
No
None
Suzano Bahia Sul
Yes
Transfers of production technologies.
Votorantim
Foreign
Yes
Transfers of production technologies.
Cenibra
Yes
Technical assistance to implant quality control and other
management systems;
suppliers development to produce parts and components to
use in imported equipment.
International
Paper
Yes
technical assistance to implant quality control and other
management systems.
Norske Skog
Yes
technical assistance to implant quality control and other
management systems.
Rigesa
Yes
Companies
Brazilian
Suppliers training;
technical assistance to implant quality control and other
management systems.
Source: our elaboration based on the fieldwork.
According to the empirical findings, the hypothesis H.1 is valid for some spillovers channels
that are the forward linkages and the demonstration effect, being indefinite for the indicator
of innovation efforts. This last indicator may be revealing the presence of reverse
technological spillovers, it means technology transfer from Brazilian companies to the
TNCs. In this sense, TNCs may be just absorbing the local knowledge based on reforestation
technology of the eucalyptus and on production methods of short-fiber pulp and paper. Thus
TNCs do not intend to increase this knowledge base by generating innovations in their
Brazilian subsidiaries.
3.2
TNCs and Environment: empirical findings
This section is aimed to investigate the level of environment control in the pulp and paper
sector in Brazil, analyzing the emission indicators and the environmental management
systems of the sample companies. These indicators do not cover the forest phase of the pulp
and paper production process, i.e, they include just the industrial phase.
-11-
Table 5 presents an indicator, based on Almeida (2001), that classifies the environmental
management system of each company in three categories: initial, intermediate and advanced:
•
Ι- Initial level: pollution control via end-of-pipe technologies i.e. pollution is not
controlled at the source, use of technologies which just reduce the pollution effects
that have already been generated;
•
ΙΙ - Intermediary level: includes efforts to prevent pollution; the company intends to
improve continuously its environment performance, reducing or eliminating wastes
and effluents; introducing systems to reuse wastes and effluents to save water,
energy, raw material and so on;
•
ΙΙΙ - Advanced level: besides including the management systems to control the
environmental impacts of the production process, it includes all the impacts at any
point of the product life cycle as well. The environmental impacts are controlled
from the selection of raw materials to the distribution and the final disposal of the
product by consumers. The purpose is to recover, reuse and recycle the materials
used in production process and the product after its consumption. In the case of pulp
and paper industry, the integrated companies are much more worried with the
environmental management of the product than those companies that just produce
pulp, because it is an intermediate product.
Companies can present characteristics from more than one category of management system,
i.e., they can be in transit from a level to another:
Ι ⇒ ΙΙ - moving from the initial level to the intermediary;
ΙΙ ⇒ ΙΙΙ - moving from the intermediary level to the advanced.
This indicator was elaborated based on data from CETESB units and from the companies
and it intends to investigate the interaction between the environmental departments and the
other departments of the firms, if companies have established objectives and goals to
environmental control, which are the measures already adopted in this field, and how firms
have actualized their knowledge on environmental regulations. The indicator shows if
companies have an active environmental management and if they have a preventive or
corrective approach to environmental impacts. In this sense, it is important the ISO 14001
certificate, although this certification does not determine performance goals, it expresses that
the company makes at least some effort to organize their environmental management.
According to table 5, all the companies have at least one plant certified with ISO 14001.
There are more Brazilian firms plants certified with ISO 14001 than TNCs plants. Regarding
to environmental investments, from the nine companies, seven counted their environmental
investments between 2002 and 2003, what shows that they give some importance to
environmental management systems. The wide International Paper’s expenses with
environmental investments are due to the recent modernization of the environmental
equipment in one of its plants Mogi Guaỗu in Sao Paulo. The indicator shows that from
five local firms, three are moving to the advanced level of environmental management
-12-
system, while only one TNC is in a transitional period form the second to the third level.
The other companies are in the intermediate level.
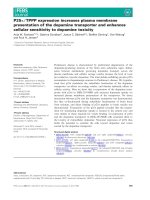
Table 6 presents the total emissions of the two groups: Brazilian and foreign companies.
This set of indicators analyses the efficiency in water consumption, the contamination level
of the effluents and the emissions level of malodorous gases that are linked to the pulp
production. We tried to choose the indicators that better express the environmental problems
of the pulp and paper industry in the industrial phase such as: the high demand of water and
energy, the generation of toxic effluents and the malodorous smell. The indicators8 BDO5,
TSS and AOX measure the effluents quality and the TRS is responsible for the sulfur
compounds that cause the malodorous smell.
Table 5 – Environmental management system: industrial phase
Certification
Companies
Participation of
environmental
investments in total
investments*
Environmental
management level
Certificate
Certified plants
Brazilian
Aracruz
ISO 14001
2 from 2
1.38%
ΙΙ ⇒ ΙΙΙ
Klabin
ISO 14001
4 from 18
11.73%
ΙΙ ⇒ ΙΙΙ
Ripasa
ISO 14001
1 from 4
4%
ΙΙ
Suzano Bahia Sul
ISO 14001
1 from 3
7.18%
ΙΙ ⇒ ΙΙΙ
Votorantim
ISO 14001
2 from 4
9.77%
Mean
Foreign
-
32.26%
6.81%
ΙΙ
-
Cenibra
ISO 14001
1 from 1
2.79%
ΙΙ ⇒ ΙΙΙ
Internacional Paper
ISO 14001
1 from 2
34%
ΙΙ
Norske Skog
ISO 14001
1 from 1
**
ΙΙ
Rigesa
ISO 14001
1 from 9
**
ΙΙ
Mean
-
30.77%
18.39%
-
Source: our elaboration based on the fieldwork and companies’s environmental reports from years 2002, 2003
and 2004.
*Average from years 2002, 2003 and 2004, excepting Klabin and Aracruz that present data for years 2003,
2004 and 2005 and Cenibra which data are available only for 2005.
** The companies do not have this value calculated.
All plants, excepting Aracruz and Cenibra, are integrated, what favors the comparison
between the two groups of companies. For the six parameters, local firms present an average
lower than TNCs in four that are: water consumption, BDO5, AOX and TSS. To obtain a
trustful average given that these companies have different production processes that may
8
BDO – Biochemical Oxygen demand; TSS – Total Suspended Solids; AOX – Absorbable Organo-Halogens;
and TRS – Total Reduced Sulfur.
-13-
affect the performance on the emissions indicators, we decided to compare the indicators for
each product segment of each company.
Cenibra and Aracruz are both not integrated companies, they just produce short-lived pulp
from eucalyptus, so they have similar production processes. Aracruz presents an average of
emissions indicators lower than Cenibra in all parameters.
Votorantim, Suzano Bahia Sul, Ripasa and International paper are integrated producers of
the writing and printing paper. By calculating the average of the three Brazilian companies
and comparing with the international Paper performance, the Brazilian group reaches an
average lower than foreign subsidiary in five of the six parameters. The values reached by
local firms are the following: water consumption – 40.45 m3/ton; effluents volume - 36.98
m3/ton, BDO5 – 0.64 kg/ton; AOX – 0.13 kg/ton; TSS – 1.02 kg/ton; and TRS – 0.05
kg/ton.
Table 6 – Emission indicators: industrial phase
Companies
Water
consumptio
n(m3/ton)
Effluents
volume
(m3/ton)
BDO5
(kg/ton)
AOX
(kg/ton)
TSS
(kg/ton)
TRS
(kg/ton)
Brazilian
Aracruz *
37.30
35.20
1.46
0.11
1.28
Klabin
40
37
1
Ripasa
35
30
0.40
0.20
1.50
Suzano Bahia Sul
42
42
0.56
0.10
0.54
Votorantim**
44.35
38.95
0.95
0.095
Mean
39.73
36.63
0.87
0.13
1.11
Foreign
Cenibra
52.8
1.60
0.13
1.40
Internacional Paper***
55.9
55.3
1.90
0.50
3.60
Norske Skog
29.3
23.7
0.34
0.07
Rigesa
48.4
25.9
0.80
3.20
Mean
46.60
34.97
1.16
0.32
2.07
Source: our elaboration based on the fieldwork and companies’s environmental reports from years 2004 and
2005.
* concerning just the Barra do Riacho – Espírito Santo – Brazil.
** This average is based on data from the Luiz Antơnio and Jacar plants – São Paulo Brazil.
*** Data cover just the Mogi Guaỗu plant São Paulo – Brazil.
0.29
0.03
0.06
0.13
0.09
0.02
0.06
Klabin and Rigesa produce mainly packaging papers and corrugated paperboard packages.
Considering the three comparable parameters – water consumption, effluents volume and
DBO5 – Rigesa presents lower values than Klabin in two parameters. It is not possible to
compare Norske Skog with any other company because it is the only national producer of
newsprint paper. However, this TNC is the company with the lowest indicators, i.e, presents
the best performance in all indicators.
Thus, the indicator of environmental management systems shows that all companies are at
least in the intermediary level, with the domestic firms leading the transition from the
intermediary level to the advanced level. Brazilian companies presented a better
performance concerning the emission indicators as well. Local firms, not the TNCs, lead the
-14-
efforts to improve the industry environmental performance. So H.2 is not corroborated with
the empirical findings here for the Brazilian pulp and paper industry.
This conclusion confirms the suspicion that TNCs hardly would have an environmental
control superior than Brazilian companies in this sector. The explanation is due to the fact
that Brazilian producers reacted very well to the increasing of environmental demands in the
end of 1980’s, getting to keep or augment their market share in countries with strong
environmental regulation and demanding costumers. Brazilians producers, mainly in the
pulp segment, export big shares of their production, so they are exposed to the international
competition, what forced them to invest in environmental certification of the forest and
industrial phase, to modernize equipment for controlling and preventing pollution and to
adopt measures to reduce the resources consumption.
Although TNCs are not ahead of Brazilian companies in terms of environmental efficiency,
according to data from CETESB and foreign subsidiaries, these companies do not use Brazil
as a “pollution haven”. According to CETESB, the two TNCs that have mills in Sao Paulo
present environmental performance superior than what is required by the Brazilian
regulation. The factors that can explain this performance are: TNCs are induced to have a
solid and efficient environmental management system because they operate in a sector with
a high pollution potential that is under pressure from authorities, customers, and
environmentalist groups; Brazilian companies have a high environmental performance, so
the TNCs are induced to perform as good as the local ones to be competitive in the local
market; Brazilian regulation is strong; company specific characteristics as the their origins in
countries with strong regulation and demanding consumers.
3.3
TNCs and social conditions: empirical findings
Based on data from the seven labor unions of the sample, it is possible to conclude that local
firms and foreign subsidiaries have invested in operational training and formal education.
However, TNCs’s employees appear to be more satisfied with their jobs than the Brazilian
companies’s workers. All the labor unions linked to the TNCs consider these companies’
human resources policies good, while only one from four unions linked to domestic
companies presents the same opinion. Human resources policy is considered here as the
salaries policy, the human capital development strategy and how the company approaches its
workforce. A common complaint of the labor unions are that workers had been under too
much pressure to increase the productivity, so they can not take advantages from the
opportunities offered by the companies to increase their educational level because they feel a
mental and physical fatigue.
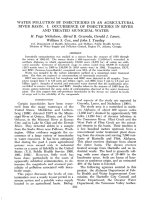
Table 7 presents the quantitative indicators of human capital efforts and the wages expenses
of the companies from the sample. Once more it is necessary to note that these indicators
may be underestimated or overestimated because just two from four companies answered
the questions related to the social indicators.
TNCs appear to pay wages and benefits 19.5% higher than what is paid by the Brazilian
companies. While TNCs spend yearly R$ 48,942.23 per worker, local firms spend just R$
40,959.39. Although Rigesa has not reported their wages and benefits expenses, the labor
-15-
union linked to this TNC informed that it has paid wages higher than the average salary paid
in the pulp and paper industry. Thus even though the Brazilian firms are big size companies,
we found a positive differential in term of wages and benefits in favour of TNCs.
The quantity indicators on human capital formation are also in favor of the TNCs. The
foreign affiliates spent around R$ 1,141.46 per worker yearly between 2002 and 2004, while
domestic firms spent R$ 893.09. In this same period TNCs trained their workforce more
than local firms: 63.7 annual hours per worker against 53.4 annual hours in the Brazilian
companies. This conclusion reinforces the results found in the literature and so confirms the
hypothesis H.3 for the Brazilian pulp and paper industry.
On the expenses with social actions, there is a clear superiority of the local firms. These
companies spent on average 0.19% of their sales in social actions and the TNCs spent only
0.04%. In other words, despite of TNCs contribution to the industry efforts in human capital
formation, domestic firms are much more interested in the development and welfare of
external communities. From the seven labor unions consulted, just three consider the social
actions from companies satisfactory. The majority believe that these investments are quite
small if compared to the companies’ sales and their environmental impacts on the
communities in the plants neighborhood.
Table 7 – Social expenditures and human development: average from years 2002, 2003 and 2004
Companies
Annual expenditures
in wages and benefits
per worker
Annual expenditure in
human capital
formation per worker
Number of annual
hours of training per
worker*
Participation of social
expenditures in sales
Brazilian
Aracruz
59,063.49
1,322.08
43
0.40%
Klabin
35,829.69
274,77**
0.0008%
Ripasa
34,387.38
568.09
0.11%
Suzano Bahia Sul
25,638.64
868.24
64
0.33%
Votorantim
49,877.75
1,432.25
53.20
0.11%
Mean
40,959.39
893.09
53.40
0.19%
Foreign
Cenibra
40,242.42
876.29
4.47
0.07%***
Internacional Paper
140.50
Norske Skog
57,642.03
1,406.63
46
0.01%
Rigesa
-.
Mean
48,942.23
1,141.46
63.70
0.04%
Source: our elaboration based on fieldwork and on the companies’s annual reports from 2002, 2003 and 2004.
* The following companies just have data for some years: Aracruz – 2003, 2004 and 2005; Suzano Bahia Sul –
2003 and 2005; Votorantim – 2004 and 2005; Cenibra – 2004; International Paper – 2003 and 2004; Norske
Skog – 2004 and 2005.
** Average from years 2003 and 2004.
*** Average from years 2003, 2004 and 2005.
-16-
Conclusion
Given the controversies on the sustainable development impacts of FDI in the host
economies, this study intended to offer evidences from the Brazilian pulp and paper sector.
In this case and considering the aggregated parameters of assessment, the main conclusion is
that TNCs and local firms’ contributions to the Brazilian sustainable development tend to be
similar.
We can conclude that TNCs have contributed to the Brazilian pulp and paper industry
sustainability in many ways. On the economic dimension, they have established important
links with the local supplier chain and introduced efficient and technologically advanced
plants. On the environmental dimension, although foreign affiliates do not lead the
improvement of environmental control, they at least have adopted measures that minimize
negative impacts, contributing to the high pattern of environmental performance of the
industry. On the social aspect, they have developed the human capital demanded by the
industry and paid higher wages. However, we identified three factors that appear to be
limiting this contribution.
In first place, we observed a potential for reverse technological spillovers in the Brazilian
pulp and paper industry. There are evidences that TNCs are just absorbing the national
knowledge base on the eucalyptus culture and on the production process with short-fiber and
they are not widening this knowledge base by generating innovations through their affiliates
installed in Brazil. The country has been accumulating valuable technological competence
on the short-fiber pulp segment what gives to the country the position of the biggest
international producer of this good. If we added to that the expected growth of short-fiber
pulp comsuption worldwide, Brazil becomes a preferential location for TNCs.
Second, it is worth to note, in accordance to the ecological economics thinking, that the
efforts of local and foreign companies in the pulp and paper sector to achieve higher
environmental efficiency may not be enough to fully cope with the environmental impacts of
this sector. This sector has been growing in Brazil during more than two decades and it can
generate environmental pressures due to the “scale effect”, i.e., the industry expansion
augments the needs of water, energy, wood and so on, what reduce the environment capacity
to attend these demands. Besides, this is an activity with high pollution potential. So the
installation of new foreign plants added to Brazilians producers’ expansion can accelerate
the environmental degradation. This is one of the potential negative environmental impacts
of the FDI growth in this industry.
Finally, the empirical study pointed out the low social investments that TNCs have done in
Brazil if compared to national companies. Foreign subsidiaries could help much more
Brazilian development by increasing their investments in formal education of poor
communities.
-17-
References
Aghion. P.; Howitt, P. (1992). A model of growth through creative destruction.
Econometrica. Evanston, Illinois, vol. 60, n 2.
Almeida, L. T. (2001). Harmonizaỗóo internacional de regulaỗừes ambientais um estudo
da petroquớmica brasileira. Tese (doutorado em Economia) - Instituto de Economia,
Universidade Estadual de Campinas, Campinas.
Almeida, R. (2003). The effects of foreign owned firms on the labor market. The Institute
for the Study of Labour (IZA) Discussion Paper. Bonn, Alemanha, n. 785, maio.
Aracruz Celulose. Relatório Anual 2002. Disponível
www.aracruz.com.br/web/pt/ri/ri_financeiros_relatorios.htm. Acesso em jul. de
2005.
______. Relatório Anual 2003. Disponível em
www.aracruz.com.br/web/pt/ri/ri_financeiros_relatorios.htm. Acesso em jul. de
2005.
______. Relatório Anual 2004. Disponível em
www.aracruz.com.br/web/pt/ri/ri_financeiros_relatorios.htm. Acesso em jul. de
2005.
______. Relatório Anual 2005. Disponível em
www.aracruz.com.br/web/pt/ri/ri_financeiros_relatorios.htm. Acesso em maio de
2006.
Araya, M. (2005). FDI and the environment: what empirical evidence does – and does not –
tell us? In: International investment for sustainable development. ZARSKY, L. (ed.).
Londres: Earthscan Publications.
Bacha, C. J. C.; Hilgemberg, E. M. (2003). A indústria brasileira de celulose de mercado e
as pressões ambientais. Revista Estudos Econômicos. São Paulo, vol. 33, n. 1.
Banco Anco Central Do Brasil (2006). Censo de capitais estrangeiros 2005. Disponível em:
Acesso em: abr.
Blomstrom, M.; Kokko, A. (1996). The impact of foreign investment on host countries: a
review of the empirical evidence. Estocomo: Stockholm School of economics, 33 p.
Bracelpa (2004). Responsabilidade social das empresas do setor de celulose e papel 2003.
SãoPaulo.
______. Relatório Estatístico 2004/2005. São Paulo, 2005.
-18-
______. O setor brasileiro de celulose e papel. Disponível em
www.bracelpa.org.br/anual/perfil2006.pdf. Acesso: abr. 2006a.
______. Responsabilidade social das empresas do setor de celulose e papel. São Paulo,
2006b.
Carvalho, F. P. (2005). Investimento direto estrangeiro: conceitos, fatores e determinantes.
Dissertaỗóo (mestrado em Polớtica Cientớfica e tecnológica) - Instituto de
Geociências, Universidade Estadual de Campinas, Campinas.
Cenibra. Relatório anual 2004. Disponível em www.cenibra.com.br. Acesso em jul. de
2005.
______. Relatório anual 2005. Belo Oriente - MG, 2006.
Comissão Mundial sobre Meio Ambiente e Desenvolvimento Sustentável. (1991). Nosso
futuro Comum. 2 ed., Editora da Fundaỗóo Getỳlio Vargas, Rio de janeiro.
Corazza, R. I. (1996). Inovaỗóo tecnolúgica e demandas ambientais: notas sobre o caso da
indỳstria brasileira de papel e celulose. Dissertaỗóo (mestrado em Polớtica Cientớfica
e Tecnológica) - Instituo de Geociências, Universidade Estadual de Campinas,
Campinas.
Dalcomuni, S. M. (1997). Dynamics capabilities for cleaner production innovation. The case
of the market pulp export industry in Brazil. Tese (doutorado em Filosofia) –
Unidade de Pesquisa em Política Científica, Universidade de Sussex, Brighton.
Daura, S. P. (2004). Análise do setor de celulose e papel na era da Globalizaỗóo. Dissertaỗóo
(mestrado em Ciờncias Sociais) Programa de Pús-graduaỗóo em Ciờncias Sociais,
Universidade Estadual Paulista, Marớlia.
Enderwick, P; Scott-Kennel, J. (2005). FDI and inter-firm linkages: exploring the black box
of the investment development path. Transnational Corporations. Nova York, vol.14,
n.1, abr.
Fortanier, F.; Maher, M. (2005). Foreign direct investment and sustainable development.
OECD global forum on international investment – new horizons and policy
challenges for foreign direct investment in the 21 century. Cidade do México, nov.
2001. Disponível em http//www.oecd.org.br:. Acesso em maio.
Gallagher, K.; Zarsky, L. (2003). Searching for the Hole Grail? Making FDI work for
sustainable development. WWF Analytical Paper. Gland Suiỗa, mar.
Gửrg, H.; Greenaway, D. (2003). Much ado about nothing? Do domestic frrms really benefit
from foreign direct investment? The Institute For The Study Of Labour (IZA)
Discussion Paper. Bonn, Alemanha. N. 944, nov.
-19-
Grossman, G. M.; Helpman, E. (1991). Innovation and growth in the global economy.
Cambridge, Massachucets: The MIT Press.
Hansen, M. W. (1999). Cross border environmental management in transnational
corporations. An analytical framework. UNCTAD/Copenhagem Business School
Occasional Paper Series. N. 5, 1999. Disponível em:
< Acesso em: out. 2004.
Kapstein, E. B. (2002). Virtuous circles? Human capital formation, economic development
and the multinational enterprise. OECD Developing Centre Working Paper. N.º 191,
ago.
Klabin S.A (2003). Relatório anual 2003. Disponível em
www.klabin.com.br/br/relatoriosocial.asp. Acesso em jul. de 2005.
______. Relatório anual 2004. Disponível em www.klabin.com.br/br/relatoriosocial.asp
Acesso em jul. de 2005.
______. Relatório anual 2005. Disponível em www.klabin.com.br/br/relatoriosocial.asp.
Acesso em maio de 2006.
Lall, S. (2000). FDI and development: policy and research issues in the emerging context.
Queen Elizabeth House Working Paper Series. Oxford, n.43, jun.
Marinho, M. M. O. (2000). The role of voluntary initiatives in industrial environmental
management: experience from the pulp and paper sector in Brazil. Tese –
Universidade de East Anglia.
Miyamoto, K. (2003). Human capital formation and foreign direct investment in developing
countries. OECD Development Centre Working Paper. N. 211.
OECD. (2002). Environmental benefits of foreign direct investment: a literature review.
Paris. Disponível em: . Acesso em out. 2004.
Nelson, R.; Winter, S. (1982). An evolutionary theory of economic change. Harvard
University Press, Cambridge.
O PAPEL: revista mensal de tecnologia em celulose e papel. São Paulo: ABTCP. Ano
LXVI, n.º 6, fev. 2006.
Pereira, G. R. (2003). Terceirizaỗóo e identidades no trabalho: estudo comparativo da
indỳstria paulista de celulose. Dissertaỗóo (mestrado em Polớtica Cientớfica e
Tecnolúgica) Programa de Pús-Graduaỗóo em Polớtica Cientớfica e Tecnolúgica,
Instituto de Geociờncias da Universidade Estadual de Campinas, Campinas.
Romer, P. (1990). Endogenous technical change. Journal of Political Economy. Chicago,
Illinois, [S.v].
Slaughter, M. J. (2002). Skill upgrading in developing coutries: has inward foreign direct
-20-
investment played a role? OECD Development Centre Working Paper. N. 192,
agosto de.
Suzano Bahia Sul. Relatório anual 2002. Disponível em
www.supremo.com.br/ri_/home/resultado/relatorioanual.cfm. Acesso em jul. de
2005.
______. Relatório anual 2003. Disponível em
www.supremo.com.br/ri_/home/resultado/relatorioanual.cfm. Acesso em jul. de
2005.
______. Relatório anual 2004. Disponível em
www.supremo.com.br/ri_/home/resultado/relatorioanual.cfm. Acesso em jul. de
2005.
______. Relatório anual 2005. Disponível em
www.supremo.com.br/ri_/home/resultado/relatorioanual.cfm. Acesso em maio de
2006.
UNCTAD. (2005). World Investment Report 2005. Nova York e Genebra.
UNCTAD. (2004). Making FDI work for sustainable development. Nova York e Genebra.
Votorantim Celulose E Papel. (2002). Relatório Anual 2002.. Disponível em
www.vcp.com.br/Investidores/Demonstracao+Financeiras/default.htm. Acesso em
jul. de 2005.
______. Relatório Anual 2003. Disponível em
www.vcp.com.br/Investidores/Demonstracao+Financeiras/default.htm. Acesso em
jul. de 2005.
______. Relatório Anual 2004. Disponível em
www.vcp.com.br/Investidores/Demonstracao+Financeiras/default.htm. Acesso em
jul. de 2005.
______. Relatório Anual 2005. Disponível em
www.vcp.com.br/Investidores/Demonstracao+Financeiras/default.htm. Acesso em
maio de 2006.
Zarsky, L. (1999). Havens, halos and spaghetti: untangling the evidence about foreign direct
investment and the environment. In OECD. Foreign direct investment and the
environment. Paris: OECD.
-21-