Tài liệu Measurement for Management CDP Cities 2012 Global Report pdf
Bạn đang xem bản rút gọn của tài liệu. Xem và tải ngay bản đầy đủ của tài liệu tại đây (3.81 MB, 93 trang )
Measurement for
Management
CDP Cities 2012 Global Report
Including special report on C40 Cities
Written by Carbon Disclosure Project (CDP)
www.cdproject.net
+44 (0) 207 970 5660
Report analysis and
information design for
Carbon Disclosure Project by
An enormous task lies
before us; we need all of the
city’s inhabitants to become
aware of the responsibility
that each of them has in
stopping climate change.
We are convinced that the
government must preach
through example and firm
commitment while leading
the city along this process.”
“
”
Buenos AiresAs Mayor of New York and Chair of
C40, I have seen rsthand the impact
that local leaders can have in the ght
against climate change. When it comes
to confronting a challenge of this
magnitude, nations have long talked
about comprehensive approaches, but
it has been up to cities to act. After all,
cities are most directly responsible for
our residents’ health and well-being.
We are also the level of government
closest to the majority of the world’s
people, which means that when we work
together, we have the opportunity to
effect change on a global scale.
I’ve always believed that if you can’t
measure it, you can’t manage it.
That truism serves governments and
businesses well every day, and it
underlines the purpose of the Carbon
Disclosure Project. CDP has been
a leader in climate change reporting in
the private sector for a decade, and
during the past two years, it has helped
C40 meet a critically important objective:
holding ourselves accountable for meeting
the emissions reduction targets we set
individually and as an organization.
Michael R. Bloomberg
Mayor of New York City
Chair of C40 Cities
So far, the results have been very
encouraging. With C40 cities leading the
way, the number of cities reporting to
CDP has increased dramatically during
the second year of our partnership. In
addition, the quality of the data is better,
allowing for a more thorough analysis
and a better understanding of what
constitutes effective climate change
action. This is tremendous progress,
and we stand to benet even further if
international organizations standardize
the carbon-reporting process among
all the world’s cities. In this spirit, we
will continue to call on cities to report
to CDP, as well as make the data they
submit accessible to the public and to
their fellow governments.
Cities are demonstrating that they have
the will, the knowledge, and the capacity
to set the agenda for climate change
action. As these cities become more
sustainable, our entire world will reap the
rewards. This report represents another
exciting step in our collaboration, and
I invite you to learn more about the
action that cities are taking across the
world in climate change measurement
and management.
Foreword
At CDP, we have found that annual
reporting drives standardization. When
we rst began requesting climate change
data from companies, there was little
commonality in the way that companies
measured their greenhouse gas (GHG)
emissions. Over the last decade,
however, two things happened. First,
the World Resources Institute and the
World Business Council for Sustainable
Development launched the Greenhouse
Gas Protocol—prescribing, for the
rst time, a clear, actionable method
for companies to account for GHG
emissions. Second, more and more
companies began reporting publicly to
CDP every year, making available better
best practice examples, clearer sector-
specic data, and allowing companies
to see how their peers were measuring
their emissions. The combination of a
sound methodology and transparent
data about how companies were
accounting for their emissions led
to increasing standardization of
approach. Today, approximately 70%
of reporting Global 500 companies use
the same greenhouse gas accounting
methodology, without the enactment of
a single government regulation.
Paul Dickinson
Executive Chairman
CDP
We are beginning to see a similar
progression for city governments. In
November 2011, for the second year in
a row, CDP invited a group of the world’s
largest cities to report on their climate
change related activities using CDP’s
online reporting platform. Seventy-three
cities answered CDP’s invitation this year,
making public information about their
greenhouse gas emissions, how they
measure them, and their efforts to adapt
to this serious problem. And, just a few
weeks before publication of this report,
C40 and ICLEI, in close collaboration
with the World Resources Institute and
the Joint Work Programme of the Cities
Alliance, launched the Global Protocol
for Community-scale Greenhouse Gas
Emissions. The table is now set for a rapid
move toward increasing standardization of
city climate change data.
This report represents another successful
year for CDP’s partnership with the C40
Cities Climate Leadership Group. Two
years ago, CDP and C40 partnered
to extend CDP’s platform to the C40,
allowing member cities to track, report,
and benchmark their climate change
activities. Forty-ve of the 73 cities
proled in this report are C40 member
cities. CDP salutes the inspiring
leadership of the C40 and Mayor
Bloomberg in bringing the enormous
power and capability of the world’s great
cities to focus on the supreme challenge
of climate change.
We are also proud to partner with
AECOM this year for the rst time.
AECOM, a world-leading design,
engineering, environmental and
infrastructure consultancy, performed the
data analysis contained in these pages
and on the web. AECOM’s experience
working with city governments and the
company’s commitment to analysis and
design has allowed us to peer deeply
into the reported data and extract the
most actionable results.
Foreword
Introduction :3
Chapter 2
Chapter 1
Chapter 3
Chapter 4
Chapter 5
Chapter 6
Chapter 7
San Diego
Los Angeles
San Francisco
Portland
Seattle
Vancouver
Denver
Las Vegas
Phoenix
Guadalajara
Dallas
Houston
Austin
Atlanta
Miami
San Salvador
Edina*
Chicago
Toronto
New York
Philadelphia
Washington
Bogotá
Caracas
Santiago
Buenos Aires
Curitiba
São Paulo
Rio de Janeiro
Dublin
Greater Manchester
Greater London
Paris
Madrid
Barcelona*
Rome
Amsterdam
Rotterdam
Basel
Milan*
Stockholm
Berlin
Dakar*
Abidjan
Lagos
Johannesburg*
Helsinki
Oristano
Pietermaritzburg
St. Louis
CDP Cities 2012
See the interactive version of the map—
including more detail on emissions and other
reported information from cities—at
www.cdproject.net
4: Introduction
73 responding cities:
Chapter 2
Chapter 1
Chapter 3
Chapter 4
Chapter 5
Chapter 6
Chapter 7
Stockholm
Berlin
Copenhagen
Hamburg
Moscow
Warsaw
Istanbul*
Kadiovacik
Durban
Antananarivo*
Ekurhuleni
Johannesburg*
Addis Ababa
Bangkok
Jakarta
Kaohsiung
Hong Kong
Taipei
Tokyo
Yokohama
Changwon
Seoul*
Melbourne
Sydney
Karachi
Riga
Helsinki
Pietermaritzburg
Cities that report privately
*
244,476,700
total population
3 cities
not included
23 cities
Non-Annex
47 cities
Annex I
39 cities
greater than
1.6m
17 cities
less than 600k
17 cities
600k-1.6m
Cities by population Cities by UNFCCC status
Introduction :5
catching on among cities. CDP hosts
disclosure from 73 cities and local
governments this year—up from 48
last year—from all corners of the
globe, including every continent except
Antarctica. Participants range in size
from the city of Tokyo, population 13
million, to the village of Kadiovacik in
Turkey, population 216, and include
over 75% of the membership of the C40,
a group of mega-cities dedicated to
climate change leadership. The breadth
of responses demonstrates that local
governments in every region of the world,
regardless of their size, can participate in
annual climate change reporting.
Here are the key ndings:
Introduction :7
Measurement
Management
Special Report on
C40 Cities
Cities report emissions totalling 977,659,014 tonnes of CO
2
e. This number represents
an increase of 43% from levels reported last year, resulting from the larger number of cities
reporting this year. At nearly 1 billion tonnes of CO
2
e, reporting cities account for emissions
that are roughly equal in size to the emissions of Canada and Brazil combined. Pg 12
Larger, denser cities, on the whole, demonstrate smaller per capita greenhouse gas
emissions (GHG). Per capita GHG emissions vary widely from city to city, but our analysis—
based on emissions inventories from 51 cities—supports the understanding that larger,
denser cities tend to be more emissions-efcient. Pg 14
City governments anticipate economic opportunities from climate change. 82% of
responding cities say climate change presents economic opportunities. Green jobs and
development of new business industries top the list of anticipated economic opportunities,
with over half of responding cities expecting more green jobs or new business opportunities
resulting from climate change. Pg 20
Climate change risks to cities are here and now. Despite an increase in the number of cities
reporting to CDP this year, the percentage of cities reporting themselves at risk from climate
change remained the same compared to last year, with 89% of cities identifying physical risks
from climate change. The timescale of many of these risks is immediate—39% of all risks are
classied as “current”, compared to just 14% of risks classied as “long-term”. Pg 24
City governments with emissions reduction targets report three times as many
emissions reduction activities as cities without targets. This nding suggests that setting
reduction targets provides a strong catalyst for taking action to reduce greenhouse gas
emissions. Pg 36
Municipal governments report that they are primarily funding climate change actions
themselves. 64% of reported emissions reduction activities are nanced through general
municipal funds, compared to 7% supported by grants or specic subsidies. The private
sector accounts for 14% of nancing, while development banks nance less than 1% of total
emissions reduction activities. Pg 38
Many of the cities reporting to CDP this year are member or afliate cities of the C40 Cities
Climate Leadership Group. In November 2011—for the second year in a row—C40 Chair and
New York City Mayor Michael R. Bloomberg invited the 58 C40 cities (40 participating cities
and 18 afliate cities)
1
to report their climate change-related data to CDP. Forty-ve C40 cities
answered Mayor Bloomberg’s call; the results are included in this section.
C40 cities show an improved commitment to annual disclosure this year. Forty-ve C40
cities report on their climate change activities this year, up from 42 cities last year. Pg 51
Energy and transportation top the list of reported emissions reduction initiatives
for C40 cities. 80% of C40 cities disclose actions in the energy sector, while 73% disclose
actions related to transportation. All told, C40 cities report 489 total actions designed to
reduce emissions. Pg 53
Fifteen C40 cities report updated city-wide emissions inventories, demonstrating world-
class leadership in annual assessment of their greenhouse gas emissions. Eight of those
cities report reductions in emissions from last year. Pg 72
1
Reects the number of members/afliates as of November 2011.
8: What’s Trending
What’s Next
for Cities?
Special Features
Expert Insight
A Note on the Text
More than 25 city governments mention the word “innovation” in their responses to CDP this
year. This section looks at what’s ahead for cities when it comes to climate change, utilizing
CDP responses as well as interviews with city government staff members around the world.
Putting data to work for your city. New research from The Climate Group and others shows
the data explosion that is happening in cities—and how city governments are partnering with
their citizens to put the data to work. Pg 79
Four city innovations to watch in 2012. St. Louis, Greater Manchester, Miami, and Warsaw
highlight the next big things in their cities. Pg 80
The Global Protocol for Community-scale Greenhouse Gas Emissions. Pg 14
Green Jobs: Special Focus on North America Pg 20
Water Pg 30
Citizen Engagement Pg 32
Ten Cities to Follow on Twitter Pg 33
Can cities use real estate strategies to deal with climate change threats? Dan Probst of
Jones Lang LaSalle shares tips. Pg 45
What are the next big technologies for cities? Emma Stewart from Autodesk and Simon
Giles of Accenture explain the next big technologies that can help cities address environmental
issues. Pg 78
Can a city government be innovative? Michael Armstrong of the City of Portland, Oregon
shares his views. Pg 79
Necessity is the mother of invention. Rodrigo Rosa of the Prefeitura do Rio de Janeiro
explains the thinking behind the new Rio Operations Center. Pg 79
All data in the report is based on answers from city governments to the questions contained in
the 2012 CDP Cities questionnaire, except where otherwise noted.
In some places, we have divided cities by their development levels using United Nations
indicators. Cities located in countries that are Annex 1 countries under the United Nations
Framework Convention on Climate Change (UNFCCC) are considered developed countries.
Cities in countries that are non-Annex 1 countries under the UNFCC are considered
developing countries.
Analysis on 73 cities is included in the rst part of the report. Analysis specically on the
member cities of the C40 is included in the Special Report on C40 Cities.
What’s Trending :9
Meas-
ure-
ment
Emissions & Risk
“What gets measured gets managed” is a mantra often associated with the
business world. But as Mayor Michael R. Bloomberg points out, this mantra is
just as true for the business of local government. The rst step for many cities
in tackling climate change is to take the time to measure key indicators so
they know where to start taking action. We focus here on two broad areas of
measurement: greenhouse gas emissions and climate change risk.
City governments often take responsibility for two different GHG inventories: emissions resulting from municipal operations (also
known as city government operational emissions), and those relating to activities across the community as a whole (also known
as city-wide emissions). CDP offers cities the opportunity to report both city government operation emissions and/or city-wide
emissions. The gures and ndings in this section are based on the information that cities have reported to CDP in 2012.
Fig. 1 Number of participating cities that reported city-wide emissions, by region.
North America Latin America
5
of 9 cities
Europe
Africa East Asia South Asia / Oceania
17
of 21 cities
19
of 22 cities
1
of 9 cities
6
of 7 cities
3
of 5 cities
Measurement - Emissions and Risk :11
City-wide emissions measurement is catching on
in cities. Fifty-one out of the 73 cities that report to
CDP this year (70%) disclose city-wide emissions
inventories. This number represents a small increase
from last year’s report, in which 31 out of 48 cities
(65%) reported city-wide inventories. At least one city
from every region of the world reports an emissions
inventory, with North America and Europe showing
the highest percentages of cities. The increase from
2011 to 2012 demonstrates that measurement and
reporting of city-wide emissions is a growing trend
among city governments.
Measuring Emissions
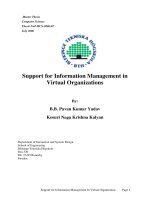
Cities report city-wide greenhouse gas
emissions totalling 977,659,014 tonnes,
roughly equivalent to the total emissions
from Canada and Brazil combined. This
number represents a 43% growth from
last year’s total reported emissions,
reecting the larger numbers of cities
disclosing this year. By contrast, Global
500 companies reported about 4 billion
tonnes of CO
2
e (Scope 1+2) through
CDP in 2011, and total world emissions
stand at around 30 billion tonnes CO
2
e.
Methodologies for measuring city-
wide emissions remain varied, allowing
signicant room for improvement and
alignment. This year, our analysis shows
that 13 cities (the largest single group)
are adapting the Intergovernmental
Panel on Climate Change’s (IPCC)
methodology for national governments
to t the requirements of their city’s
community emissions. Seven cities
measured their emissions using the
draft edition of the Global Protocol for
Community-scale Greenhouse Gas
Emissions, despite the fact that a nal
version had not yet been released
publicly, suggesting that cities are keenly
awaiting an improved—and common—
emissions measurement standard.
Up close
Should you use a
consultant to help you
measure your GHG
emissions?
Cities employ different strategies to complete
their GHG emissions inventories. Two experts
share their views on what works for their
cities.
No. New York City does not use a consultant
to complete its GHG inventory, as we feel it is
critical to develop the institutional knowledge
and internal capacity achieved by completing
this work in-house. This ensures accuracy and
consistency in the application of accounting and
reporting methodologies. Jonathan Dickinson,
Senior Policy Advisor, New York City
Yes. Using an external consultancy to help a
city complete its greenhouse gas inventory
in general is recommended. In the rst place,
local governments may not always have a wide
group of experts working in the Climate Change
Team, so the interaction with experts of different
disciplines complement knowledge and bring
up new questions and ideas. In the same line,
the consultant can help dening, organizing
and managing variables necessary for the GHG
emission report, especially those specic to each
city, as for example Vehicle Kilometers Travelled
(VKT). Secondly, the creation of tools which
help simplify the loading of data and calculation
of GHG emissions is always useful, especially
in small Climate Change working teams. In the
case of Buenos Aires City, a web platform was
dened for the City in 2011, which is expected
to make the process more efcient and less time
consuming. In the mid term, it is also expected
to streamline the data input allowing each entity
to load its own data. Inés Lockhart, Climate
Change Department, Buenos Aires
Based on interviews with city staff
12: Measurement - Emissions and Risk
Fig. 2 Total city-wide emissions reported to CDP compared to countries (metric tonnes CO
2
e).
Source:
U.S. Energy Information Administration.International Energy Statistics. http://205.254.135.7/cfapps/ipdbproject/IEDIndex3.cfm?tid=90&pid=44&aid=8
Brazil
2009
Canada
2009
All cities
2011
All cities
2012
Germany
2009
Japan
2009
United States
2009
5,424,529,520
1,097,964,870
977,659,014
765,561,770
680,182,629
540,966,900
425,169,250
Country
Cities reporting to CDP
6B
3B
2B
1B
4B
5B
0
28%
37%
17%
15%
2%
Fig. 4 Percent of cities reporting emissions inventories, by year.Fig. 3 Primary methodology used to calculate city-wide emissions
(% of responses).
City-wide inventory
Municipal inventory
2011 2012
65%
70%
54%
45%
0
75%
50%
25%
100%
The International Basic Standard for Community-scale
GHG Emission Inventories (C40/ICLEI/WRI)
International Emissions Analysis Protocol (ICLEI)
2006 IPCC Guidelines for National Greenhouse Gas Inventories
Other
International Standard for Determining Greenhouse Gas
Emissions for Cities (World Bank)
Measurement - Emissions and Risk :13
Larger, denser cities tend to be more
economically efcient per tonne of
greenhouse gas emitted. Per capita
emissions in larger, denser cities tend
to be lower than in smaller, less dense
cities. Cities in the bottom half of density
(less than 4,000 persons per sq. km)
average 9.9 tonnes of GHG per capita
emitted compared to 7.4 tonnes of GHG
per capita emitted for cities with more
than 4,000 persons per sq. km. This is
due to a wide range of factors, including
less reliance on cars, easier access to
public transport, and other economies of
scale. Our analysis shows that cities over
1.6 million inhabitants have the lowest
emissions per capita, on average.
European cities are more economically
efcient per tonne of GHG emitted than
their North American counterparts.
North America averages approximately
$5,300 of economic activity per tonne of
GHG emitted, whereas Europe averages
$9,200 of economic activity per tonne of
GHG emitted.
Up close
The Global Protocol
for Community-scale
Greenhouse Gas
Emissions (GPC)
On 14 May 2012, C40 and ICLEI (Local
Governments for Sustainability) in collaboration
with the World Resources Institute (WRI)
and the Joint Work Programme of the Cities
Alliance between the World Bank Group,
UN-HABITAT and UNEP announced a key
milestone in establishing a standard for
emissions measurement and reporting across
cities of all sizes and geographies. Together,
these organizations launched a pilot version
of the Global Protocol for Community-scale
Greenhouse Gas Emissions—a tool that will
provide a consistent and transparent system
for cities to plan for and nance climate change
action.
To date, cities have lacked a strong, clear
methodology for measuring city-wide emissions.
CDP’s 2011 report showed signicant variation
in how greenhouse gas emissions are calculated
by different cities. The launch of the GPC is an
important step forward, as it will allow cities
to measure emissions according to a robust,
common methodology. It will also allow cities
who have followed the GPC guidelines to
compare their GHG emissions inventories with
other cities, driving greater collaboration and
increasing the level of funding available to cities.
Seth Schultz, Director of Research, C40
For more information contact
Measuring and tracking emissions can
help cities save money and conserve
resources. 29% of reporting cities
identify improved efciency of operations
as an opportunity arising from climate
change. By measuring emissions and
assessing risks, cities are saving money.
Las Vegas, for example, a city that has
been reporting to CDP since 2008, has
conducted a review of “1,343 vehicles,
592 water meter accounts, 3,333
electrical accounts, 125 waste removal
accounts and more than 1,700,000
square feet of administrative and facility
space across various departments,”
helping the city to identify and address
inefciencies and save money.
14: Measurement - Emissions and Risk
European cities sample: Amsterdam, Barcelona, Berlin, Copenhagen, Hamburg, Helsinki, Istanbul, London, Madrid, Milan, Moscow, Paris, Riga, Rome, Rotterdam, Stockholm, and Warsaw.
Larger cities sample: Amsterdam, Austin, Barcelona, Berlin, Bogotá, Buenos Aires, Changwon, Chicago, Curitiba, Dallas, Durban, Hamburg, Hong Kong, Houston, Istanbul, Jakarta, London, Moscow, New York,
Paris, Philadelphia, Riga, Rio de Janeiro, Rome, Rotterdam, Madrid, Milan, San Diego, San Francisco, São Paulo, Seattle, Seoul, Stockholm, Taipei, Tokyo, Toronto, Vancouver, Warsaw, Washington, and Yokohama.
Smaller cities sample: Copenhagen, Denver, Helsinki, Las Vegas, Miami, Portland, and St. Louis.
North American cities sample: Austin, Chicago, Dallas, Denver, Houston, Las Vegas, Miami, New York, Philadelphia, Portland, San Diego, San Francisco, Seattle, St. Louis, Toronto, Vancouver and Washington.
For sources, see appendix, page 89.
Larger cities
Annual greenhouse gas
emissions per capita in cities
with populations
greater than 1.6 million
High density cities
Annual greenhouse gas
emissions per capita in
cities with more than 4,000
persons per square km
Low density cities
Annual greenhouse gas
emissions per capita in cities
with less than 4,000
persons per square km
$5,400
$7,300
$9,200
$5,300
7.4
tonnes GHG/pc
9.9
tonnes GHG/pc
5.2
tonnes GHG/pc
12.1
tonnes GHG/pc
Smaller cities
Annual greenhouse gas
emissions per capita in cities
with populations
less than 1.6 million
Fig. 5 Impacts of city population and density on greenhouse gas emissions per capita (metric tonnes of CO
2
e/population).
Fig. 6 Economic efciency of greenhouse gas emissions (city GDP in $USD/metric tonnes CO
2
e).
European cities
Annual economic output per
tonne of greenhouse gas
emissions in European cities
Larger cities
Annual economic output per
tonne of greenhouse gas
emissions cities
with populations
greater than 600,000
Smaller cities
Annual economic output per
tonne of greenhouse gas
emissions cities
with populations
less than 600,000
North American cities
Annual economic output per
tonne of greenhouse gas
emissions in
North American cities
Smaller cities sample: Amsterdam, Austin, Changwon, Copenhagen, Dallas, Denver, Helsinki, Kadiovacik, Kaohsiung, Las Vegas, Miami, Milan, Philadelphia, Portland, Riga, Rotterdam, St. Louis, San Diego,
San Francisco, Seattle, Stockholm, Sydney, Vancouver, and Washington.
Low density cities sample: Amsterdam, Austin, Berlin, Changwon, Dallas, Denver, Durban, Hamburg, Helsinki, Houston, Istanbul, Kadiovacik, Las Vegas, Madrid, Portland, Riga, Rotterdam, San Diego,
Seattle, St. Louis, Warsaw, and Washington.
High density cities sample: Barcelona, Bogotá, Buenos Aires, Chicago, Copenhagen, Curitiba, Hong Kong, Jakarta, Kaohsiung, London, Miami, Milan, Moscow, New York, Paris, Philadelphia, Rio de Janeiro,
San Francisco, São Paulo, Seoul, Stockholm, Sydney, Taipei, Tokyo, Toronto, Vancouver, and Yokohama.
Larger cities sample: Barcelona, Berlin, Bogotá, Buenos Aires, Chicago, Curitiba, Durban, Hamburg, Hong Kong, Houston, Istanbul, Jakarta, London, Madrid, Moscow, New York, Paris, Rio de Janeiro, Rome,
São Paulo, Seoul, Taipei, Tokyo, Toronto, Warsaw, and Yokohama.
For sources, see appendix, page 89.
Measurement - Emissions and Risk :15
Copenhagen’s method includes
CO
2
, CH
4
and N
2
O emissions in the
inventory.
Total emissions:
2,515,250 metric tonnes CO
2
e
Year reported:
01 Jan 2010 - 31 Dec 2010
Breakdown
in metric tonnes CO
2
e
Power consumption
1,281,291
Heat consumption
611,830
Heating (individual heating solutions in the commercial sector and homes)
26,602
Heating (individual heating solutions and process heating in the industrial sector)
2,682
City gas for cooking
14,082
Road trafc
378,217
Train trafc (including electronic trains)
44,197
Air trafc
16,141
Ship trafc
44,640
Non-road industry transportation
62,880
Non-road transport garden/household
3,320
Process emissions from industry
205
Solvents
8,421
Land use
135
Landlls
700
Waste water
19,907
Inside Copenhagen’s
city-wide emissions
inventory
Copenhagen Q&A
Please describe your methodology:
The methodology used provides an inventory
of greenhouse gases, divided into sectors. The
sectors are similar to those used for the ofcial
Danish emission inventory (IPCC sectors), and
include: collective power and heating, Individual
heating, mobile sources, transportation and
machinery, industrial processes, solvents,
agriculture, land use, and waste depositing and
wastewater. The inventory is primarily based on
Scope 2 data on heat and power consumption
and Scope 1 data on road trafc.
How did you collect data for this inventory?
The energy companies provide data on the total
consumption of heat (district heating), power
and city gas within the geopolitical border of the
municipality. Trafc volumes are modelled by the
municipality on the basis of trafc counts. Power
and fuel consumption from public train and
metro is provided by the relevant companies.
The consumption from the very limited number
of individual heating solutions (less than 2%)
is modelled on the basis of historical data.
Emissions from landlls and wastewater handling
are calculated on the basis of current and past
production of waste and waste water.
An emission factor for power from the Danish
power grid is provided by the company, which
runs the Danish transmission system, Energinet.
dk. An emission factor for district heating in the
regional district heating system is provided by
the local energy companies. Emission factors
for different types of trafc are provided by the
Danish Ministry of transport.
16: Measurement - Emissions and Risk
Measurement - Emissions and Risk :17
“Performing a local and regional
emissions inventory had the added
benefit of identifying inefficiencies
in operations by tracking data
related to energy consumption,
waste processes and water
consumption at the government
operations and regional levels.
The reviews have helped the City
cut cost and improve operations
through analysis of City facilities,
streetlights, wastewater treatment,
and fleet operations.”
Las Vegas
18: Measurement - Emissions and Risk
Caracas
“We do not yet have an emissions inventory for the entire
metropolitan area of Caracas, and this hinders the possibility
to establish an efcient GHG emission reduction target. Our
goal is to complete the emissions inventory for the entire
metropolitan area of Caracas this year, provided that funds to
do it are available.”
Greater Manchester
We are working to “…adopt a common methodology for
measuring and reporting on carbon emissions to achieve
a consistent and convergent approach to performance
monitoring across Greater Manchester.”
Denver
“Together with our university partners, we developed an
in-house spreadsheet based system that only requires fuel,
energy, and other consumption inputs. The required inputs
are clearly marked so that continuity with future updates
and new staff are considered. With the data, calculations/
conversions, tables, and gures are updated automatically
and can be used in our reports.”
Measurement - Emissions and Risk :19
The vast majority of city governments report
that climate change presents economic
opportunities for their cities. 82% of all
reporting cities identify opportunities,
like green jobs and development of new
business industries in their cities. More
cities identify economic opportunities
than identify economic risks, showing that
city governments have internalized the
economic growth opportunities presented
by the transition to a low-carbon economy.
55% of reporting city governments expect
economic opportunities from climate change
to come in the form of more jobs, and 53%
of city governments are looking forward to
the development of new business industries
within their cities.
In the USA and Canada especially, city
governments report high expectations for green
job growth. Sixteen out of the 21 reporting North
American cities mention green jobs as one of the
potential benets from the transition to a more
resilient, low-carbon economy. Some examples
of North American cities creating green jobs:
Portland’s Clean Energy Works Oregon
program has created a building energy retrot
program supported by $25 million in funding.
The program pays the up-front costs of building
retrots, with the loan repaid on energy bills
over a 20-year period. In its rst two years, the
program provided pay checks to more than
Up close
Economic opportunity:
Focus on green jobs in
North American cities
400 workers and delivered 1,200 home energy
retrots.
St. Louis is creating a Set The PACE St.
Louis program to provide nancing for energy
efciency improvements to privately owned
property in the city. It is anticipated that this
program will generate demand for energy audits
and retrots, and the associated jobs that go in
to providing those services.
Miami recently launched Miami Green Lab
(www.miamigreenlab.org), a community green
resource and green job training center, providing
a variety of education, training and certication
programs.
Vancouver’s “Greenest City Action Plan
(GCAP)” aims to boost the number of ‘green’
jobs through strategies such as creation of
trade, boosting the Green Capital brand to
attract businesses to Vancouver, and partnering
with the six close post-secondary institutions
to create a unique program for students called
the Campus City Collaborative (C3) program to
work in GCAP projects.
20: Measurement - Emissions and Risk
Fig. 7 Number of cities reporting green jobs as an economic opportunity, by region.
North America
of 21 cities
Latin America
of 9 cities
Europe
of 22 cities
Africa
of 9 cities
East Asia
of 7 cities
South Asia / Oceania
of 5 cities
2
5
3
11
16
3
Fig. 8 Expected number of green jobs, by city.
Houston
168,136
expected green jobs
Greater London
200,000
expected green jobs
Fig. 9 Cities reporting economic opportunity vs. economic risk.
82% of cities reporting economic opportunity
67% of cities reporting economic risk
59% of cities report both
Measurement - Emissions and Risk :21
22: Measurement - Emissions and Risk
Oristano
“We think that paying attention to vulnerabilities such
as food and water availability, health and education,
and employment opportunities today will help cities to
reap future benets and impart greater condence and
economic dynamism to the urban population.”
Hamburg
“Hamburg is successfully attracting headquarters of the
wind energy industry.”
Dallas
“More green jobs will continue to be created in the
City of Dallas as reductions in carbon emissions occur.
Many local colleges are initiating new programs to train
workers in green jobs elds.”
“Delivering the [Mayor’s Climate
Change] Strategy could deliver
200k new jobs. We are driving
this forward through our range
of climate change programmes.
These are developing investment
opportunities and business models
that we expect to be replicated by
private sector finance.”
Greater London
Measurement - Emissions and Risk :23