Tài liệu NX0441 - Managing for sustainable Competitive Advantage ppt
Bạn đang xem bản rút gọn của tài liệu. Xem và tải ngay bản đầy đủ của tài liệu tại đây (217.11 KB, 19 trang )
NX0441 - Managing
for sustainable
Competitive
Advantage
N o r t h u m b r i a U n i v e r s i t y
S t u d e n t N a m e : T h a n h K h a n h L i n h T r a n
S t u d e n t I D : w 1 0 0 2 9 3 6 6
G R O U P 3 – T E A M 1
W o r d s c o u n t : 3 , 9 7 6 w o r d s
T u t o r n a m e : T o n y P u r d i e
P r o g r a m m e : M S c o f H o s p i t a l i t y a n d T o u r i s m
M a n a g e m e n t
P a g e | 2
P a g e | 3
“Making a difference to families by offering low cost, high quality economical cars
regardless of price range” is what our company - Northumbria B.L.A.C.K Automotive aims
to provide the customers as well as compete within the European Car Market.
Through our commitment to fuel efficient cars at a reasonable price by focusing on research
and development to improve the quality and efficiency, we aim to become a prestigious
company by gaining a 5% market share in the city car market and a 3% market share in the
luxury car market.
We will meet our challenging to become a profitable company by the third year throughout
the penetration of market with a low cost car, once it is completed, we are going to offer the
same car with new features at a higher profit margin. Along with the low cost car, luxury car
is produced with a limited number to test the market as well as it will be a desirable product,
we will increase production and profit margin to launch our brand name into the luxury
market.
Model Name Produced
Jester 52480
Majestic 5100
Sales £764,212,100
Post Tax Profit -£149,497,113
Bank Balance Before Loan -£247,997,113
Loan Requested £250,000,000
Bank Balance After Loan £2,002,887
P a g e | 4
Northumbria B.L.A.C.K Automotive enters the European Car Market with the 2 main
models are Jester (City Car) and Majestic (Luxury Car) for the first 3 years. We did use
the automation and employees in manufacturing process to increase as well as improve
the productivity throughout the investment in automation in needs. Through 3 years, we
also got loss and profit, but the loss was bigger so we decided to introduce the new model
in year 4 to gain the more market share as well as boost the Car Market with the brand
new product. Actually, we got profit and succeeded with third model – Knight (Large
Car) and unfortunately, we did not achieve the business objectives at all.
!""!"#$
In the beginning, we were going to enter the European Car Market with two models and
target markets are: Jester (target market: 25 – 40 years old) and Majestic (target market:
41 – 55 years old).
The City Car – Jester is predominantly aimed at 25 – 40 years old market and especially
aimed to the couples and young families because of the affordable price, disposable
income and cost control (fuel efficiency) are key factors to drive their purchasing
decision. The low selling price as we decided will be a strategy to establish a
considerable market share and gain a reputation as well.
The Luxury Car – Majestic is aimed at 41 – 55 years old market to be dominated by older
families and high income people. We continue to believe in cost control (fuel efficiency)
as a critical factor to make the effect on customers’ purchasing decision. However,
because of aiming to the high income people, the price is not very important to them as
the quality and benefits we bring to them. Therefore, we are going to add some luxury
options to the car and a better build quality.
P a g e | 5
In
the first year, after we get the actual performances compare to the forecast one, there are
some key performances measures are pointed out as the rationales for our company in year
two decisions as following: (also can be seen in the graphs and table above)
• The both models production are sold as we forecasted. It leads to the market share
we objected also nearly be achieved by 0.94% over 1% in Jester and 0.65% over
0.7% in Majestic.
• Gross Margin for the Jester in actual is 1.21% and Majestic in actual is 10.06%
lower than the forecast because of the cost of sales in actual is higher than what
we expected. The rationale for the loss in gross margin is the increasing in cost of
sales and overheads which caused by the increasing of materials costs, wages,
professional charges and unexpected warranty claims.
• As the forecast we are going to get loss by -£149.97m, however, we get loss by -
£197.20m, increasing of -£47.23m. As we get loss -£180.54m in the operating
profit plus with the interest on Loans £16.66m are also higher than forecast, so, it
leads to the heavier loss in post-tax-profit.
We recognized that the design cost is too high caused by the high option and also the take
up for both models; gross margin is too low based on the flow mark-up. Thus, we aim to
make some changes in year 2 as:
• Increasing labour and mark-up to increasing Gross Margin;
• Increasing in training (we did not spend much on training employees in first year)
and wage from £425 to £450 to motivate workforce to enhance the efficiency
production;
• Increasing car prices to match the mark-up;
• Reducing the R&D as well as continuous improving in build quality for both
model and increasing the promotion due to the higher prices.
% &" '"$%()(*
Forecasted Actual
Year 2 Year 3 Year 4 Year 2 Year 3 Year 4
Model
name
Produced Sold In stock Model
price £
Market share %
Forecast Actual
Jester 52480 52480 0 9995.00 1 0.94
Majestic 5100 5100 0 46995.00 0.7 0.65
P a g e | 6
Operating profit (£m) 32,440 73,220 68,552 15,703 -79.82 211,240
Bank Balance Before
Loan (£m)
8,496 -88,697 -64,774 -51,570 -372,57 -23,070
Bank Balance After
Loan (£m)
4,248 -63,697 -64,774 -51,570 -347,57 -23,070
As can be seen from the table above:
o Operating Profit: in year 2 and 3, our business is not running very well by the
operating profit always lower than we forecasted. However, in year 4, we get
the good performance through the earning profits and market share.
o Bank Balance before Loan and Bank Balance after Loan in 3 years actual have
the fluctuations due to the changing of the funds and investment in each model
as well as the inflation rate is increasing every year.
) '+") !"++'$'
The continuous 3 financial years of our company, we continuously and carefully
monitored the running of the business and its performance with the solutions/
strategies and overall report provided by Board of Management for all functions. We
are going to standing out some key performance measures as the following:
3.1 ##"," ' are increased compare to the first year for each model.
The price we decided was not match the mark-up, thus, it leads to get loss in profit
because low gross margin as well as the design cost too high caused by high options
and the take up for both car do so. Thus, we decide to increase the selling price for
both models in next three years.
However, due to the remain stock of City Car, and the popularity is not high as the
Luxury Car, so, we decide to reduce 4% the price as change the option by sound
system replace for safety package in year four due to the popular of this system
(Safety package: 40, Superior Sound System: 95) and the suitable to the new target
market – under years old that we had changed.
P a g e | 7
The price of Luxury Car continue increasing due to the popular and best-selling, so
the price increase following 38% in year two, 8% in year three and 4% in year four.
In the last year, we are looking for the new model to boost the sales and gain more
profit from the failure in selling City Car caused by increasing stock in year two and
three (18787 cars in stock) of the City Car model. As compare to the options and
selling prices of MLS International Company who also produces the Large Car with
the price is £29640. We decide to add some additional options suit to the target
market and based on our objectives to provide the low cost car with high quality to
attract the customers from new market. At last, we did well with the new model by
sold out 91% of production.
3.2 &+ !" is increased 39% for City Car and 83% for Luxury Car (April
Report).
However, due to the stocks we got in City Car Model, we had reduced the production
by 6% and 29% in year three and four. In contrast, the Luxury Model performance
well as we sold all the production every year, and decide to increase the production as
well as price every year by 18% and 15% in the third and fourth year. The market
share for Luxury Car therefore increases every year and it becomes our key
production to keep up its performance and revenue.
The third model – Knight (Large Car) is produced by 23400 units by the decreasing in
the City Car production to boost the revenue and target to the new market. The third
model also performs well enough by sold out 92% of production.
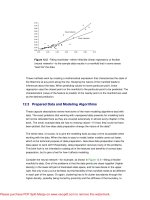
3.3 -''," in the next three years of our company is lower than we forecast as
following graph has shown.
As can be seen in the graph, the gross margin in actual always lower than what we
forecasted for three years business. Compare each year performances; we perform
P a g e | 8
well in the third year and fourth year than the second year which the gross margin
grows up 3.69% and 0.69%. The rationale for the lower gross margin than forecast
is caused by the increasing in cost of sale includes of material costs, wages and
closing stock. However, in the three years, the cost of sales we forecast always
higher than actual but we did get the lower gross margin by actually because of
the low mark-up on the product.
3.4 .!' for each model of our company in four year working is increased
and reach the highest market share for each model in the fourth year.
For the City Car, we do not performance well on it as the Luxury Car does, so, the
market share we aim to achieve in the second year and third year is lower 0.6% and
0.36% than forecasted. However, in the fourth year, after we change an option from
car design as well as the target market to people less than 25 years old, we achieve the
target market objectives by growing 0.3% than forecasted.
For the Luxury Car, it performs very well each year by selling all the production,
which is why we always nearly reach and grows in market share as lower 0.01% in
year 2 and higher 0.03% and 0.09% in year three and four.
For the Large Car, we did not achieve the forecasted market share by the actual is less
than 0.13%.
)/ #'" '
The gap between the actual sales incomes in year two is approximate what we
forecast because of the selling volumes of both models and less stock in City Car by
6,555 units over 66,425 units produced. The gap in year three is higher due to the
P a g e | 9
increasing in production of both car and prices but just only Luxury Car perform well,
thus, we get more stock on City Car by 18,787 units and the sales income is lower
13.6% than forecasted. However, in year three the actual sales income is increased
35.4% than forecasted due to we did not think that Large Car can perform very well
as the City Car boost the new market with sold all production and stock while Luxury
continuous its strengths with all production sold and increases in market share.
)0 '!1!213"!
In year 2, the actual post-tax-profit is increased 51% than we forecasted due to the
increasing the prices to match the mark-up then lead to increasing in gross margin.
In year 3, there are some problems like we change the target market to people less
than 25 years old and the price increased for City Car, it dues to the increasing in
stock of this model. Moreover, we also spend more funds on promotion with 10%
promotional offers, increase in wages and also investment for new model. Thus, the
post-tax-profit is decrease by -£135.191m than we forecasted.
In year 4, we decided to decrease the selling price of City Car to attract the customers
also to introduce the new model – Knight (Large Car) to the market to boost the sales
and gain more market share for the company. We sold all the production of City Car
and Luxury Car, the Large Car also perform well, thus, the post-tax-profit is increased
massively by £113.767m.
3.7 ! ''"!" of our company is fluctuated in every single year as the graph
below shows.
In the first year, our company had to spend a big investment for the both models and
the promotions/ market research/ data on competition. Moreover, we also borrowed
£250m from the bank, which is why the net cash position of our company is -
£298.66m in the end of first year.
However, in the second year, we did not borrow from the bank and change the
strategy by increasing labour and mark-up to increase the gross margin; no design
changes but increase the car prices due to match the mark-up; reduce the R&D but
P a g e | 10
focus more on promotions. This cause the lower 83% than first year, and it means that
we have well performance and control the cash flow of this year which leads to
earning profit by £5.5m.
In the third year, it seems a worst year performance compare to the four year. In this
year, we continue to borrow £25m from the bank to invest for the new model will be
produced in year four, increasing in training, wages to motivate employees as well as
the balance before loans of our company is high by -£372.57m and opening bank
balance is -£51.57m. It shows that the profit we earn still not enough to pay for the
loans and operating the company as though we also increase the selling prices, cut
down the cost for R&D.
In the fourth year, we again did not borrow from the bank and the best-selling for
three models help our company to have the highest net cash position in four year. We
sold all the stock of City Car, the cost of sales also lower than forecast and the
revenue we earn from selling car is high, that why although the opening bank balance
is high as -£347.57m but we still can over the difficulties in last year to boost the net
cash position back to the positive position to make a well performance in selling car
and earning profit for the company.
)4 #&'5+&'
As can be seen from the graph that the shareholders’ fund of our company in each
year is increasing quite good, even year three we got the shareholders’ fund lower
36% compare to year two. It means that the retain profit of our company in the third
year is not good.
P a g e | 11
-
1. Operations Management
According to Waters (2002), operations management is the management function that
is concern with all aspects of operations. The competitive advantage the organization
could gain from good operations management, especially in car manufacturing like:
reduce the development times so that new products can be brought to the market
quickly like what Toyota does (Waters, 2002, p. 23). However, the important element
of operations management especially in the manufacturing car industry is about
“inventory planning and planning” as well as “inventory management and production
planning and scheduling”.
As Silver, A. E., Pyke, F. D., and Peterson, R. (1998) stated that the importance of
inventory management and production planning and scheduling in car manufacturing
is considered as is often the source of innovation, productivity improvements and high
skill jobs. The business cycle is then ready to repeat itself if the warehouses are
restocked with excess inventory which can’t be sold, therefore, it’s going to force the
company to sell out the stock first before invest or innovate the new product lines.
From year two, we got some stock of model one which due to increase the expenses
and overheads. Thus, the operations manager has to make a good judgement and
decision about capacity management as well to reach the demands of customers and
also utilize the capabilities in efficiency ways together with the high quality to reduce
the inventory stocks.
I also suggested the Total Quality Management (TQM) and Just-in-time (JIT) as the
tool to improve the performance as well as to support the inventory management and
production planning and scheduling for product line. According to Tennant (2001),
TQM aims to achieve practically zero defects, reduce variation in output, and
innovative new procedures and processes in manufacturing industry and it also
recognizes the importance of employee. As what we did in the business game, we
always focus on employees by increasing the training every year to increase the
effectiveness in production as well as continuous improving in build quality for both
models to satisfy the customers with the best ones.
2. Marketing Management
P a g e | 12
According to Blyth (2003), the manager has to decide which segment of the market
should targeting to in order to get the benefits of high growth potential or low
competitive pressure to compete with the competitor within the industry. Choosing
wrong segment to target leads to lost opportunities and wasted resources. Afterwards,
we have to make decision on product designs and options based on market research
about customers’ trend, expectation as well as the data of competition. The evidence
for this learning is we targeted the 25-40 years old market for City Car in the first two
year and did not successful in this target market. Thus, we changed the target market
to people less than 25 years old with the small change in car option and at the end of
year four, we sold out all production and also the stock. Besides, positioning is that
the product places in the chosen market, as perceived by the relevant group of
customers. McDonald (2007) supported that the marketing mix involves the tools and
techniques of marketing in order of matching the process positioning company. In this
business game, the marketing mix is applied through some functions as: product
development, pricing strategies, positioning and promotional offers.
Moreover, one thing that I had learnt from the business game is that we cannot make a
judgement or forecast the market just based on the market research or data
competition. Because of the changing all the time of the market and the complex of
market structure so the market will become the imagination situation. Thus, in my
opinion, I suggest that the manager has to have a clearly understanding about the
chosen market, the key influence factors of the industry and market, the alternative
resources as well as to have strategies fit the segmentation or alternative solutions to
solve the problems if occurring to create the sustainable competitive advantages for
the company.
3. Human Resources Management
According to Hill (2005), Human Resources Management presents significant issues
for the analysis and operation of employment relationship. The management of
employees is one of the key elements in the coordination and general management of
work organizations, and the workforce also be considered as the key successful factor
towards the organizations. This statement also affects on and supports our company to
go for a strategy from year two till four to increase the training for employees.
Moreover, Blanchard and Thecker (2010) mentioned that training is considered as the
input by transforming the processes in effective training units into output by the
P a g e | 13
quality employees that meets the organization’s needs. Moreover, training faces
increasing demands to demonstrate results in term of Return On Investment (ROI).
Following the discussion of Stone (2005) that human resources function performs the
“bottom line” for achieving the organization’s objective. In supporting the workforce
to work more effective, we decide to increase the wage every year for £25 by £425 in
the first year and £500 in the fourth year. As the good result we got in every year, the
strike day is low and the company at the fourth year gains the profit by £133.23m.
4. Financial Management
As what we learnt from the financial lectures and seminars, and considering the
benefits about market penetration, our team decided to choose the low cost strategy to
enter the market and compare with other teams. According to Monroe (2003), the low
cost pricing make a desire to win a bigger market share through high volume sales,
and also create the need to discourage new entrants into the market by way of low
margin on sales. This pricing strategy is applied for our team in four year operating
which leads to achieve the objectives of reach 5% and 3% market share of City Car
and Luxury Car model.
Managing Director - CEO
ANDREW
Finance Director
KESAVAN
Marketing Director
BASIL
Human Resources Director
LINH
Operations Director
CORRION
P a g e | 14
Leadership in its traditional form was conceived of as being a personified attribute, and
effective leadership was concerned themselves with protecting teams, motivating teams,
creating elite teams as a well communicator, a good problem solver and initiator changing
within the team and organization. Acceptance and understanding are key issues to be an
effective leader (Samuel M. Natale, Sebastian A. Sora, Seshu B. Kavalipurapu, 2004).
Our company as a team is organized with 4 main functional areas with the leader as a CEO in
the highest position as the following chart:
“A leader is one who knows the way, goes the way, and shows the way” – John C. Maxwell.
As an important role of the leader, so, we decide to nominate Andrew as the Managing
Director because he is always able to identify the needs, develop the action plan, arrange the
time for team meeting, and setting the team objectives for each round to achieve. Moreover,
as the background of a person who has experiences in work, so, he might know well about
what is the organization really face and deal with more than us, just spend time on study and
do not have any experiences about the real working life. Andrew is the idealistic person in
P a g e | 15
term of in every round, he always give the ideas for us to thinking and then explain, improve
and go for the best decision as possible.
Our team use the delegation, empowerment and negotiating skills through this business game
in way of as the Managing Director, Andrew will delegate the tasks of each round to the
suitable person and force us to have the responsibilities to our tasks. Furthermore, we also
can use the negotiating skill in term of exchange some tasks if we do not feel very clear at is
compare to others. We were going to have meeting twice a week to discuss about the results
of the previous round and make the decisions for the next rounds. We play each role based on
the strengths of personalities, so, that why we nominate by self to the suitable role in the
business game as the chart above shows. Everyone works well on their responsibilities and a
task that is why got the profits for the fourth year. Each member has to reach the previous
results, make a personal judgment and comments, then we go to the meeting and express
what we think about the results, what are weaknesses or strengths, what we need to improve
and develop.
As my Belbin Team Role shows that I am a plant and team worker person, so, I found myself
during the game is not absolutely like that. I am quite good at team work, I try to support my
ideas and what I know well though sometimes, I found lack of confident due to English is not
my first language and shy to express my ideas. Moreover, my background major is not about
Finance, it is about Marketing and Business Administration, so, I could not support my team
with the high effectiveness in Financial Management, but I do it well by support the ideas in
Operations Management and Marketing Management as well as my role is Human Resources
Management. I thought that I have to improve my English and feel more confident to express
the ideas to make the team work more effectively next time.
P a g e | 16
The Northumbria B.L.A.C.K Automotive after four year trading in European Car Market get
the profit in the ending of year four with the post-tax-profit is £133.23m. We get loss in the
first year and third year also due to the mark-up we put in each production line is not match
enough to the selling prices we given. However, we recognized what we are weak at and try
to make the best improvement on it to gain the profit in the second year and fourth year. In
conclusion, although we get profits but we did not achieve the objectives of the company by
achieve the 5% and 3% market share for City Car and Luxury Car by the end of year four.
The objectives is unrealistic based on the results we got from each year, It would have been
more realistic to attempt to achieve a total market share of around 3% with three cars, we
aimed to increase market share each year by about 0.2%.
P a g e | 17
Blanchard, P. N. and Thacker, J. W. (2010). Effective Training: systems, strategies, and
practices. New Jersey, Pearson Education, Inc.
Blythe, J. (2003). Marketing Strategy. Berkshire, McGraw-Hill Education.
Cascio, W. and Boudreau, J. (2011). Investing In People: Financial impact of Human
Resource initiatives. New Jersey, Pearson Education, Inc.
Clow, K. E. and Baack, D. (2007). Integrated Advertising, Promotion, and Marketing
Communications. New Jersey, Pearson Education, Inc.
Jain, S. C. (1997). Marketing Planning and Strategy. Cincinnati, Ohio, South-Western
College Publishing.
Haked, C., Ed. (1991). Total Quality Management - They key to business improvement,
Production Engineering Research Association.
Hill, P. (2005). Human Resource Management HR257, Newcastle Business School.
McDonal, M. (2007). Malcolm McDonald on marketing planning: understanding marketing
plans and strategy. London : Philadelphia : Kogan
Monroe, K. B. (2003) Pricing: making profitable decisions. 3rd ed. Boston, Mass.; London :
McGraw-Hill/Irwin 2003
Samuel M. Natale, Sebastian A. Sora, Seshu B. Kavalipurapu, (2004) "Leadership in teams:
managerial responses", Team Performance Management, Vol. 10 Iss: 3/4, pp.45 – 52
Silver, A. E., Pyke, F. D., and Peterson, R. (1998). Inventory Management and Production
Planning and Scheduling. New York, John Wiley & Sons, Inc.
Stone, R. J. (2005). Human Resource Mangement. 5
th
ed. Milton, Qld. ; [Chichester] : John
Wiley & Sons Australia 2005
P a g e | 18
Tennant, G. (2001). Six Sigma: SPC and TQM in Manufacturing and Services. Burlington,
Gower Publishing Company.
Varey, R. J. (2002). Marketing Communication: principles and practice. London Routledge.
Waters, D. (2002). Operations Management: Producing Goods and Services, Pearson
Education Limited
Wexley, K. N. and Latham , G. P. (2002). Developing and Training Human Resources in
Organizations. 3
rd
ed. Pearson Eduction, Inc., Upper Saddle River, New Jersey.
P a g e | 19
6
Year 1 City Car Luxury Car Large Car
Production 52480 5100 0
Sold 52480 5100 0
Unsold Stock 0 0 0
Year 2 City Car Luxury Car Large Car
Production 72980 9350 0
Sold 66425 9350 0
Unsold Stock 9350 0 0
Year 3 City Car Luxury Car Large Car
Production 68880 11050 0
Sold 56648 11050 0
Unsold Stock 18787 0 0
Year 4 City Car Luxury Car Large Car
Production 49200 12750 23400
Sold 67987 12750 21495
Unsold Stock 0 0 1905