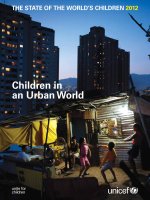
Pneumonia and diarrhoea: Tackling the deadliest diseases for the world’s poorest children ppt
Bạn đang xem bản rút gọn của tài liệu. Xem và tải ngay bản đầy đủ của tài liệu tại đây (5.59 MB, 86 trang )
Pneumonia
and diarrhoea
Tackling the deadliest diseases
for the world’s poorest children
Pneumonia and diarrhoea Tackling the deadliest diseases for the world’s poorest children UNICEF
© United Nations Children’s Fund (UNICEF)
June 2012
Permission is required to reproduce any part of this publication. Permission will be freely granted to
educational or non-prot organizations. Others will be requested to pay a small fee.
Please contact:
Statistics and Monitoring Section – Division of Policy and Strategy
UNICEF
Three United Nations Plaza
New York, NY 10017
USA
Tel: 1.212.326.7000
Fax: 1.212.887.7454
This report will be available at <www.childinfo.org/publications>.
For latest data, please visit <www.childinfo.org>.
ISBN: 978-92-806-4643-6
Photo credits: cover, © UNICEF/NYHQ2010-2803crop/Olivier Asselin; page vi, © UNICEF/NYHQ2004-
1392/Shehzad Noorani; page 6, © UNICEF/INDA2012-00023/Enrico Fabian; page 12, © UNICEF/
NYHQ2011-0796/Marco Dormino; page 19, © UNICEF/UGDA01253/Chulho Hyun; page 23, ©
UNICEF/SRLA2011-0199/Olivier Asselin; page 25, © UNICEF/MLIA2010-00637/Olivier Asselin;
page 29, © UNICEF/NYHQ2006-0949/Shehzad Noorani; page 31, © UNICEF/NYHQ2010-1593/
Pierre Holtz; page 34, © UNICEF/INDA2010-00170/Graham Crouch; page 36, © UNICEF/INDA2010-
00190/Graham Crouch; page 37, © UNICEF/NYHQ2010-3046/Giacomo Pirozzi; page 40, © UNICEF/
NYHQ2012-0156/Nyani Quaryme.
Pneumonia
and diarrhoea
Tackling the deadliest diseases
for the world’s poorest children
This report was prepared at UNICEF Headquar-
ters/Statistics and Monitoring Section by Emily
White Johansson, Liliana Carvajal, Holly Newby
and Mark Young, under the direction of Tessa
Wardlaw.
This report is one of UNICEF’s contributions to
the multistakeholder global initiative that has
been established to develop an integrated global
action plan for prevention and control of pneu-
monia and diarrhoea. We thank Zulqar Bhutta
for his feedback on the report and for his guid-
ance around the forthcoming global action plan.
The authors acknowledge with gratitude the con-
tributions of the many individuals who reviewed
this report and provided important feedback.
Special thanks to Elizabeth Mason, Cynthia Bos-
chi-Pinto, Olivier Fontaine, Shamim Qazi and
Lulu Muhe of the World Health Organization.
The report also beneted from the insights of
Zulqar Bhutta (Agha Khan University), Robert
Black (Johns Hopkins University), Kim Mulhol-
land (London School of Hygiene and Tropical
Medicine), Richard Rheingans (University of
Florida), and Jon E Rohde (Management Sci-
ences for Health).
Overall guidance and important inputs were
provided by numerous UNICEF staff: David
Anthony, Francisco Blanco, David Brown,
Danielle Burke, Xiaodong Cai, Theresa Diaz,
Therese Dooley, Ed Hoekstra, Elizabeth Horn-
Phathanothai, Priscilla Idele, Rouslan Karimov,
Chewe Luo, Rolf Luyendijk, Nune Mangasaryan,
Osman Mansoor, Colleen Murray, Thomas
O’Connell, Khin Wityee Oo, Heather Papowitz,
Christiane Rudert, Jos Vandelaer, Renee Van de
Weerdt and Danzhen You.
The authors would like to extend their grati-
tude to Neff Walker, Ingrid Friberg and Yvonne
Tam (Johns Hopkins University) for produc-
ing the LiST modelling work under a tight
timeline. Thanks also go to Robert Black and Li
Liu (Johns Hopkins University) for providing
the cause of death estimates, Richard Rhein-
gans (University of Florida) for equity analy-
sis on vaccinations, as well as Nigel Bruce and
Heather Adair-Rohani (World Health Organi-
zation) for text and data related to household
air pollution.
Further thanks to Robert Jenkins, Mickey Cho-
pra, Werner Schultink, Sanjay Wijesekera
( UNICEF), and Jennifer Bryce (Johns Hopkins
University) for their guidance and support.
Special thanks to Anthony Lake, UNICEF’s Exec-
utive Director, for his vision in promoting the
equity agenda, which served as the inspiration for
this report.
While this report beneted greatly from the feed-
back provided by the individuals named above,
nal responsibility for the content rests with the
authors.
Communications Development Incorporated pro-
vided overall design direction, editing and layout.
Acknowledgement s
ii
Executive summary 1
1
Pneumonia and diarrhoea
disproportionatelyaffect the poorest 7
2
We know what works 11
3
Prevention coverage 13
Vaccination 13
Clean home environment: water, sanitation,
hygieneandother home factors 15
Nutrition 20
Co-morbidities 22
4
Treatment coverage 24
Community case management 24
Treatment for suspected pneumonia 25
Diarrhoea treatment 30
5
Estimated children’s lives saved by scaling
upkey interventions in an equitable way 38
6
Pneumonia and diarrhoea: a call to action
tonarrow the gap inchild survival 41
Annex 1
Action plans for pneumonia and
diarrhoeacontrol 43
Annex 2
Technical background 45
Notes 49
References 50
Statistical tables
1 Demographics, immunization and nutrition 54
2 Preventative measures and determinants of
pneumonia and diarrhoea 60
3 Pneumonia treatment, by background
characteristic 66
4 Diarrhoea treatment, by background
characteristic 72
Boxes
1.1 Cholera, on the rise, affects the most
vulnerablepeople 9
2.1 The importance of evidence-based
communication strategies for child survival 12
3.1 Disparities in vulnerability and access reduce
theimpact of new vaccines 14
3.2 The importance of improved breastfeeding
practices for child survival 21
4.1 The importance of integrated community case
management strategies 24
4.2 Diarrhoea treatment recommendations 32
5.1 Focus on the poorest children – the example
ofBangladesh 39
6.1 Global action plan for pneumonia and diarrhoea 41
Figures
1.1 Pneumonia and diarrhoea are among the
leadingkillers of children worldwide 7
1.2 Nearly 90per cent of child deaths due to
pneumonia and diarrhoea occur in sub-Saharan
Africa and South Asia 8
1.3 Different patterns of child deaths in high- and
low-mortality countries: Ethiopia and Germany 10
2.1 Many prevention and treatment strategies for
diarrhoea and pneumonia are identical 11
3.1 Progress in introducing PCV globally,
particularlyinthe poorest countries, but a
‘rich-poor’ gap remains 13
3.2 Closing the ‘rich-poor’ gap in the introduction
ofHib vaccine in recent years 14
3.3 Few countries use the rotavirus vaccine, which
islargely unavailable in the poorest countries 15
Contents
iii
3.4 Substantial ‘wealth gap’ in measles vaccine
coverage in every region 15
3.5 Most children not immunized against pertussis
livein just 10 mostly poor and populous
countries 15
3.6 Water, sanitation and hygiene interventions are
highly effective in reducing diarrhoea morbidity
among children under age 5 16
3.7 Use of an improved drinkingwatersource
is widespread, but the pooresthouseholds
oftenmiss out 16
3.8 Most people without an improved water
sourceorsanitation facility live in rural areas 17
3.9 Worldwide, 1.1 billion people still practice open
defecation—more than half live in India 17
3.10 The poorest households in South Asia have
barelybenefited from improvements in
sanitation 17
3.11 Child faeces are often disposed of in an unsafe
manner, further increasing the risk of diarrhoea
inrural areas 18
3.12 New data available on households with a
designated place with soap and water to
washhands 18
3.13 Young infants who are not breastfed are at
greaterrisk of dying due to pneumonia or
diarrhoea 21
3.14 Too few infants in developing countries are
exclusively breastfed 22
3.15 The incidence of low-birthweight newborns
isconcentrated in the poorest regions and
countries 22
3.16 Least developed countries lead the way in
coverage of vitamin A supplementation 23
4.1 Most African countries have a community case
management policy, but fewer implement
programmes on a scale to reach the children
mostin need 25
4.2 Many African countries with a government
community case management programme
reportintegrateddelivery for malaria,
pneumoniaand diarrhoea 26
4.3 Fewer than half of caregivers report fast
ordifficultbreathing as signs to seek
immediatecare 26
4.4 Most children with suspected pneumonia
in developing countries are taken to an
appropriatehealthcare provider or facility 27
4.5 Boys and girls with suspected pneumonia are
taken to an appropriate healthcare provider or
facility at similar rates 27
4.6 Gaps in appropriate careseeking forsuspected
childhood pneumonia exist between rural and
urban areas... 28
4.7 ...and across household wealth quintiles 28
4.8 Every region has shown progress in appropriate
careseeking for suspected childhood pneumonia
over the past decade 29
4.9 Narrowing the rural-urban gap in careseeking
forsuspected childhood pneumonia over the
pastdecade 29
4.10 Across developing countries fewer than
athirdofchildren with suspected pneumonia
receive antibiotics 30
4.11 Children in rural areas are less likely to
receiveantibiotics for suspected pneumonia... 30
4.12 ...as are the poorest children 31
4.13 The lowest recommended treatment coverage
forchildhood diarrhoea is in Middle East and
NorthAfrica and sub-Saharan Africa 32
4.14 Modest improvementin recommended
treatmentfordiarrhoea in sub-Saharan Africa
overthe past decade 33
4.15 UNICEF has procured some 600 million ORS
packets since 2000 33
4.16 Only a third of children with diarrhoea
indeveloping countries receive ORS 33
4.17 Low use of ORS in both urbanand rural
areas of every region 34
4.18 The poorest children often do not receive
ORS to treatdiarrhoea 35
4.19 Use of ORS totreat childhooddiarrhoea has
changedlittle since 2000 36
4.20 No reduction in the rural-urban gap in use of
ORS to treat childhood diarrhoea 36
4.21 Most children with diarrhoea continue to be
fedbut do not receive increased fluids 37
4.22 UNICEF has procured nearly 700 million zinc
tablets since2006 37
5.1 Potential declines in child deaths byscaling
up national coverage to levels intherichest
households 38
Maps
3.1 Household air pollution from solid fuel use is
concentrated in the poorest countries 19
5.1 Scaling up national coverage to the level in the
richest households could substantially reduce
under-five mortalityrates in the highest burden
countries 40
iv
Tables
1.1 Child deaths due to pneumonia and diarrhoea
areconcentrated in the poorest regions... 8
1.2 ...and in mostly poor and populous countries
inthese regions 9
3.1 Undernourished children are at higher risk of
dyingdue to pneumonia or diarrhoea 20
4.1 Limited data suggest low use of zinc to treat
childhood diarrhoea 37
v
argument for tackling two of the leading killers
of children under age 5: pneumonia and diar-
rhoea. By 2015 more than 2 million child deaths
could be averted if national coverage of cost-
effective interventions for pneumonia and diar-
rhoea were raised to the level of the richest 20
per cent in the highest mortality countries. This
is an achievable goal for many countries as they
work towards more ambitious targets such as uni-
versal coverage.
Pneumonia and diarrhoea are leading killers of
the world’s youngest children, accounting for 29
per cent of deaths among children under age 5
worldwide – or more than 2 million lives lost each
year (gure 1). This toll is highly concentrated in
the poorest regions and countries and among the
most disadvantaged children within these societ-
ies.Nearly 90 per cent of deaths due to pneumo-
nia and diarrhoea occur in sub-Saharan Africa
and South Asia.
The concentration of deaths due to pneumo-
nia and diarrhoea among the poorest children
reects a broader trend of uneven progress in
reducing child mortality. Far fewer children are
dying today than 20 years ago – compare 12 mil-
lion child deaths in 1990 with 7.6 million in 2010,
thanks mostly to rapid expansion of basic public
health and nutrition interventions, such as immu-
nization, breastfeeding and safe drinking water.
But coverage of low-cost curative interventions
against pneumonia and diarrhoea remains low,
particularly among the most vulnerable.
There is a tremendous opportunity to narrow
the child survival gap between the poorest and
better-off children both across and within coun-
tries – and to accelerate progress towards the Mil-
lennium Development Goals – by increasing in a
concerted way commitment to, attention on and
funding for these leading causes of death that
disproportionately affect the most vulnerable
children.
We know what needs to be done
Pneumonia and diarrhoea have long been
regarded as diseases of poverty and are closely
associated with factors such as poor home envi-
ronments, undernutrition and lack of access
to essential services. Deaths due to these dis-
eases are largely preventable through optimal
breastfeeding practices and adequate nutri-
tion, vaccinations, hand washing with soap, safe
drinking water and basic sanitation, among
other measures. Once a child gets sick, death is
avoidable through cost-effective and life-saving
treatment such as antibiotics for bacterial pneu-
monia and solutions made of oral rehydration
salts for diarrhoea. An integrated approach
to tackle these two killers is essential, as many
interventions for pneumonia and diarrhoea are
identical and could save countless children’s
lives when delivered in a coordinated manner
(gure 2).
An equity approach could save more
than 2 million children’s lives by 2015
The potential for saving lives by more equitably
scaling up the proper interventions is large. Mod-
elled estimates suggest that by 2015 more than 2
million child deaths due to pneumonia and diar-
rhoea could be averted across the 75 countries
with the highest mortality burden if national
coverage of key pneumonia and diarrhoea inter-
ventions were raised to the level in the richest
20 per cent of households in each country. In
this scenario child deaths due to pneumonia in
these countries could fall 30 per cent, and child
deaths due to diarrhoea could fall 60 per cent
(gure 3). Indeed, all-cause child mortality could
be reduced roughly 13 per cent across these 75
countries by 2015.
Bangladesh provides an important example of
how targeting the poorest compared with better-
off households with key pneumonia and diar-
rhoea interventions could result in far more
lives saved. Nearly six times as many children’s
lives could be saved in the poorest households
Executive summary
1
Vaccination
New vaccines against major causes of pneu-
monia and diarrhoea are available. Many low-
income countries have already introduced the
Haemophilus inuenzae type b vaccine, a clear
success of efforts to close the ‘rich-poor’ gap in
vaccine introduction – exemplifying the possi-
bility of overcoming gross inequalities if there is
a focused equity approach with funding, global
and national leadership and demand creation.
Pneumococcal conjugate vaccines are increas-
ingly available, and there is promise of greater
access to rotavirus vaccine as part of comprehen-
sive diarrhoeal control strategies in the poorest
countries in the near future. Nonetheless, dispar-
ities in access to vaccines exist within countries
and could reduce vaccines’ impact (gure5).
Reaching the most vulnerable children, who are
(roughly 15,400) compared with the richest ones
(roughly 2,800) by scaling up key pneumonia and
diarrhoea interventions to near universal levels
(gure 4). This analysis attaches crude estimates
to a well established understanding: target the
poorest children with key pneumonia and diar-
rhoea interventions to achieve greater child sur-
vival impact.
Are the children at the greatest risk of
pneumonia or diarrhoea reached with
key interventions?
This report is one of the most comprehen-
sive assessments to date of whether children at
the greatest risk of pneumonia and diarrhoea
are reached with key interventions. And the
results are a mix of impressive successes and lost
opportunities.
FIGURE
1
Pneumonia and diarrhoea are among the leading killers of children worldwide
Global distribution of deaths among children under age 5, by cause, 2010
Pneumonia
(postneonatal) 14%
Pneumonia
18%
Other postneonatal
35%
Other neonatal
35%
Other neonatal
35%
Other postneonatal
35%
Diarrhoea
(postneonatal) 10%
Preterm birth
complications 14%
Other 18%
Intrapartum-related
events 9%
Sepsis and
meningitis 5%
AIDS 2%
Injuries 5%
Malaria 7%
Congenital
abnormalities 4%
Tetanus 1%
Other 2%
Meningitis 2%
Pneumonia (neonatal) 4%
Diarrhoea (neonatal) 1%
Measles 1%
Diarrhoea
11%
Note: Undernutrition contributes to more than a third of deaths among children under age 5. Values may not sum to 100 per cent because of
rounding.
Source: Adapted from Liu and others 2012; Black and others 2008.
2
FIGURE
2
Many prevention and treatment strategies for diarrhoea and pneumonia are identical
Diarrhoea
Prevention
Treatment
Pneumonia
Note: A complete list of Child Health Epidemiology Reference Group review papers on the effects of pneumonia and diarrhoea interventions on child
survival is available at www.cherg.org/publications.html. Effectiveness of pneumonia interventions was also recently reviewed by Niessen and
others (2009).
a. Pneumococcal conjugate.
b. Haemophilus influenzae type b.
Source: Adapted from the Global Action Plan for Prevention and Control of Pneumonia and presentations in WHO regional workshops in 2011.
Vaccination:
PCV
a
, Hib
b
, pertussis
Reduced household air
pollution
Antibiotics for pneumonia
Oxygen therapy
(where indicated)
Vaccination:
rotavirus, cholera,
typhoid
Safe water and improved
sanitation
Low-osmolarity ORS, zinc
and continued feeding
Antibiotics for dysentery
Adequate nutrition for
mothers and children
Breastfeeding promotion and support
Measles vaccination
Micronutrient supplementation
(such as zinc, vitamin A)
Hand washing with soap
Prevention and treatment of co-morbidities
(such as HIV)
Improved care-seeking behaviour
Improved case management
at both the community
and health facility levels
FIGURE
3
Potential declines in child deaths by
scalingupnational coverage to thelevels
intherichest households
2015201420132012
Predicted trends in the number of deaths among children under age 5 if
national coverage of key pneumonia and diarrhoea interventions were
raised to the levels among the richest 20 per cent across 75 countries,
2012–2015 (millions)
Source: Lives Saved Tool modelling by Johns Hopkins University Bloomberg
School of Public Health (see annex 2).
0
2
4
6
8
Child deaths due
to pneumonia
Child deaths due
to diarrhoea
Child deaths due
to other causes
5.35.35.35.3
0.5
0.7
0.9
1.2
0.8
0.9
0.9
1.1
6.6
6.8
7.2
7.6
FIGURE
4
In Bangladesh more children’s lives are saved
by targeting the poorest households with key
pneumonia and diarrhoea interventions
Child deaths
due to diarrhoea
Child deaths
due to pneumonia
Total child
deaths
Predicted numbers of deaths averted among children under age 5 if
near universal coverage (90 per cent) of key pneumonia and diarrhoea
interventions were achieved among the poorest and richest 20 per cent in
Bangladesh (thousands)
Note: Averted child deaths due to pneumonia and diarrhoea do not sum to
total averted child deaths because pneumonia and diarrhoea interventions
have an effect on other causes of child mortality.
Source: Lives Saved Tool modelling by Johns Hopkins University Bloomberg
School of Public Health (see annex 2).
Richest 20%
Poorest 20%
0
5
10
15
20
7.8
6.6
15.4
1.8
0.9
2.8
3
FIGURE
5
Substantial ‘wealth gap’ in measles vaccine
coverage in every region
0
25
50
75
100
Developing
countries
a
East Asia
and Pacific
a
Sub-Saharan
Africa
South
Asia
Share of children under one year of age who received a vaccine against
measles, by household wealth quintile and region, 2000–2008 (per cent)
a. Excludes China.
Source: UNICEF 2010, based on 74 of the latest available Multiple Indicator
Cluster Surveys and Demographic and Health Surveys conducted between
2000 and 2008.
Richest 20%
Poorest 20%
FIGURE
6
Young infants who are not breastfed are
ata greater risk of dying due to pneumonia
ordiarrhoea
MortalityIncidenceMortalityIncidence
Relative risk of pneumonia and diarrhoea incidence and mortality for partial
breastfeeding and not breastfeeding compared with that for exclusive
breastfeeding among infants ages 0–5 months
Source: Black and others 2008.
Exclusive breastfeeding
Partial breastfeeding
Not breastfeeding
Infants not breastfed
are 15 times more likely
to die due to pneumonia
than are exclusively
breastfed children
DiarrhoeaPneumonia
1111
11
4
15
2
5
3
22
FIGURE
7
Most people without an improved water
source or sanitation facility live in rural areas
Without access to
an improved
drinking water source
Practicing
open
defecation
Without access
to an improved
sanitation facility
People without an improved sanitation facility, people practicing open defecation
and people without an improved drinking water source, 2010 (millions)
Source: WHO and UNICEF Joint Monitoring Programme for Water Supply
and Sanitation 2012.
Urban
Rural
949
1,796
653
105
714
130
FIGURE
8
Every region has shown progress in
appropriate careseeking for suspected
childhood pneumonia over the past decade
0
25
50
75
100
Developing
countries
a
Middle East
and North Africa
South
Asia
East Asia
and Pacific
a
Sub-Saharan
Africa
Share of children under age 5 with suspected pneumonia taken to an
appropriate healthcare provider or facility, by region, around 2000 and
around 2010 (per cent)
a. Excludes China.
Note: Estimates are based on a subset of 63 countries with available data,
covering 71 per cent of the under-five population in developing countries in
2000 and 73 per cent in 2010 (excluding China, for which comparable data
are not available) and at least 50 per cent of the under-five population in each
region. Data coverage was insufficient to calculate the regional average for
CEE/CIS, Latin America and the Caribbean, and industrialized countries.
Source: UNICEF global databases 2012, based on Multiple Indicator Cluster
Surveys, Demographic and Health Surveys and other national surveys.
2000
2010
54
64
61
59
38
60
69
65
65
50
4
often at the greatest risk of pneumonia and
diarrhoea, through routine immunization pro-
grammes remains a challenge but is essential to
realize the full potential of both new and old vac-
cines alike.
Infant feeding
Exclusive breastfeeding during the rst six
months of life is one of the most cost-effec-
tive child survival interventions and greatly
reduces the risk of a young infant dying due to
pneumonia or diarrhoea (gure 6). Exclusive
breastfeeding rates have increased markedly
in many high-mortality countries since 1990.
Despite this progress, fewer than 40 per cent
of children under 6 months of age in develop-
ing countries are exclusively breastfed. Optimal
breastfeeding practices are vital to reducing
morbidity and mortality due to pneumonia and
diarrhoea.
Water and sanitation
The Millennium Development Goal target on
use of an improved drinking water source has
been met globally as of 2010; a stunning suc-
cess. Yet 783 million people still do not use an
improved drinking water source, and 2.5 bil-
lion do not use an improved sanitation facility,
mostly in the poorest households and rural areas;
90 per cent of people who practice open defeca-
tion, the riskiest sanitation practice, live in rural
areas (gure7). Nearly 90 per cent of deaths due
to diarrhoea worldwide have been attributed to
unsafe water, inadequate sanitation and poor
hygiene. Hand washing with water and soap,
in particular, is among the most cost-effective
health interventions to reduce the incidence of
both childhood pneumonia and diarrhoea.
Treatment for suspected pneumonia
Timely recognition of key pneumonia symp-
toms by caregivers followed by seeking appropri-
ate care and antibiotic treatment for bacterial
pneumonia is lifesaving. Careseeking for chil-
dren with symptoms of pneumonia has increased
slightly in developing countries, from 54 per
cent around 2000 to 60 per cent around 2010.
Sub-Saharan Africa saw about a 30 per cent rise
over this period, driven largely by gains among
the rural population (gure 8). Yet appropriate
careseeking for suspected childhood pneumo-
nia remains too low across developing countries,
and less than a third of children with suspected
pneumonia receive antibiotics. The poorest chil-
dren in the poorest countries are least likely to
receive treatment when sick.
Treatment for diarrhoea
Children with diarrhoea are at risk of dying due
to dehydration, and early and appropriate uid
replacement is a main intervention to prevent
death. Yet few children with diarrhoea in develop-
ing countries receive appropriate treatment with
oral rehydration therapy and continued feeding
(39 per cent). Even fewer receive solutions made
of oral rehydration salts (ORS) alone (one-third),
and the past decade has seen no real progress
in improving coverage across developing coun-
tries (gure 9). Moreover, the poorest children
in the poorest countries are least likely to use
ORS, and zinc treatment remains largely unavail-
able in high-mortality countries. The stagnant
low ORS coverage over the past decade indicates
a widespread failure to deliver one of the most
cost-effective and life-saving child survival inter-
ventions and underscores the urgent need to refo-
cus attention and funding on diarrhoea control.
FIGURE
9
Use of solutions made of ORStotreat
childhood diarrhoea haschangedlittle
since 2000
0
25
50
75
100
Developing
countries
a
East Asia
and Pacific
a
South
Asia
Sub-Saharan
Africa
Middle East
and North Africa
Share of children under age 5 with diarrhoea receiving ORS (ORS packet or
prepackaged ORS fluids), by region, around 2000 and around 2010 (per cent)
a. Excludes China.
Note: Estimates are based on a subset of 65 countries with available data,
covering 74 per cent of the under-five population in developing countries
(excluding China, for which comparable data are not available) and at least
50 per cent of the under-five population in each region. Data coverage was
insufficient to calculate the regional average for CEE/CIS, Latin America and
the Caribbean, and industrialized countries.
Source: UNICEF global databases 2012, based on Multiple Indicator Cluster
Surveys, Demographic and Health Surveys and other national surveys.
2000
2010
30
37
31
24
32
39
31
28
30 30
5
It is time to refocus our efforts on these two
leading killers. This report is a call to action
to reduce child deaths due to pneumonia and
diarrhoea. Doing so would not only reduce the
survival gap between poorest and better-off chil-
dren, but would also accelerate progress towards
eliminating preventable child deaths. This tre-
mendous opportunity to narrow the child sur-
vival gap both across and within countries cannot
be missed. Greater commitment, attention and
concerted global action are needed now on
behalf the most vulnerable children.
Pneumonia and diarrhoea: accelerating
child survival by tackling the deadliest
diseases for the world’s poorest children
This report once again shows what has long been
known: coverage of key pneumonia and diar-
rhoea prevention and treatment interventions is
much lower in the poorest countries and among
the most-deprived children within these coun-
tries – children who often bear a larger share
of child deaths. Child survival impact is thus
reduced when key interventions miss these vul-
nerable children at greatest risk of dying from
pneumonia or diarrhoea.
6
1
Pneumonia and diarrhoea
disproportionately affect the poorest
The world has made substantial gains in child
survival over the past two decades, but progress
has been uneven both across and within coun-
tries.
1
Since 1990 child mortality has become
increasingly concentrated in the world’s poor-
est regions: sub-Saharan Africa and South Asia.
Within most countries the poorest and most-
deprived children are more likely to die before
their fth birthday. Limited data suggest that
even in countries where the national child
mortality rate has declined since 1990, the sur-
vival gap between the poorest and better-off chil-
dren has widened in many cases.
2
Pneumonia and diarrhoea are among the
leading causes of child deaths globally (g-
ure 1.1) – and are perhaps the starkest exam-
ples of the child survival gap. Together, these
diseases cause 29 per cent of child deaths,
more than 2 million a year. Nearly as many
FIGURE
1.1
Pneumonia and diarrhoea are among the leading killers of children worldwide
Global distribution of deaths among children under age 5, by cause, 2010
Pneumonia
(postneonatal) 14%
Pneumonia
18%
Other postneonatal
35%
Other neonatal
35%
Other neonatal
35%
Other postneonatal
35%
Diarrhoea
(postneonatal) 10%
Preterm birth
complications 14%
Other 18%
Intrapartum-related
events 9%
Sepsis and
meningitis 5%
AIDS 2%
Injuries 5%
Malaria 7%
Congenital
abnormalities 4%
Tetanus 1%
Other 2%
Meningitis 2%
Pneumonia (neonatal) 4%
Diarrhoea (neonatal) 1%
Measles 1%
Diarrhoea
11%
Note: Undernutrition contributes to more than a third of deaths among children under age 5. Values may not sum to 100 per cent because of
rounding.
Source: Adapted from Liu and others 2012; Black and others 2008.
7
children died from pneumonia and diarrhoea
in 2010 as from all other causes after the new-
born period – in other words, nearly as much
as from malaria, injuries, AIDS, meningitis,
measles and all other postneonatal conditions
combined.
This staggering toll, however, is not evenly felt
across the world but instead is highly concen-
trated in the poorest settings. The vast major-
ity of deaths due to pneumonia and diarrhoea
occur in the poorest regions – nearly 90 per cent
of them in sub-Saharan Africa and South Asia
(gure 1.2 and table 1.1). About half the world’s
deaths due to pneumonia and diarrhoea occur
in just ve mostly poor and populous coun-
tries: India, Nigeria, Democratic Republic of the
Congo, Pakistan and Ethiopia (table 1.2). Chol-
era, too, is on the rise in many areas and dispro-
portionately affects vulnerable groups living in
fragile settings (box 1.1).
Within countries the child survival gap in deaths
due to pneumonia and diarrhoea is likely sub-
stantial, but much less is known about the causes
of child deaths within most high-mortality coun-
tries. It is known that the poorest and most vul-
nerable children within countries are more often
exposed to pathogens that cause pneumonia and
diarrhoea (for example, through poor sanita-
tion or inadequate water supplies) and are more
likely to develop severe illness (for example, from
undernutrition or co-morbidities).
3
Coverage of
key prevention measures should be higher among
these children, but too often the opposite occurs.
These sicker children are then in greater need of
effective treatment (such as antibiotics for bacterial
TABLE
1.1
Child deaths due to pneumonia and diarrhoea are concentrated in the poorest regions...
UNICEF regions
Deaths among children
underage 5 due to pneumonia
and diarrhoea, 2010
Deaths among children
under age 5 due to
pneumonia, 2010
Deaths among children
under age 5 due to
diarrhoea, 2010
Number
Per cent
of total Number
Per cent
of total Number
Per cent
of total
Sub-Saharan Africa 1,078,000 49 648,000 46 430,000 54
South Asia 851,000 39 550,000 39 300,000 37
East Asia and Pacific 145,000 7 111,000 8 34,000 4
Middle East and North Africa 103,000 5 68,000 5 36,000 4
Latin America and Caribbean 38,000 2 26,000 2 12,000 1
Central and Eastern Europe and the
Commonwealth of Independent States 25,000 1 18,000 1 6,000 1
Least developed countries 894,000 41 545,000 39 350,000 44
Developing countries 2,191,000 >99 1,390,000 >99 801,000 >99
Industrialized countries 2,000 <1 2,000 <1 <1,000 <1
World 2,197,000 100 1,396,000 100 801,000 100
Note: Due to rounding, regional values may not sum to the world total, percentages may not sum to 100 and data in columns 3 and 5 may not sum to the values in column1.
Source: Adapted from Liu and others 2012.
FIGURE
1.2
Nearly 90per cent of child deaths due
to pneumonia and diarrhoea occur in
sub-Saharan Africa and South Asia
Deaths among children under age 5 due to pneumonia and diarrhoea,
by region, 2010
Sub-Saharan Africa
1,078,000
South Asia
851,000
Other regions
268,000
Source: Adapted from Liu and others 2012.
8
TABLE
1.2
...and in mostly poor and populous countries in these regions
Rank Country
Deaths among children under
age 5 due to pneumonia
and diarrhoea, 2010
1 India 609,000
Half of all child deaths
due to pneumonia and
diarrhoea worldwide
Three-quarters of all child
deaths due to pneumonia
and diarrhoea worldwide
2 Nigeria 241,000
3 Democratic Republic of the Congo 147,000
4 Pakistan 126,000
5 Ethiopia 96,000
6 Afghanistan 79,000
7 China 64,000
8 Sudan
a
44,000
9 Mali 42,000
10 Angola 39,000
11 Uganda 38,000
12 Burkina Faso 36,000
12 Niger 36,000
14 Kenya 32,000
15 United Republic of Tanzania 31,000
Rest of the world 537,000
Total 2,197,000
a. Estimates refer to pre-cession Sudan.
Source: Adapted from Liu and others 2012.
BOX
1.1
Cholera, on the rise, affects the most vulnerable people
An estimated 1.4 billion people are at risk of cholera in
endemic countries, with approximately 3 million cases
and about 100,000 deaths per year worldwide. Chil-
dren under age 5 account for about half the cases and
deaths.
1
Large, protracted outbreaks with high case-
fatality ratios are becoming more frequent, reflecting
a lack of adequate preparedness, early detection, pre-
vention and timely access to healthcare. These explo-
sive and deadly outbreaks affect the whole of society,
can disrupt essential services and often require sub-
stantial resources, including emergency response
operations.
Although large cholera outbreaks gain attention, en-
demic cholera routinely accounts for a substantial
share of the global disease burden and is often under-
detected and underreported. Cholera has become en-
trenched in more countries in Africa and has recently
returned to the Americas, with ongoing transmission
in the Dominican Republic and Haiti. And new, more
virulent and drug-resistant strains of Vibrio cholera
are emerging.
2
Cholera affects the most marginalized
populations – those who have the lowest access to es-
sential services such as adequate water, sanitation and
healthcare and who already suffer from poor nutrition.
Cholera is a diarrhoeal disease that can lead to rapid
death if not detected and treated early with solutions
made of oral rehydration salts. Key interventions to
prevent and treat cholera are similar to those for diar-
rhoea outlined in this report and should be scaled up.
In addition, reducing transmission and death from out-
breaks requires specific preparedness and response
activities such as strong national multisector co-
ordination and control structures, comprehensive risk
assessments, enhanced surveillance and early warn-
ing systems, mobilization of communities and policy-
makers, and readily available resources and supplies.
Notes
1. Ali and others 2012.
2. Ad Hoc Cholera Vaccine Working Group 2009.
9
pneumonia and oral rehydration solutions for diar-
rhoea), but are generally less likely to receive it.
4
The child survival gap between the richest and
poorest countries is due largely to a handful of
infections, notably pneumonia and diarrhoea.
Compare, for example, Ethiopia and Germany –
two countries with among the highest and lowest
child mortality rates in 2010. In Ethiopia 271,000
children under age 5 died in 2010 (106 deaths
per 1,000 live births); pneumonia and diarrhoea
caused more than a third of these deaths, and a
large proportion of the remaining deaths were
caused by other preventable and treatable infec-
tions (gure 1.3). In Germany approximately
3,000 children under age 5 died in 2010 (4 deaths
per 1,000 live births), and the vast majority of
these deaths were caused by noncommunicable
diseases and conditions.
Childhood infections left untreated or not
treated appropriately, particularly pneumonia
and diarrhoea, are the main contributors to the
child survival gap between Ethiopia and Ger-
many and between the poorest and richest coun-
tries more generally. Narrowing this gap will take
focused action on these ‘diseases of poverty’ –
particularly pneumonia and diarrhoea – and on
other infections that disproportionately afict
the most-deprived children.
The data presented in this chapter are based on
modelled estimates of childhood pneumonia and
diarrhoea mortality for all countries. Robust data
on the distribution of cases and deaths within
high-mortality countries are largely unavailable.
There is an urgent need to strengthen health
information and vital registration systems in
order to identify the populations at greatest risk
of suffering and dying from pneumonia and
diarrhoea within countries. This information is
critical for control programmes in their drive
to better target high-impact interventions to the
children most in need within countries.
FIGURE
1.3
Different patterns of child deaths in high- and low-mortality countries: Ethiopia and Germany
Note: Country selection was based on high- and low-mortality countries that are not in conflict and with a population greater than 40 million to improve data reliability
and reduce uncertainty around the estimates. The distribution of deaths among children under age 5 by cause in these two countries is comparable to other high- and
low-mortality countries.
Source: Adapted from Liu and others 2012.
Pneumonia
(postneonatal) 18%
Pneumonia
21%
Pneumonia
2%
Diarrhoea
<1%
Diarrhoea
(postneonatal) 13%
Preterm birth
complications 12%
Congenital
anomalies
16%
Preterm birth
complications
22%
Other 17%
Other
36%
Other 10%
Intrapartum-
related events 9%
Intrapartum-
related events 5%
Sepsis and
meningitis 6%
Sepsis and
meningitis 2%
AIDS 2%
Malaria 2%
Injury 6%
Injury 6%
Congenital abnormalities 2%
Other 1%
Meningitis 6%
Meningitis 1%
Pneumonia
(neonatal) 3%
Diarrhoea
(neonatal) 1%
Measles 4%
Diarrhoea
14%
Total deaths among children under age 5: 277,000
Under-five mortality rate: 106 deaths per 1,000 live births
Total deaths among children under age 5: 2,900
Under-five mortality rate: 4 deaths per 1,000 live births
Other
postneonatal
37%
Other
postneonatal
37%
Other
postneonatal
44%
Other
postneonatal
44%
Other
neonatal
30%
Other
neonatal
30%
Other
neonatal
55%
Other
neonatal
55%
Ethiopia
Distribution of deaths among children under age 5, by cause, 2010
Germany
10
2
We know what works
UNICEF, WHO and partners have published
action plans for pneumonia and diarrhoea con-
trol (see annex 1). Many well known child sur-
vival interventions from across different sectors
have a proven impact on reducing pneumonia
and diarrhoea morbidity and mortality (gure
2.1). These interventions require communica-
tion strategies that inform and motivate healthy
actions and create demand for services essential
to pneumonia and diarrhoea control (box 2.1).
FIGURE
2.1
Many prevention and treatment strategies for diarrhoea and pneumonia are identical
Diarrhoea
Prevention
Treatment
Pneumonia
Note: A complete list of Child Health Epidemiology Reference Group review papers on the effects of pneumonia and diarrhoea interventions on child
survival is available at www.cherg.org/publications.html. Effectiveness of pneumonia interventions was also recently reviewed by Niessen and
others (2009).
a. Pneumococcal conjugate.
b. Haemophilus influenzae type b.
Source: Adapted from the Global Action Plan for Prevention and Control of Pneumonia and presentations in WHO regional workshops in 2011.
Vaccination:
PCV
a
, Hib
b
, pertussis
Reduced household air
pollution
Antibiotics for pneumonia
Oxygen therapy
(where indicated)
Vaccination:
rotavirus, cholera,
typhoid
Safe water and improved
sanitation
Low-osmolarity ORS, zinc
and continued feeding
Antibiotics for dysentery
Adequate nutrition for
mothers and children
Breastfeeding promotion and support
Measles vaccination
Micronutrient supplementation
(such as zinc, vitamin A)
Hand washing with soap
Prevention and treatment of co-morbidities
(such as HIV)
Improved care-seeking behaviour
Improved case management
at both the community
and health facility levels
11
BOX
2.1
The importance of evidence-based communication strategies for child survival
Communication strategies to inform and motivate in-
dividual, community and social change (behaviour
change communication) are vital for child survival pro-
grammes. To this end,UNICEF and its partners re-
cently developed the Communication Framework for
New Vaccines and Child Survival to support the in-
troduction of new vaccines for pneumonia and diar-
rhoea as part of a comprehensive package to also
strengthen complementary ‘healthy actions’ for pneu-
monia and diarrhoea control, such as early and ex-
clusive breastfeeding, hand washing with soap,
vaccinations and appropriate care seeking for illness
symptoms, among others (see figure 2.1 in the text).
New vaccines prevent many but not all cases of pneu-
monia and diarrhoea and thus require new commu-
nication strategies not only to promote uptake of
these vaccines, but also to prevent unrealistic com-
munity expectations that could damage immunization
programmes.
This communication framework stresses a structured
approach to guide the design, implementation and
evaluation of a national communication plan for child
survival. Communication is challenging, and there is
more than one way to do it correctly. But it must be
based on the information needs of the intended target
audience, crafted to both inform and motivate, linked
to programme goals, based on sound analysis and re-
search, and structured to include rigorous monitoring
and evaluation.
Source: UNICEF 2011a.
12
highly effective vaccine. By the end of the 1990s
around two-thirds of high-income countries with
data had added the vaccine to their immuniza-
tion schedule, but low-income countries, where
the burden is often highest, have been slower to
do so. In 2006 WHO recommended introducing
the Hib vaccine into all national immunization
programmes, and since then the gap in vac-
cine introduction between low- and high-income
countries has nearly closed (gure 3.2).
Rotavirus vaccine
Rotavirus is the leading cause of severe child-
hood diarrhoea and is responsible for an esti-
mated 40 per cent of all hospital admissions due
to diarrhoea among children under age 5 world-
wide.
1
Rotavirus caused some 420,000–494,000
child deaths in 2008, a large share of them in
sub-Saharan Africa and South Asia, where the
Key prevention measures include vaccinations,
clean home environments (such as those with
safe drinking water and improved sanitation)
and adequate nutrition for mothers and children
(such as through optimal breastfeeding practices
and micronutrient supplementation).
Vaccination
Several vaccines – both new and old – could save
countless children from dying due to pneumonia
or diarrhoea every year. These include vaccines
against leading pneumonia-causing pathogens
(Streptococcus pneumoniae and Haemophilus inuen-
zae type b [Hib]) and rotavirus vaccine for diar-
rhoea, as well as vaccines that prevent infections
that lead to pneumonia or diarrhoea as a compli-
cation (such as pertussis for pneumonia and mea-
sles for both pneumonia and diarrhoea).
Pneumococcal conjugate vaccine (PCV)
Streptococcus pneumoniae (or pneumococcus) is a
leading cause of bacterial pneumonia, menin-
gitis and sepsis in children. In 2007 WHO rec-
ommended introducing PCV into all national
immunization programmes, particularly in coun-
tries with high child mortality.
Progress is being made in introducing PCV glob-
ally, and use has been increasing in the poorest
countries (gure 3.1). By 2011, 13 of 35 low-
income countries with data had introduced PCV,
covering 41 per cent of surviving infants (about
25 million) in low-income countries.More low-
income countries, particularly those with high
pneumonia burdens, urgently need to introduce
PCV into routine immunization programmes.
But introducing a vaccine does not necessarily
translate into high and equitable coverage within
countries, and inequities in uptake greatly reduce
the impact of vaccines (box 3.1).
Hib vaccine
Hib is a leading cause of childhood meningitis
and a major cause of bacterial pneumonia in chil-
dren. Fortunately, Hib is preventable thanks to a
3
Prevention coverage
FIGURE
3.1
Progress in introducing PCV globally,
particularly in the poorest countries,
but a ‘rich-poor’ gap remains
0
25
50
75
100
2011201020092008200720062005200420032002200120001990s1980s
Share of countries that have introduced PCV into the entire country, by
income group (per cent)
Note: Income groups are based on the World Bank July 2011 classification
and are applied for the entire time series (see />about/country-classifications/country-and-lending-groups#Low_income).
Source: WHO Department of Immunization, Vaccines and Biologicals 2011.
Upper
middle income
(52 countries
with data)
Lower
middle income
(54 countries
with data)
In 2007 WHO recommended
introducing the pneumococcal
conjugate vaccine in all national
immunization programmes
High income
(49 countries with data)
Low income
(35 countries
with data)
13
rotavirus vaccine remains largely unavailable.
2
In 2009 WHO recommended introducing rota-
virus vaccine into all national immunization
programmes, and in September 2011 the GAVI
Alliance approved funding to support rollout
of the rotavirus vaccine in 16 developing coun-
tries (gure 3.3). By 2015 the GAVI Alliance and
its partners plan to support more than 40 of the
world’s poorest countries in rolling out the rota-
virus vaccine.
3
Measles and pertussis vaccines
Pneumonia is a serious complication of both
measles and pertussis (or whooping cough) and
is the most common cause of death associated
with these illnesses. An effective vaccine against
measles and pertussis (DTP3) has been available
for decades and has been included in national
immunization programmes worldwide since the
1980s.
There has been substantial progress in reduc-
ing mortality due to measles and pertussis over
the past few decades. Worldwide mortality due
to measles declined from an estimated 535,300
deaths in 2000 to 139,300 in 2010 – a reduc-
tion of 74 per cent.
4
Pertussis remains endemic
BOX
3.1
Disparities in vulnerability and access reduce the impact of new vaccines
New vaccines, such as that for rotavirus, could sub-
stantially reduce child mortality. But to do so, they
must reach the children most in need. In many low-
income countries poor children have several risk fac-
tors for mortality due to pneumonia or diarrhoea, such
as poor nutritional status and less access to timely
treatment. These children are often much less likely
to be reached by routine vaccination in high-mortality
countries.
A study of 25 low-income countries using data from
the most recent Demographic and Health Survey in
each country found that the impact (deaths averted per
1,000 children vaccinated) of introducing rotavirus vac-
cination was up to five times greater for the poorest
wealth quintile than for the richest, due to higher esti-
mated risks of rotavirus mortality, and that cost effec-
tiveness was most favourable for the poorest wealth
quintile, due to its greater burden of rotavirus disease.
However, while some countries have achieved fairly
equitable vaccination coverage across wealth quintiles,
many high-mortality countries have a substantial gap in
coverage between the richest and poorest.
Achieving equitable coverage in these countries (de-
fined here as all quintiles having the same coverage
as the richest) resulted in an 89 per cent increase in
benefits (reduced child mortality from rotavirus) in the
poorest quintile and a 38 per cent increase in benefits
overall. The pattern is particularly notable in the high-
est mortality countries of India and Nigeria. In India
equitable coverage would double the benefits for the
poorest children and increase the benefits 40 per cent
at the national level. In Nigeria equitable coverage
would increase health benefits 400 per cent for the
poorest children and double them at the national level.
While new vaccines hold great promise for reduc-
ing child mortality, closing disparities in access within
high-mortality countries is essential.
Source: Rheingans, Anderson and Atherly 2012.
FIGURE
3.2
Closing the ‘rich-poor’ gap in the introduction
of Hib vaccine in recent years
0
25
50
75
100
2011201020092008200720062005200420032002200120001990s1980s
Share of countries that have introduced the Haemophilus influenzae typeb
vaccine into the entire country, by income group (per cent)
Note: Income groups are based on the World Bank July 2011 classification
and are applied for the entire time series (see />about/country-classifications/country-and-lending-groups#Low_income).
Source: WHO Department of Immunization, Vaccines and Biologicals 2011.
High income
(49 countries with data)
Upper middle income
(52 countries
with data)
Low income
(35 countries
with data)
Lower
middle income
(54 countries
with data)
In 2006 WHO recommended
introducing the Haemophilus
influenzae type b vaccine in
all national immunization
programmes
14
worldwide. An estimated 50 million pertussis
cases occur each year, most of them in develop-
ing countries. In 2008 pertussis caused approxi-
mately 200,000 deaths among children under
age5, mostly among infants.
5
Although coverage of measles and DTP3 vaccines
is high globally (85 per cent for both in 2010),
it varies across and within countries – with the
poorest and most vulnerable children most often
left unvaccinated (gures 3.4 and 3.5).
Clean home environment: water,
sanitation, hygiene and other home
factors
A clean home environment is critical for reduc-
ing transmission of pathogens that cause pneu-
monia or diarrhoea. Access to safe water and to
adequate sanitation is necessary to prevent diar-
rhoea.
Improving home and personal hygiene
helps prevent both pneumonia and diarrhoea.
Other home environment factors, such as house-
hold air pollution and overcrowding, also raise
the risk of childhood pneumonia.
Water, sanitation and hygiene
Nearly 90 per cent of deaths dueto diarrhoea
worldwide have been attributedtounsafe water,
FIGURE
3.3
Few countries use the rotavirus vaccine, which
is largely unavailable in the poorest countries
0
25
50
75
100
2011201020092008200720062005200420032002200120001990s1980s
Share of countries that have introduced the rotavirus vaccine into the entire
country, by income group (per cent)
Note: Income groups are based on the World Bank July 2011 classification
and are applied for the entire time series (see />about/country-classifications/country-and-lending-groups#Low_income).
Source: WHO Department of Immunization, Vaccines and Biologicals 2011.
Low income
(35 countries
with data)
Lower middle income
(54 countries
with data)
In 2009 WHO recommended
introducing the rotavirus
vaccine in all national
immunization programmes
In 2011 the GAVI Alliance
approved grants for 16
countries to roll out the
rotavirus vaccine
High income
(49 countries with data)
Upper middle income
(52 countries with data)
FIGURE
3.4
Substantial ‘wealth gap’ in measles vaccine
coverage in every region
0
25
50
75
100
Developing
countries
a
East Asia
and Pacific
a
Sub-Saharan
Africa
South
Asia
Share of children under one year of age who received a vaccine against
measles, by household wealth quintile and region, 2000–2008 (per cent)
a. Excludes China.
Source: UNICEF 2010, based on 74 of the latest available Multiple Indicator
Cluster Surveys and Demographic and Health Surveys conducted between
2000 and 2008.
Richest 20%
Poorest 20%
FIGURE
3.5
Most children not immunized against
pertussis live in just 10 mostly poor and
populous countries
Children not immunized against pertussis, by country, 2010 (millions)
India
7. 2
Rest of the world
6.0
15% of children
worldwide are
not immunized
against pertussis
Nigeria
1.8
Note: Data are based on children who receive three doses of diphtheria and
tetanus toxoid with pertussis (DTP3) vaccine.
Source: WHO and UNICEF joint estimates of national immunization
coverage (www.childinfo.org) as of 15 July 2011.
Dem. Rep. of the Congo 0.9
Indonesia 0.7
Uganda 0.6
Pakistan 0.5
Afghanistan 0.4
Iraq 0.4
South Africa 0.4
Ethiopia 0.3
15
inadequate sanitation and poor hygiene.
6
Water,
sanitation and hygiene programmes include sev-
eral interventions: promoting safe disposal of
human excreta, encouraging hand washing with
soap, increasing access to safe water, improving
water quality and advancing household water
treatment and safe storage. All these interrelated
elements are important for preventing diarrhoea
(gure 3.6).
Safe water
A recent WHO and UNICEF report announced
that, as of 2010, the Millennium Development
Goal target on safe drinking water has been met,
a stunning success.
7
Since 1990 more than 2 bil-
lion people have gained access to an improved
drinking water source, but many rural house-
holds still lack these services. Some 783 million
people do not have access to an improved drink-
ing water source, 83 per cent of them in rural
areas. In addition to the urban-rural gap, there
are substantial differences between the richest
and poorest households. For example, although
access to an improved drinking water source is
widespread, the poorest households often miss
out (gure3.7).
Basic sanitation
The problem is even greater for sanitation: 2.5 bil-
lion people (37per cent of the world’s population)
do not have access to basic sanitation, almost three-
quarters of them in rural areas. And 90 per cent of
people who practice open defecation, the riskiest
sanitation practice, live in rural areas (gure 3.8).
Among the 1.1 billion people who still practice
open defecation, 83 per cent of them live in 10
mostly poor and populous countries (gure 3.9).
South Asia is home to around 60 per cent of all
people practicing open defecation. Despite the
progress in reducing the practice among better-
off households across South Asia, nearly all peo-
ple in the poorest 20 per cent of households still
practice open defecation (gure 3.10).
FIGURE
3.6
Water, sanitation and hygiene interventions
are highly effective in reducing diarrhoea
morbidity among children under age 5
0
10
20
30
40
Per cent reduction in diarrhoea morbidity, by intervention
a. A more recent meta-analysis by the Child Health Epidemiology Reference
Group in 2010 found a 42 per cent reduction in diarrhoea morbidity among
children under age 5 who washed their hands with soap.
Source: Waddington and others 2009.
Hand
washing
with soap
a
SanitationPoint-of-use
water
quality
Hygiene
education
Point-of-use
water
supply
Source
water
quality
Source
water
supply
37
34
29
27
2121
5
FIGURE
3.7
Use of an improved drinkingwatersource
is widespread, but the pooresthouseholds
oftenmiss out
0
25
50
75
100
CEE/CIS
d
South
Asia
Middle
East and
North Africa
c
Latin America
and the
Caribbean
b
East Asia
and Pacific
a
Sub-Saharan
Africa
Share of population using an improved drinking water source, by household
wealth quintile and region, 2004–2009 (per cent)
a. Excludes China.
b. Unweighted average of 10 countries in the region with available data.
c. Available data cover 51 per cent of the region’s population and exclude
Algeria and Turkey.
d. Available data cover 59 per cent of the region’s population and exclude
the Russian Federation.
Note: The asset index used to classify households into wealth quintiles has
not been adjusted for the drinking water variable that is part of the index.
Source: UNICEF global databases 2012, based on 80 Multiple Indicator
Cluster Surveys and Demographic and Health Surveys conducted between
2004 and 2009.
Richest 20%
Poorest 20%
16
Safe disposal of child faeces
Safe disposal of child faeces is critical to reducing
faecal-oral contamination that facilitates trans-
mission of diarrhoea pathogens. A child’s using a
toilet directly or rinsing a child’s stools into a toi-
let or latrine is considered safe disposal. Across
regions safe disposal is much higher among
urban than rural populations and among richer
than poorer households (gure 3.11).
Hand washing with soap
Hand washing with water and soap is the most
cost-effective health intervention for reducing
the incidence of both pneumonia and diarrhoea
in children under age 5.
8
There is consistent evi-
dence that hand washing with soap at critical
times – including before eating, preparing food
and feeding a child and after using the toilet –
can substantially reduce the risk of diarrhoea.
9
Monitoring correct hand washing behaviour at
these critical times is challenging, and compa-
rable national data on hand washing are scarce,
but Multiple Indicator Cluster Surveys and
Demographic and Health Surveys are increas-
ingly collecting information using proxy or reli-
able indicators on the likelihood of correct hand
washing.
FIGURE
3.8
Most people without an improved water
source or sanitation facility live in rural areas
Without access to
an improved
drinking water source
Practicing
open
defecation
Without access
to an improved
sanitation facility
People without an improved sanitation facility, people practicing open defecation
and people without an improved drinking water source, 2010 (millions)
Source: WHO and UNICEF Joint Monitoring Programme for Water Supply
and Sanitation 2012.
Urban
Rural
949
1,796
653
105
714
130
FIGURE
3.9
Worldwide, 1.1 billion people still practice
open defecation—more than half live in India
Distribution of global population practicing open defecation, by country, 2010
(millions)
India
626
Rest of the world
183
Indonesia 63
Source: WHO and UNICEF Joint Monitoring Programme for Water Supply
and Sanitation 2012.
Pakistan 40
Ethiopia 38
Nigeria 34
Sudan 19
Nepal 15
China 14
Niger 12
Burkina Faso 10
FIGURE
3.10
The poorest households in South Asia
have barely benefited from improvements
insanitation
Share of population using improved and unimproved sanitation facilities and
practicing open defecation in Bangladesh, India and Nepal, by household
wealth quintile (per cent)
Note: The analysis is based on population-weighted averages. Patterns in
individual countries may vary from the regional pattern. The asset index
used to classify households into wealth quintiles has not been adjusted for
the sanitation variable, which is part of the index.
Source: WHO and UNICEF Joint Monitoring Programme for Water Supply
and Sanitation, based on 1993, 1999 and 2006 National Family Health
Surveys in India; 1993, 1997, 2000, 2004 and 2007 Demographic and Health
Surveys in Bangladesh; and 1996, 2001 and 2006 Demographic Health
Surveys in Nepal.
0
25
50
75
100
2008
1995
2008
1995
2008
1995
2008
1995
2008
1995
Improved
Unimproved
Open
defecation
Poorest 20% Second 20% Middle 20% Fourth 20% Richest 20%
17