mpact of goods distribution system on financial performance the case of minh thai co , LTD
Bạn đang xem bản rút gọn của tài liệu. Xem và tải ngay bản đầy đủ của tài liệu tại đây (1.46 MB, 69 trang )
VIETNAM NATIONAL UNIVERSITY, HANOI
INTERNATIONAL SCHOOL
***************
PHAM VAN NHUNG
IMPACT OF GOODS DISTRIBUTION
SYSTEM ON FINANCIAL PERFORMANCE:
THE CASE OF MINH THAI Co., LTD
MASTER THESIS
HA NOI - 2021
VIETNAM NATIONAL UNIVERSITY, HANOI
INTERNATIONAL SCHOOL
***************
PHAM VAN NHUNG
IMPACT OF GOODS DISTRIBUTION SYSTEM ON
FINANCIAL PERFORMANCE: THE CASE OF
MINH THAI Co., LTD
TÁC ĐỘNG CỦA HỆ THỐNG PHÂN PHỐI HÀNG
HÓA ĐẾN HIỆU QUẢ TÀI CHÍNH: TÌNH HUỐNG
TẠI CƠNG TY TNHH MINH THÁI
Major: Financial Management
Code: 8340202.01QTD
MASTER THESIS
Supervisor: PhD.Mai Anh
HA NOI - 2021
DECLERATION
I hereby declare that this is my graduation thesis. The results in my graduation thesis are
true and have never been published in any other study. I hereby declare that this Master
thesis entitled “IMPACT OF GOODS DISTRIBUTION SYSTEM ON FINANCIAL
PERFORMANCE: THE CASE OF MINH THAI Co., LTD ” was carried out by me
for the degree of Master of Financial Management under the guidance and supervision of
PhD Mai Anh – Head of Office of Academic Affairs of International School, Vietnam
National University, Hanoi
The interpretations put forth are based on my reading and understanding of the original
texts and they are not published any where in the form of books, monographs or articles.
The other books, articles and websites, which I have made use of are acknowledged at
the respective place in the text. For the present thesis, which I am submitting to the
University, no degree or diploma or distinction has been conferred on me before, either
in this or in any other University.
Hanoi, August 2021
Pham Van Nhung
1
ABSTRACT
Thesis Title: Impact of goods distribution system on financial performance: case of Minh
Thai Co., Ltd
Pages:67
University:International School - Vietnam National University
Date:August, 2021
Degree:Master
Researcher:Pham Van Nhung
Advisor:PhD. Mai Anh
The thesis focuses on researching and examining the effects of the goods distribution
system on the financial performance of Minh Thai Co., Ltd. in the period 2018 - 2020, as
well as the means to achieve innovation and financial performance . Data used in the
analysis in the thesis in addition to the company's report data, there are also 150
questionnaires to conduct the survey at Minh Thai Co., Ltd. This study proves that
internal factors are directly related to the financial performance of the company and
indirectly related to the distribution system. The company needs to have solutions to
improve the problems affecting the distribution system to improve financial efficiency.
This study wishes to contribute to understanding the premises and results of distributed
systems by providing empirical evidence on distribution forms at Minh Thai Co., Ltd. to
improve financial performance.
Keywords: Financial performance; Distribution system.
2
ACKNOWLEDGEMENT
During the time of preparing and completing my thesis, I received numerous
support and encouragement from many people. This is hereby to express my sincere
gratitude to them.
First and foremost, I would like to give my sincere thanks to the lecturers,
especially to my supervisor Dr. Mai Anh for their devoted attention, lessons and guidance,
which have equipped me with key knowledge and essential skills throughout the course.
More importantly, everything I have learned here would undoubtedly help me
tremendously in my work.
Second, I wish to express my gratefulness to my colleagues at Minh Thai Co., Ltd
for their enthusiastic support and creating favorable conditions for me to have more useful
information to complete this thesis
I would also like to thank International School - Vietnam National University, for
useful supports during studying and researching to complete this paper. This course has
equipped and improved and added a lot of knowledge about the different areas. In
addition, the course also helps me to have a relationship, have the opportunity to share
information and learn from other students in the program.
Sincere thanks
Pham Van Nhung
3
CONTENTS
DECLERATION .................................................................................................................. 1
ABSTRACT ......................................................................................................................... 2
ACKNOWLEDGEMENT ................................................................................................... 3
LIST OF TABLES................................................................................................................ 6
LIST OF FIGURES .............................................................................................................. 7
LIST OF ABBREVIATIONS .............................................................................................. 7
CHAPTER 1: INTRODUCTION......................................................................................... 8
1. 1. Background of the study ............................................................................................... 8
1.2. Questions of thesis ......................................................................................................... 9
1. 3. Objectives and scope of thesis ...................................................................................... 9
1.4. Research Methods.......................................................................................................... 9
1.5. The structure of study ................................................................................................. 11
CHAPTER 2: LITERATURE REVIEW............................................................................ 12
2.1. Financial performance ................................................................................................. 12
2.1.1. Definition of financial performance ..................................................................... 12
2.1.2. The indicators for evaluating the financial performance ...................................... 13
2.1.3. The meaning of financial performance ................................................................. 16
2.2. Distribution Systems ................................................................................................... 16
2.2.1. Definition of Distribution Systems ....................................................................... 16
2.2.2. Distribution System and Distributor ..................................................................... 17
2.2.3. Functions and Role of Distribution System .......................................................... 17
2.3. Relationship of Distribution system and financial performance in business activities ....... 19
CHAPTER 3: RESEARCH METHODS.......................................................................... 21
3.1. Research Methods........................................................................................................ 21
3.2. Hypotheses................................................................................................................... 21
3.3. Designing questionnaire .............................................................................................. 22
3.4. Sample and Data Collection ........................................................................................ 23
3.5. Analyzing data plan ..................................................................................................... 23
3.6. Reliability analysis by Cronbach’s alpha .................................................................... 25
3.7. Exploratory factor analysis (EFA) ............................................................................... 25
3.8. Regression analysis...................................................................................................... 26
CHAPTER 4. RESULTS AND FINDINGS ...................................................................... 28
4
4.1. Overview about Minh Thai Co. Ltd ............................................................................ 28
4.2. Analysis of financial performance of Minh Thai Company Limited in the period of
2018 - 2020 ......................................................................................................................... 30
4.2.1. Analyze business results ....................................................................................... 30
4.3. Research results and analysis ...................................................................................... 39
4.3.1. Data description .................................................................................................... 39
4.3.2. Reliability analysis and scale .................................................................................. 2
4.4. Exploratory Factor Analysis .......................................................................................... 5
4.4.1. Exploratory Factor Analysis of Affecting Factors Scale ........................................ 5
4.4.2. Exploratory Factor Analysis of the financial performance Scale ........................... 9
4.5. Regression Analysis .................................................................................................... 10
4.5.1. Regression Analysis.............................................................................................. 10
4.5.2. Research model and hypotheses tested result ....................................................... 14
CHAPTER IV: RESULTS AND FINDINGS .................................................................... 16
5.1. Assessment of the financial performance through the distribution system at Minh
Thai Co.,Ltd ........................................................................................................................ 16
5.2. The affecting factors on the performance of finance activities at Minh Thai Co.,Ltd 16
5.3. Suggestions to improve the financial performance at Minh Thai Co.,Ltd .................. 17
5.3.1. Improve the inventory........................................................................................... 17
5.3.2. Improve the operating expense ............................................................................. 17
5.3.3. Improve the average collection period ................................................................. 18
CONCLUSION .................................................................................................................. 20
REFERENCES ................................................................................................................... 21
APPENDIX A: QUESTIONAIRE – VIETNAMESE VERSION ..................................... 23
APPENDIX B: QUESTIONAIRE – ENGLISH VERSION ............................................. 25
5
LIST OF TABLES
Table 3.1
Hypotheses
Table 3.2
Encoded Data
Table 4.1.
Minh Thai’s key performance indicator in the period of 2018-2020
Table 4.2
Revenue growth of Minh Thai Company Limited from 2018 – 2020
Table 4.3
The revenue stucture from sale of Minh Thai Co.,Ltd from 2018 –
2020
Table 4.4
Profit growth of Minh Thai Co., Ltd in the period of 2018 – 2020
Table 4.5
Structure of the company's profit before tax from 2018 – 2020
Table 4.6
The ability to generate profits of Minh Thai Co., Ltd from 2018 –
2020
Table 4.7
The performance of using asset of Minh Thai Co.,Ltd from 2018 –
2020
Table 4.8
The influence of factors on the efficiency of using fixed assets of
the company in the period of 2018-2020
Table 4.9
The influence of factors on the efficiency of using short-term
assets of the company in the period of 2018-2020
Table 4.10
The profitability of Minh Thai Co.,Ltd in the period 2018 – 2020
Table 4.11
The influence of factors on the profitability of assets at Mainh
Thai Co.,Ltd in the period 2018-2020
Table 4.12
The influence of factors on the ratio on sales at Minh Thai Co.,Ltd
in the period 2018-2020
Table 4.13
The influence of factors on the profitability of equity at Minh Thai
Co.,Ltd in the period 2018-2020
Table 4.14
The indicators of financial performance at Minh Thai Co., Ltd in
the period 2018 – 2020
Table 4.15.
Descriptive Analysis
Table 4.16
Reliability of scale
Table 4.17
Exploratory Factor Analysis of affecting factors to the financial
performance at Minh Thai Co.,Ltd
Table 4.18
Reliability statistics and exploratory factor analysis of affecting
factors to the financial performance, 2nd time
Table 4.19
Exploratory Factor Analysis of the Financial performance Scale
6
Table 4.20
Partial correlation of regression coefficients – 1st time
Table 4.21
Partial correlation of regression coefficients – 2nd time
Table 4.22
Adjusted R square
Table 4.23
ANOVA analyzing
Table 4.24
The result of regression coefficients model – 2nd time
Table 4.25
Hypotheses Tested Results
Table 5.1
The financial performance at Minh Thai Co.,Ltd
LIST OF FIGURES
Figure 2.1
Dupont analysis model
Figure 2.2
Financial coefficient tower model
Figure 3.1
Hypotheses
Figure 4.1
Overview of the distribution system of Minh Thai Co., Ltd.
Figure 4.2
Research module result
LIST OF ABBREVIATIONS
ROA
Return on Assets
ROE
Return on Equity
ROS
Return on Sales
ACOP
Average Collection Period
CPVs
Critical Profit Variables
INV
Inventory
SAG
Sales growth
OPEX
Operating expense
ACOP
Average collection period
FP
Financial performance
7
CHAPTER 1: INTRODUCTION
1. 1. Background of the study
In order to stand firmly in the market and constantly develop under increasingly
competitive conditions and scarce resources, a business needs to make effective use and
evaluate their efficiency in using resources. Among businesses, financial resources are
always number one. The financial resources to ensure the business operations to achieve
the goals. Or understand correctly, financial resources are the ability to mobilize capital to
meet the business’ activities and the ability to ensure financial safety of the business.
From the perspective of capital management, the financial structure of the business is the
ratio between Debt and Equity. A financial structure is considered optimal when the
average cost of capital is lowest, and at the same time the maximum value of the business.
Corporate financial efficiency is the efficiency of mobilizing, using and managing capital
in business (Truong Ba Thanh and Tran Dinh Khoi Nguyen, 2001). In order to assess
whether the financial structure of a business is optimal or not, whether to bring maximum
value in financial performance or not, it is necessary to have targets to measure and
evaluate financial indicators and financial performance. logically.
The relationship between distribution system and financial performance of a business was
very positive and getting a lot of attention from academics. Anderson et al. (1997)
suggests that the good performance of the distribution can reduce costs, increase revenue
and efficiency and effectiveness of business assets used. Better distribution system can
assist the business in maintaining its relationship with customers by reducing cycle time
required (Lambert and Pohlen, 2001). Other studies supporting the relationship between
distribution and financial performance concluded that the cost of inventory and the quality
very big influence on retail agencies (Schramm-Klein and Morschett, 2006). Meanwhile,
research Shang and Marlow (2005) concluded that the financial performance of
manufacturing firms increased due to their distribution system are improved. Thus, the
company can have more benefits from the improvement of logistics performance.
Some problems in the distribution network might occur, such as, production, inventory
locations, and the placement of the warehouse. Therefore, the decision- making process
should take into account all the factors and improve coordination with all entities in order
to improve business performance, the author chooses the topic: Impact of goods
distribution system on financial performance: case of Minh Thai Co., Ltd” in order to
propose suggestions to further improve the business results of the business as a research
topic for my graduation thesis.
8
The graduation thesis focuses on research to achieve the following purposes:
-
Systematize the basic theoretical issues about financial performance of a company.
-
Research, analyze and evaluate the current state of financial performance at Minh
Thai Co.,Ltd through the targets in finance.focusing on results of the period for
2018-2020.
-
The analysis focuses on four critical profit variables (CPVs): 1) Sales growth, 2)
Inventory turnover, 3) The operating expense percentage, 4) The average
collection period (often called the days sales outstanding). These are the factors
that combine to produce profit for a business
- Findings some solutions to improve financial efficiency more and more associating
with the distribution system
1.2. Questions of thesis
- How the distribution system affect on the financial performance at Minh Thai Co.,Ltd ?
- What are the main elements of distribution system affecting on the financial
performance at Minh Thai Co.,Ltd ?
- What are solutions to improve the financial performance through distribution system at
Minh Thai Co.,Ltd ?
1. 3. Objectives and scope of thesis
The organization structure of a business is one factor to achieve more profit. This
structure has low impact on profit (Pelham and Wilson, 1996). However, there have
several scholars concluded that distribution system has positive impact on business
performance (Liu and Ma, 2005; Cho et al.,2008). The five determinants of distribution
are linked to financial performance. Therefore, the conceptual model is developed to
identify the study for these reasons, the hypotheses are:
H1. Sales growth will be positively related to financial performance of Minh Thai Co.,Ltd
H2. Inventory will be positively related to financial performance of Minh Thai Co.,Ltd
H3. The operating expense percentage will be positively related to financial
performance of Minh Thai Co.,Ltd
H4. The average collection period will be positively related to financial
performance of Minh Thai Co.,Ltd
1.4. Research Methods
The data were collected from agencies of Minh Thai Co., Ltd in Hai Dong province of
Vietnam to test hypotheses. There were 115 questionnaires sent out, 10 of which were
returned due to not full completed so that the result of overall response rate more of 99
9
percent. This response rate is considered high because most of the agencies are willing to
participate in this study. In terms of sample characteristics, the average of working period
for their business is 3 years. The type of business of agencies involve in this study include
beverage. This study adapted 5-item Likert type scale. The primary data collection for this
study was quantitative method which focus on survey. The questionnaires in this study
were designed with based on literature review. The questionnaires were delivered to one
key respondent in each agencies. Most of the respondents are the owners due to small
structure of organization.
Through the questions on the survey, the author has eliminated conflicting answers to
be able to give relatively reliable survey results to assess the current situation of using
indicators to evaluate effectiveness financial results at Minh Thai Co., Ltd.
In order to answer the three main questions ò the study, the author uses following methods
for data collecting and analyzing:
Secondary data: According to Saunders et al. (2009), secondary data is the
information which is collected from public resources such as books, journals, and the
articles is collected by previous researchers in line with current studies’ objectives. Major
advantage of secondary data is less time consuming and lower effort to collect to the
researchers (Srivastava and Rego, 2011). In this study, secondary data is collected from
annual reports and actual data of business at Minh Thai Co.,Ltd which are about financial
concepts as well as previous empirical evidences about the impacts of Sales growth; Gross
margin percentage; Inventory turnover;
Operating expense percentage; Average
collection period.to the financial performance. Figures were collected from annual reports
at Minh Thai Co.,Ltd in the period from 2018- 6/2020.
Primary data collection and analysis: Primary data is considered as the information
that is self-collected by the researchers without reliance on public sources (Guffey et al.,
2010). According to Saunders et al. (2009), primary data has the advantage of directly
supporting the studies but the researchers often take time to collect this information. In
this study, primary data is collected through surveys of questionnaire with relevant
respondents. In more detailed, a survey of questionnaire is established to collect the
assessment from agencies of Minh Thai Co.,Ltd and their assessments are made up in
term of Sales growth; Gross margin percentage; Inventory turnover; Operating expense
percentage; Average collection period. These quantitative data would be processed by
software SPSS version 21.0 with methods such as reliability test Cronbach Alpha,
10
exploratory factor analysis, one-way ANOVA and multiple linear regression analysis. The
author found out solutions to attain the above objectives.
1.5. The structure of study
Chapter 1: Introduction - This is to provide brief introduction about background
of the study, purpose, objects and scope of study
Chapter 2: Literature review - This chapter is aim to provide literature review
about theories of study
Chapter3: Research methods - This chapter will provide methodologies to match
with the study and objectives; Analys the current situation at Minh Thai Co., Ltd
Chapter 4: Results and Findings. This chapter will show the results and findings after
researching at Minh Thai Co., Ltd.
Chapter 5: Solutions. This chapter will propose some recommendations for improving
the financial performance at Minh Thai Co., Ltd.
11
CHAPTER 2: LITERATURE REVIEW
According to the several previous standard studies, the company finacial performance can
be divided into three types: operational, financial and stratergic performance. The The
operaional performance is more relative to improvement of the organization activities,
such as logistics cost reduction, on-time delivery, inventory turnover, and circle time
reduction. The company’s financial performance is measured based on the relationship
between total revenue and cost that can by proxy by profitability, return-on-investment,
and return-on-sales. Finally, the strategic performance is the improvement of market goals,
such as sales, market shares, growth in sales and market share. In this study, I focus on the
company financial performance as dependent variables to evaluate the rolls of distribution
system.
2.1. Financial performance
2.1.1. Definition of financial performance
According to Investopedia “Financial performance is a subjective measure of how well a
firm can use assets from its primary mode of business and generate revenues. The term is
also used as a general measure of a firm's overall financial health over a given period. The
financial performance identifies how well a company generates revenues and manages its
assets,
liabilities,
and
the
financial
interests
of
its
stakeholders”
( />Based on the definition we see that evaluating your business's financial performance is
indispensable that any business owner, investment advisor, finance officer, manager and
investor needs to make smart decisions for the long-term development of his business.
• The first point of view: Corporate financial efficiency refers to the efficiency of
mobilizing, managing and using capital in the business process.
• The second point of view: Financial efficiency is the efficiency of capital mobilization.
Meanwhile, the efficiency of management and use of capital belongs to business
efficiency.
Either way, financial performance reflects the relationship of the economic benefits an
enterprise receives and the costs it must spend to obtain such economic benefits.
The nature of corporate finance is monetary relationships directly associated with the
organization, mobilization, distribution, use and management of capital in the business
process.
12
2.1.2. The indicators for evaluating the financial performance
There are three indicators used commonly to reflect the core problems of corporate
financial performance. Includes: Return on total assets (ROA), Return on sales (ROS),
Return on equity (ROE).
2.1.2.1. Return on total assets (ROA): this is a profitability ratio that provides how
much profit a company is able to generate from its assets. In other words, return on assets
(ROA) measures how efficient a company's management is in generating earnings from
their economic resources or assets on their balance sheet. ROA is shown as a percentage,
and the higher the number, the more efficient a company's management is at managing its
balance sheet to generate profits.
The
formula
for
ROA
is:
ROA=
Net Income/Average Total Assets
2.1.2.2. Return on sales (ROS)
This is a financial ratio that calculates how efficiently a company is generating profits
from its top-line revenue. It measures the performance of a company by analyzing the
percentage of total revenue that is converted into operating profits. ROS is a measure of
how efficiently a company turns sales into profits. Therefore, ROS is used as an indicator
of both efficiency and profitability. Investors, creditors, and other debt holders rely on this
efficiency ratio because it accurately communicates the percentage of operating cash a
company makes on its revenue and provides insight into potential dividends, reinvestment
potential, and the company's ability to repay debt. ROS is used to compare current period
calculations with calculations from previous periods. This allows a company to conduct
trend analyses and compare internal efficiency performance over time. It is also useful to
compare one company's ROS percentage with that of a competing company
The
formula
for
ROS
is:
ROS=
Profit/
Net
sales
2.1.2.3. Return on equity (ROE)
This is a ratio that provides investors with insight into how efficiently a company (or more
specifically, its management team) is handling the money that shareholders have
contributed to it. In other words, it measures the profitability of a corporation in relation to
stockholders’ equity. The higher the ROE, the more efficient a company's management is
at generating income and growth from its equity financing. ROE is often used to compare
a company to its competitors and the overall market. The formula is especially beneficial
when comparing firms of the same industry since it tends to give accurate indications of
which companies are operating with greater financial efficiency and for the evaluation of
nearly any company with primarily tangible rather than intangible assets.
13
The formula for ROE is: ROE= Net Income/ Shareholder equity
2.1.2.4. Some other indicators
In addition to the three commonly used ROA, ROS, and ROE indicators, to evaluate the
financial performance of an enterprise, we can also use a number of other indicators such
as:
Solvency ratio
A solvency ratio is a key metric used to measure an enterprise’s ability to meet its longterm debt obligations and is used often by prospective business lenders. A solvency ratio
indicates whether a company’s cash flow is sufficient to meet its long-term liabilities and
thus is a measure of its financial health. It can indicate the likelihood that a company will
default on its debt obligations. The main solvency ratios are the debt-to-assets ratio, the
interest coverage ratio, the equity ratio, and the debt-to-equity ratio.
A solvency ratio is one of many metrics used to determine whether a company can stay
solvent in the long term. This is a comprehensive measure of solvency, as it measures a
firm's actual cash flow, rather than net income, by adding back depreciation and other
non-cash expenses to assess a company’s capacity to stay afloat.
The formula for solvency = Total asset value / Total liabilities
The asset turnover ratio
It measures the value of a company's sales or revenues relative to the value of its assets.
The asset turnover ratio can be used as an indicator of the efficiency with which a
company is using its assets to generate revenue. The higher the asset turnover ratio, the
more efficient a company is at generating revenue from its assets. Conversely, if a
company has a low asset turnover ratio, it indicates it is not efficiently using its assets to
generate sales.
Asset turnover is the ratio of total sales or revenue to average assets.
This metric helps investors understand how effectively companies are using their assets to
generate sales.
The formula for asset turnover = Total Sales/ Average total assets
Inventory turnover ratio
Inventory turnover is the rate at which a company replaces inventory in a given period due
to sales. Calculating inventory turnover helps businesses make better pricing,
manufacturing, marketing, and purchasing decisions. Well-managed inventory levels
show that a company's sales are at the desired level, and costs are controlled. The
14
inventory turnover ratio is a measure of how well a company generates sales from its
inventory
Inventory includes all the goods a company has in its stock that will ultimately be sold.
Inventory turnover indicates the rate at which a company sells and replaces its stock of
goods during a particular period.
The formula for inventory turnover = Cost of Goods Sold / Average Inventory (for the
same period)
Average collection period
It is a measure of how many days it takes a firm, on average, to collects its receivables. It
indicates the efficiency of the collection process and the lower it is the shorter the cash
cycle of the business is, which has a positive impact on its profitability.
The formula for Average Collection Period (ACP) = 365 / Accounts Receivable Turnover
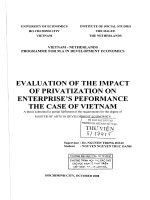
The Du Pont financial analysis model is a useful method of illustrating the relationships
between asset turnover ratio, operating profit margin ratio, return on assets, and return on
equity.
Figure 2.1: Dupont analysis model
(Source: />The strength of this model is a clear hierarchical structure, combining
indicators at different levels and becoming a "lever" to push managers to find
ways to improve efficiency to achieve financial indicators
15
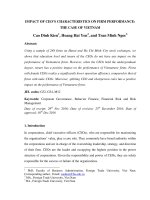
Figure 2.2: Financial coefficient tower model
(Source: Neely, 2007) [58, tr.14]
2.1.3. The meaning of financial performance
Financial performance of the business is a matter of concern for both internal and external
investors as well as stakeholders. Indeed, through the evaluation of financial performance,
investors will be in the right direction to make a reasonable investment decision as well as
take steps to adjust capital appropriately.
2.2. Distribution Systems
2.2.1. Definition of Distribution Systems
Distribution is the activity of both selling and delivering products and services from
manufacturer to customer.
In the scope of marketing, it can be said that distribution is one of Ps (Place) in marketing
strategy deciding the success of any business. Distribution is simply described as the
process of delivering products/services from manufacturers to customers (Corrigan, 2019).
Having good distribution system would help companies transfer products/services to
customers in the shortest time from which increasing market share and profit (Kersting,
2012). In addition, effective distribution network also has significant contribution in
creating and enhancing customer satisfaction level.
Distribution is an important stage in the reproduction process and is one of the three
aspects of the production relationship system, directly related to the economic interests of
organizations, entities and individuals in society. Distribution is both a driving force for
production development and a measure of conformity between production and
consumption.
In a market economy, goods are produced for sale in order to make a profit. Therefore,
how to distribute, in the most effective form with the lowest cost to maximize profits is
16
one of the important contents that businesses need to research in the course of real
business context.
There are many different views on the distribution system stemming from the different
views of the researcher. According to Philip Kotler: "A distribution system is a collection
of interdependent organizations, supporting the transfer of ownership of a certain goods or
service, transferring it from producers to consumers."
In the book Textbook of Commercial Economics - University of Economics and Business,
co-authored by Prof. Dr. Dang Dinh Dao and Prof. Dr. Hoang Duc Than - gives the view
on the goods distribution system: “The organization process rational distribution channels
and organize the transfer of goods and services. This is a process that involves operating
and transporting goods and services from the producer to the user with the most efficient
conditions. This process solves issues: Change of property ownership, movement of goods
through the stages of transport, storage, packaging, loading and unloading, providing
market information to manufacturers.
2.2.2. Distribution System and Distributor
The main difference between a distribution system and a distributor is that a distributor is
a type of business, while a distribution system is a business facility.
The distributor is often referred to as the "middleman" in the flow of products through the
distributor channel. This is because of the distributor's common position between the
product maker and the retailer that sells to consumers. Distributors try to acquire products
from manufacturers that meet their quality and price standards. They then mark up the
products and try to earn a profit by reselling them to retailers at a higher price point.
Distributors usually move products in bulk, while retailers break bulk into consumable
units for customers.
Distribution system buy products from manufacturers, store them in warehouses and ship
them to retailers or directly to their stores.
2.2.3. Functions and Role of Distribution System
Distribution is an important element of operations as, without a role that tracks and
improves the relationship between manufacturers and customers, a business cannot ensure
the best possible service. If bottlenecks happen in distribution, deliveries fall short,
customers, retailers and suppliers get angry, and trust is lost. For product distribution to be
truly successful a continuous feedback loop needs to be implemented to ensure everyone
is happy with the process and that any improvements that can be made, are made.
17
In terms of drop shipping and customers buying items online, merchants and customers do
not get to try the product before they buy so they trust that the item will arrive just like in
the pictures and descriptions. This means that the distribution channel needs to be
efficient at providing responses and comments across the whole channel.
Distribution management refers to the main activities of distributing a product, which
includes:
(1) Packaging: Providing adequate packaging or a product so it can be transported
safely
(2) Inventory management: Maintaining a good level of inventory is hugely important
to distribution. Management of inventory is one of the main responsibilities for
distribution management
(3) Order processing: Once an order comes in from a customer, distribution
management needs to plan for the delivery. This involves collecting the stock,
loading it and delivering it in a timely manner. Approval needs to be sent and
invoicing done for this step to be valid.
(4) Logistics: Mode of transport is important to consider for all orders. If they require
overseas shipping there must be agreements in place for permits to be approved
quickly. Loading and handling need to be decided so that all equipment that could
be needed is available onsite.
(5) Communication: Clear communication is needed both on and offsite at distribution
centers. This is to ensure that the correct products are shipped and customers know
when they will receive their items. If a shipment is delayed, distribution
management needs to notify all interested parties immediately
Distribution system could not only enhance the level of customer satisfaction but also help
the company to save much cost and time, increase market share, and enhance the sales
volume (Darbari, Agarwal, & Jha, 2015). As a result, developing good distribution system
is seen as one of the most important factors deciding the business success.
There tends to be a bit of confusion between what a distributor is and how they differ to a
wholesaler. In general, a distributor works closely with a manufacturer in order to sell
more goods and gain better visibility on these goods. Distributors normally will find
wholesalers who will resale their products. A wholesaler works more closely with retailers
to match their needs through buying products in bulk at a discount. Therefore distribution
is an important part of the distribution channel as it acts as the medium between the
manufacturer and their customers.
18
From a marketing perspective, one of the most important functions of distributors is that
they can forecast market needs. Distributors are clearly closer to the market and are better
placed than manufacturers to forecast what their customers will need. By providing this
information to the manufacturer, the latter is better able to provide superior value to
consumers.
Finally, distributors provide market information. They are well-placed to share
information about the market, about competitive activity and so forth. From a
manufacturer’s viewpoint, this information is invaluable for future competitiveness in the
market.
In order to maximize profit generation via sales, a business needs to determine which
distribution method would be ideal for it and distribution channels may vary depending on:
Business characteristics; Market characteristics; Product characteristics and Competitor
characteristics.
A business probably is not hitting the revenue goals because distribution strategy is in
trouble. It means to increase reach and ultimately revenues, businesses have long sought
to build suitable distribution strategy.
2.3. Relationship of Distribution system and financial performance in business
activities
For the small or mid-size company, the understanding that improvements in the current
supply chain/ distribution system will help reduce costs of goods sold, days in inventory
and overall hidden operational expenses is one thing.
There are many issues these companies face that keep them from embarking on improved
supply chain management and discovering its benefits on financial performance.
The importance of a reliable distribution system for getting products to market goes
without saying. Implementing improvements in a distribution system does not need to be
a major investment in time and money. However, it does require an understanding that the
distribution system has significant impact on the financial performance of the company
and the commitment to:
-
Look at the distribution system that impacts the financial measurements
-
Identify the internal business processes that affect distribution system
-
Determine what can be done to improve those business processes that will improve
distribution system and bottom line.
19
Relationship of distribution system and financial performance can conduct an analysis of
a company’s business that will help determine business processes and costs associated
with (Abdikani SA, Mahad MA, Mohamed HD (2018).
Unstable distribution system will affect the financial health of the business because
the expected sales growth is not achieved as planned. Inventory is the inevitable
consequence when goods cannot be sold. Inappropriate distribution system cannot
guarantee an effective saling function that leads to backlog
Inventory also entails a series of implications for storage costs, storage ... causing losses
for businesses (Jighyasu G, Sourabh B (2011) the relationship of Financial and Inventory
Performance of Manufacturing Firms)
Financial stagnation occurs when inventory of goods as well as the pressure to release
inventory are serious problems that no business wants to face. This not only affects
immediate sales but also damages reputation and brand name in the long run.
Using resources effectively is always the top concern of businesses. Ineffective
distribution system is a clear demonstration of waste of resources. Financial investment
for building a sales team is not small. Besides, marketing expenses are upfront high costs.
Distribution system mismatch resulted in revenue, so the cost of money for marketing as
"through your money around".
The financial performance has not been guaranteed, the low ratio of revenue to marketing
cost showing that the resources of the business have been wasted.
Effectiveness of financial investment was not guaranteed, the interest rate on the cost of
marketing revenue is low shows that resources were being wasted.
20
CHAPTER 3: RESEARCH METHODS
This chapter has given an overview description of Minh Thai Limited Liability
Company where the research was conducted. In addition, it would be provided detail
research method from preparing for collecting data to analyzing data.
3.1. Research Methods
This part has presented the research philosophy and the used methods to carry out the
survey that compose of designing questionnaires, selecting sample and data, analyzing
data plan. Data processing was conducted by software SPSS 21.0 consist of Cronbach’s
Alpha confidence coefficient analysis, exploratory factor analysis and multiple linear
regression analysis.
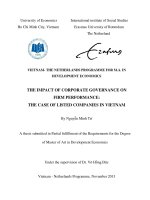
Figure 3.1: Hypotheses
Sales growth
(H1)
Inventory (H2)
FINANCIAL
PERRFORMANCE
The operating expense
percentage (H3)
The average collection
period (H4)
This study present result for specific performance measure of financial. There are
four hypotheses in this study and the measures were examined for reliability and
validity. Factor analysis is used to obtain the value of validity. This study required
a minimum KMO value of 0.50 and a minimum of factor loading value of 0.4.
Cronbach’s alpha is used to measure each dimension. This study required a
minimum Cronbach’s alpha value of 0.60. The value is considered low (Singh,
2007).
3.2. Hypotheses
H1. Sales growth will be positively related to financial performance of Minh Thai Co.,Ltd
H2. Inventory will be positively related to financial performance of Minh Thai Co.,Ltd
H3. The operating expense percentage will be positively related to financial
21
performance of Minh Thai Co.,Ltd
H4. The average collection period will be positively related to financial
performance of Minh Thai Co.,Ltd
3.3. Designing questionnaire
Since primary data is collected from survey of questionnaire with the staffs at Minh
Thai Co.,Ltd, questionnaire design is considered as important context. The objective of
questionnaire design is to make clear and can did questionnaire to the respondents so that
they can easily understand the contents as well as providing correct answers (Saunders et
al., 2009). Questionnaire was designed in Vietnamese, and divided into two main parts
(see appendix B):
-
Part I included questions about variables which regarding respondents.
-
Part II was designed to collect assessments from staffs about the factors impact to
the financial performance at Minh Thai Co.,Ltd.
This part comprised 23 variables in total. Assessing influenced factors of financial
activities included 21 variables to measure four above components while the research
used two variables to measure the financial performance. This measurement based on a 5point rating scale which corresponding to 1 = strongly disagree, 2 = somewhat disagree, 3
= neither agree nor disagree, 4 = somewhat agree, 5 = strongly agree. Participants gave
points for 23 following opinions (see appendix B):
Sales growth:
-
Volume of goods in handling
-
Revenue earned from sales
-
Time of order processing is suitable
-
Time of delivery and payment are suitable
-
Criterias for carring relationship between company and its partners are suitable
Inventory :
-
Quantity of inventory is suitable
-
Value of inventory is suitable
-
Cost of inventory is reasonable
-
Cost of renting warehouse is suitable
-
Cost of checking inventory is suitable
The operating expense percentage:
-
Cost of Marketing and Advertisement
22
-
Cost of Developing and expanding the market share
-
Transportation cost is suitable
-
Cost of handiling complaint is suitable
-
Cost of mistakes in delivery
The average collection period:
-
Time of Receivables is suitable
-
Cost of managinge average collection period
-
Cost of Debt collection and payment policies
-
Cost of Updating to collect receivables from debtor
-
Cost of Processing Fluctuations in receivables
-
Amount of Provision ratio for bad debts
The financial performance:
-
Financial performance of Minh Thai Co.,Ltd is fairry good.
-
You are satisfied with the company's financial performance?
3.4. Sample and Data Collection
After the survey’s questionnaire is prepared, the next important part is to determine
how many employees that will participate in the survey. Saunders et al. (2009) denote that
there are two types of sampling techniques: probability sampling and non-probability
sampling. Hair et al. (2011) suggested that the minimum sample should be from 100 or
150. Norusis (2005) indicates that the sample size should quality the rule of big number of
which the sample pool for data analysis must be exceeded the minimum of 30
observations. According to statistic from Minh Thai Co.,Ltd, the number of staffs who are
working for Minh Thai Co.,Ltd
is 115 people. To gather to information, 115
questionnaires were given to staffs directly or by email. It took about 10 to 15 minutes to
answer the questionnaires. Such application reduces the anxiety to the respondents in the
way of providing information. It means that survey’s questionnaire brings anonymity
advantage and the respondents are not worry about their identities to be exposed and
therefore all information related to the respondents are kept in privacy. Investigation
process was conducted in the period from 10th Jan 2018 to 30th Dec 2020. Among 115
questionnaires provided to staffs of Minh Thai Co.,Ltd, the researcher collected 105
responses that reached a ratio of 95,4%.
3.5. Analyzing data plan
At first, collected data will be input and screened to identify missing samples. After
rejecting all invalid samples, data will be encoded as in the following table:
23