Optimal Time for Collecting Volatile Organic Chemical Samples from Slowly Recovering Wells ppt
Bạn đang xem bản rút gọn của tài liệu. Xem và tải ngay bản đầy đủ của tài liệu tại đây (1.68 MB, 22 trang )
""
EG 142
HWRIC RR-058
Optimal
Time
for
Collecting
Volatile
Organic
Chemical
Samples
from
Slowly
Recovering
Wells
Sheng-Fu
J.
Chou,
Beverly
L.
Herzog,
John
R.
Valkenburg,
and
Robert
A.
Griffin
1991
ENVIRONMENTAL GEOLOGY 142
HWRIC RR-058
Department of Energy and Natural Resources
ILLINOIS STATE GEOLOGICAL SURVEY
HAZARDOUS WASTE RESEARCH AND INFORMATION CENTER
Optimal
Time
for
Collecting
Volatile
Organic
Chemical
Samples
from
Slowly
Recovering
Wells
Sheng-Fu
J.
Chou,
Beverly
L.
Herzog,
John
R.
Valkenburg,
and
Robert
A.
Griffin
Final Report
Hazardous Waste Research and Information Center
Department of Energy and
Natural Resources
Dr.
Gary
D.
Miller and Jacqueline Peden, Project Officers
ENR Contract No. HWR 86019
1991
Environmental Geology 142
HWRIC RR-058
Illinois State Geological Survey
615
East Peabody Drive
Champaign,
Illinois 61820
Hazardous Waste Research and
Information Center
One East Hazelwood Drive
Champaign,
Illinois 61820
ACKNOWLEDGMENTS
This
research
was
conducted
under
contract
to
the
Hazardous
Waste
Research
and
Informa-
tion
Center
(HWRIC),
a division
of
the
Illinois
Department
of
Energy
and
Natural
Resources.
Gary
D.
Miller
and
Jacqueline
Peden
were
the
project
officers.
SCA
Chemical
Services,
Wilsonville,
Illinois,
provided
additional
support.
This
report,
part
of
HWRIC's
Research
Report
series,
was
subjected
to
the
Center's
external
scientific
peer
review.
Mention
of
trade
names
or
commercial
products
does
not
constitute
endorsement.
Cover
photo
Using
a
gas
chromatograph,
Sheng-Fu
J.
Chou
analyzes
volatile
organic
compound
samples.
Printed
by
authority of
the
State
of
Illinois / 1991 /
1200
CONTENTS
ACKNOWLEDGMENTS
ABSTRACT
EXECUTIVE
SUMMARY
INTRODUCTION
Literature Review
Sampling Protocol Study
Geological
Characteristics of the Wilsonville Site
METHODOLOGY
Sampling Scheme
Well Installation
and
Sampling Procedures
Chemical Analysis
Chemical
characterization of water samples
Volatile
organic compounds
Nonvolatile organic compounds
RESULTS AND DISCUSSION
Volatile
Organic Compound Data
Nonvolatile Organic Compound Data
CONCLUSIONS
REFERENCES
FIGURES
1 Location of wells
at
the Wilsonville site
2
Cross section of profile V through trench area B to gob pile
3 Design of monitoring
wells used
in
the project
4
Base/neutral
and
acid fraction analysis scheme
5 Concentrations of benzenes
in
samples collected from well
V1
M in April 1987
6 Concentrations of
chlorinated volatile organic compounds collected from well
V2M
in
June 1987
TABLES
ii
1
1
2
2
3
5
6
6
7
9
9
9
10
11
11
15
16
17
4
5
7
10
13
13
1 Depth, hydraulic conductivity, and number of samples collected from each well 6
2 Chromatographic conditions and detection limits of
volatile organic compounds 8
3 Chromatographic conditions and detection limits of base/neutraVacid
extractables
in
bOiled
deionized water
11
4 Number of samples with concentrations above detection limits for each compound 12
5 Tukey groupings of 1 ,2-Dichlorobenzene concentrations
in
wells
V1
M and V2M
for the dependent
variable time 14
6 Tukey groupings of
chlorobenzene concentrations
in
well
V1
M and
V2M
for the dependent variable time 14
7 Tested compounds, Henry's Law constants, and
relative sensitivity to well
purging prior to sampling 16
APPENDIXES (published separately
In
Chou
et
81.1991)
A Time Series Data for Determining Optimal Time for Sampling for Volatile
Organic Compounds
B
Base/Neutral
and
Acid Fraction Compounds Found
in
Project Wells
iii
ABSTRACT
Determining
the
optimum
time
to
sample
slowly
recovering
wells
for
volatile
organic
compounds
was
the
objective
of
this
research.
Three
hundred
samples
from
11
wells
finished
in
fine-grained
glacial tills
were
analyzed
for
up
to
19
volatile
organic
compounds.
Each
well
was
sampled
before
purging,
and
at
intervals
up
to
48
hours
after
well
purging.
This
combination
of
purging
and
sam-
pling
was
conducted
three
to
five
times
on
each
well.
Samples
were
collected
with
dedicated
point-source
PTFE
(polytetrafluoroethylene)
bailers
equipped
with
bottom~emptying
devices
designed
for
collecting
samples
for
volatile
organic
chemical
analysis.
The
wells
were
easily
evacuated
with
a bailer
because
they
were
finished,
at
depths
less
than
40
feet,
in
materials
with
hydraulic
conductivities
of
between
1
x1
0-6
and
7x10-
5
cm/sec.
Results
of
the
volatile
organic
chemical
analyses
were
examined
using
a
general
linear
model
and
the
Tukey
honestly
significant
difference
test
to
determine
whether
the
changes
in
chemical
concentrations
with
time
after
purging
were
statistically
significant.
At
the
95%
confidence
level,
there
was
no
significant
difference
in
concentrations
in
samples
collected
any
time
after
well
purg-
ing;
however,
samples
collected
4
hours
after
purging
had
Slightly
higher
concentrations
than
samples
collected
earlier or later
during
well
recovery.
Concentrations
of
volatile
organics
were
significantly
lower
before
purging
than
after
purging.
Samples
collected
before
purging
and
24
hours
after
purging
also
were
analyzed
to
determine
whether
purging
affected
nonvolatile
organic
compounds.
The
results
were
analyzed
using
the
pairwise
Hest
on
the
concentration
data.
This
test
showed
that
concentrations
were
statistically
greater after
purging.
EXECUTIVE
SUMMARY
Most
guidelines
for
sampling
groundwater
require
the
evacuation
of
multiple
bore
volumes
from
the
well
before
a
sample
is
collected.
Such
a
recommendation,
however,
is
impractical
for
wells
finished
in
fine-grained
deposits.
These
wells
have
such
slow
recharge
that
they
cannot
recover
rapidly
enough
for
the
requisite
number
of
well
volumes
to
be
removed.
For
slowly
recovering
wells,
the
sample
usually
is
collected
either
24
hours
after
evacuation
or
some
time
during
well
recovery.
Neither
strategy
has
been
supported
by
field
evidence.
This
study
defines
the
optimum
time
to
sample
wells
finished
in
fine-grained
materials
for volatile
organic
compounds
(VOCs).
The
investigation
used
wells
installed
for a
previous
ISGS
project
at
the
SCA
Services
Inc.
industrial
waste
disposal
site
near
Wilsonville.
This
site
was
selected
be-
cause
the
geology
is
typical
of
glaciated
areas
used
for
waste
disposal
in
Illinois,
which
rendered
the
results
generally
applicable.
In
addition,
using
the
existing
monitoring
wells
resulted
in
sub-
stantial
cost
savings.
The
experiment,
designed
in
conjunction
with
statistical
consultants
at
the
University
of
Illinois,
concentrated
on
volatile
organic
compounds
because
some
are
highly
mobile
and
only
small
samples
are
required.
Three
hundred
samples
were
collected
from
11
wells
finished
in
fine-
grained
glacial tills
and
analyzed
for
up
to
19
volatile
organic
compounds.
Each
well
was
sampled
before
purging
and
at
several
time
intervals,
up
to
48
hours,
after
purging.
The
experiment
was
conducted
three
to
five
times
on
each
well.
Samples
were
collected
with
dedicated
point-source
polytetrafluoroethylene
(PTFE)
bailers
equipped
with
bottom-emptying
devices
designed
for
col-
lecting
samples
for
volatile
organic
chemical
analysis.
The
wells
were
evacuated
easily
with
a
bailer
because
they
were
finished
in
slowly
recharging
materials
with
hydraulic
conductivities
be-
tween
1
x1
0-
6
and
7x1
0-
5
cm/sec.
The
samples
were
analyzed
for volatile
organic
compounds
using
a
purge
and
trap
liquid
sample
concentrator
and
gas
chromatograph.
Samples
were
loaded
into
a frit
sparge
glassware
and
purged
with
an
inert
gas
that
freed
the
volatile
compounds,
which
were
then
trapped
on
absorb-
ent
material.
The
trap
was
heated,
and
the
volatile
chemicals
passed
through
a
gas
chromatograph
for
analysis.
To
identifify
and
quantify
the
VOCs,
the
differential
retention
times
and
peak
areas
shown
on
their
chromatographs
were
compared
with
those
of
standard
solutions
prepared
in
an
ISGS
laboratory.
1
Results
of
the
volatile
organic
chemical
analyses
were
examined
statistically
using
a
general
linear
model
and
the
Tukey
honestly
significant
difference
test
to
ascertain
whether
the
changes
in
water
quality
relative
to
time
after
purging
were
significant.
At
the
95%
significance
level,
chemi-
cal
compositions
were
not
significantly
different
at
any
time
interval
after
purging,
although
samples
collected
4
hours
after
purging
generally
had
slightly
higher
concentrations
than
'samples
collected
earlier
or
later.
Concentrations
of
volatile
organics,
however,
were
significantly
lower
before
purging
than
after
purging.
These
results
clearly
show
that
weIJs
finished
in
fine-grained
sediments
should
be
purged
before
samples
are
colJected
for
volatile
organic
chemical
analysis.
In
a
related
experiment,
27
pairs
of
samples
were
colJected
for
nonvolatile
(extractable)
organic
chemical
analysis
before
purging
and
24
hours
after
purging.
Samples
were
not
collected
more
often
because
not
all
of
the
wells
recovered
rapidly
enough
to
produce
the
required
sample
volume
every
few
hours.
.
The
extractable
samples
were
made
basic
and
serially
extracted,
which
produced
the
baselneutral
fraction.
In
the
aqueous
phase,
the
water
was
then
acidified
and
serially
extracted
to
produce
the
acid
fraction.
Base/neutral
extracts
and
acid
extracts
were
concentrated
sepa-
rately
for
gas
chromatographic
analysis.
The
base/neutral
and
acid
extracts
were
analyzed
in
comparison
with
standard
solutions
consisting
of
compounds
typicaIJy
found
in
extracts.
Up
to
15
extractable
compounds
were
found
in
these
samples.
Each
positive
result
produced
one
data
pair,
so
that
up
to
15
pairs
of
data
could
result
from
a
pair
of
samples.
The
27
pairs
of
samples
and
the
compounds
found
in
each
pair
resulted
in
192
pairs
of
data
for
the
extractable
organic
compounds.
Effects
of
purging
on
nonvolatile
compounds
were
examined
using
the
pairwise
t
test
on
the
con-
centration
values.
Concentrations
of
nonvolatile
compounds
after
purging
were
statistically
higher
at
a
significance
level
of
95%
than
those
before
purging.
INTRODUCTION
Recent
environmental
legislation
has
recognized
the
importance
of
protecting
the
quality
of
groundwater
and
the
stress
that
human
activities,
especially
waste
disposal,
place
on
this
vital
natural
resource.
To
provide
a
realistic
assessment
of
current
and
potential
pollution
problems
and
a
rational
basis
for
protecting
groundwater
quality,
it
is
necessary
to
collect
representative
sam-pIes
from
the
groundwater
monitoring
weIJs.
The
purpose
of
this
study
is
to
determine
the
op-
timal
time
for
sampling
volatile
organic
compounds
from
wells
finished
in
fine-grained
materials.
Literature
Review
Much
has
been
published
on
the
problem
of
obtaining
a
representative
sample
from
rapidly
recovering
wells.
Water
that
has
been
standing
in
a
well
is
not
representative
of
formation
water
because
water
in
the
weIJ
above
the
weIJ
screen
is
not
free
to
interact
with
formation
water
and
is
subject
to
different
chemical
equilibria.
This
stagnant
water
often
has
a different
temperature,
pH,
oxidation-reduction
potential,
and
total
dissolved
solids
content
from
the
formation
water
(Seanor
and
Brannaka
1983).
Rust
and
scale
from
the
monitoring
weIJ
may
interfere
with
laboratory
analyses
(Wilson
and
Dworkin
1984),
as
can
bacterial
activity
(ScaH
et
al.
1981).
Volatile
organic
compounds
(VOCs)
and
dissolved
gases
in
the
stagnant
column
may
effervesce
in
as
little
as
2
hours.
A
field
study
by
Barcelona
and
Helfrich
(1986)
concluded
that
adequate
purging
of
stand-
ing
water
was
the
dominant
factor
affecting
accuracy
of
sampling.
They
found
that
errors
caused
by
improper
purging
were
greater
than
those
associated
with
sampling
mechanisms,
tubing,
and
well
construction
materials.
The
goal
of
purging
is
to
provide
a
sample
representative
of
formation
water,
while
creating
minimal
disturbance
to
the
groundwater
flow
regime.
The
suggested
number
of
bore
volumes
to
be
purged
ranges
from
less
than
1
to
more
than
20.
One
bore
volume
is
defined
as
the
volume
of
water
standing
in
the
well
above
the
well
intake.
The
screened
area
and
sandpack
are
not
included
in
the
bore
volume
because
water
in
these
areas
is
free
to
interact
with
the
formation
water.
Humenick
et
aJ.
(1980)
found
that
representative
samples
could
be
obtained
after
removing
less
than
1
bore
volume
from
wells
situated
in
confined
2
sandstone.
Fenn
et
al.
(1977)
suggested
a
minimum
of 1
bore
volume,
but
preferred
3
to
5
bore
volumes,
whereas
Gilham
et
al.
(1983)
suggested
a
range
of
1
to
10
bore
volumes.
Scalf
et
al.
(1981)
used
4
to
10
bore
volumes,
but
made
no
recommendations.
Wilson
and
Dworkin
(1984)
suggested
a
minimum
of
5
to
6
bore
volumes
when
sampling
for volatile
organics.
Pettyjohn
et
al.
(1981)
also
investigated
sampling
for
organic
contaminants
and
advocated
the
removal
of
at
least
10
bore
volumes
at
a
rate
of
at
least
500
mUmin.
Unwin
and
Huis
(1983)
stated
that
purging
up
to
20
bore
volumes
was
common.
Instead
of
recommending
a
number
of
bore
volumes,
Summers
and
Brandvold
(1967)
and
Wood
(1976)
suggested
purging
until
pH,
Eh,
and
specific
conductance
had
stabilized.
Gibb
et
al.
(1981)
and
Schuller
et
al.
(1981)
correlated
purge
volumes
with
changes
in
concentrations
of
inor-
ganic
constituents.
They
concluded
the
best
method
for
determing
the
number
of
volumes
to
be
purged
was
to
determine
the
purge
volume
with
an
aquifer
test
and
confirm
the
volume
by
measuring
the
stability of
field
parameters.
Gibs
and
Imbrigiotta
(1990)
found
similar
site-specific
results
for
purgeable
organic
compounds.
Although
the
problem
of
obtaining
a
representative
sample
from
rapidly
recovering
wells
has
received
much
attention,
the
problem
of
slowly
recovering
wells
has
been
virtually
ignored.
Gil-
ham
et
al.
(1983)
contended
that
wells
in
fine-grained
sediments
should
not
be
purged
because
purging
may
strip
the
sample
of
volatile
organic
compounds.
They
further
argued
that
purging
can
cause
bias
from
mixing
stagnant
and
formation
waters.
Giddings
(1983)
perceived
a
similar
prob-
lem
with
purging
low-yielding
wells.
Fenn
et
al.
(1977)
suggested
waiting
until
the
well
had
recovered
before
collecting
the
sample.
Other
researchers
(Unwin
and
Huis
1983,
Barcelona
et
al.
1985)
recommended
that
the
sample
be
collected
during
recovery.
They
asserted
that
care
must
be
taken
to
ensure
the
well
is
not
emptied
to
below
the
top
of
the
screen
because
to
do
so
would
cause
aeration
of
the
sample.
For
very
slowly
recovering
wells,
Barcelona
et
al.
(1985)
proposed
that
the
sample
be
collected
in
small
aliquots
at
2-hour
intervals.
Unwin
and
Huis
(1983)
and
Barcelona
et
al.
(1985)
further
advocated
that
the
sample
be
collected
at
a
flow
rate
lower
than
that
used
for
purging
to
minimize
sample
disturbance.
None
of
these
authors
presented
data
to
justify their
recommendations
on
sampling
in
fine-grained
materials.
In
practice,
water
samples
from
wells
finished
in
fine-grained
materials
are
collected
the
day after
purging.
Data
on
chemical
changes
during
the
recovery
of
slowly
recovering
wells
(wells
finished
in
fine-
grained
materials)
are
scarce.
Griffin
et
al.
(1985)
observed
changes
in
volatile
organic
concentra-
tions
in
three
monitoring
wells
finished
in
fine-grained
materials.
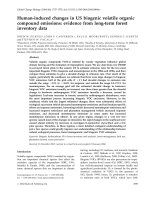
They
conducted
a time-series
sampling
of
three
monitoring
wells
before
and
after
pumping,
which
revealed
that
o-xylene
con-
centrations
reached
a
maximum
after
2
to
8
hours
of
recharge
to
the
well.
Because
data
for other
volatile
organic
compounds
were
less
consistent
among
the
three
wells,
their
data
set
could
not
yield
conclusive
recommendations.
McAlary
and
Barker
(1987)
conducted
a
laboratory
test
of
volatilization
losses
of
organic
compounds
during
groundwater
sampling
from
fine-grained
sand.
They
found
volatilization
losses
for
individual
compounds
were
as
much
as
70
percent
when
volatile
organic
compounds
in
solution
were
passed
through
dry
sand.
They
also
found
volatiliza-
tion
losses
to
be
less
than
10
percent
when
water
had
stood
in
the
well
for
less
than
6
hours.
Sampling
Protocol
Study
Because
of
the
small
database
on
groundwater
sampling
from
monitoring
wells
with
slow
recovery
rates,
a
sampling
protocol
for collecting
water
samples
from
them
has
not
been
estab-
lished
for
volatile
organic
analysis.
To
develop
a
sound
sampling
protocol
for
volatile
organic
analysis
in
fine-grained
materials,
the
Illinois
State
Geological
Survey
used
established
monitor-
ing
wells
at
the
SeA
Services
hazardous
waste
disposal
site
near
Wilsonville.
The
ISGS
had
finished
investigating
failure
mechanisms
and
migration
of
industrial
chemicals
at
the
Wilsonville
site
(Herzog
et
al.
1989).
Because
wells
already
were
installed
and
the
hydrauliC
properties
of
the
native
materials
were
well
known,
the
Wilsonville
site
offered
an
excellent
opportunity
to
develop
such
a
groundwater
sampling
protocol.
Because
the
glacial till
sequence
at
the
Wilsonville
site
is
a typical
geologiC
setting
for
illinOis
hazardous
waste
disposal
sites,
the
sampling
protocol
developed
can
be
applied
to
many
other
shallow
land
burial
Sites
in
Illinois.
The
results
may
be
3
AP4
lAP2
AP1~AP6
W'
~~AA6
* AP5 AA4
Pond
~
N
I
\
,
G3M
G2S 3
GlO
Coal mine cleaning refuse
(Gob Pile)
f
l4S
13M
120
110
H3M
-,-HlO
H2S
r _
Trench area A
Nest F
F2M
."
F10A
F3S
Trench area A
\
PandA
.
CI~I~
A
8~~
cPg~:"-,C:,!! P:ll6, =~:::::= ==-_-_-=0A2C=-'
8~
D Approximate boundary of burial areas
~P4
Well
o 100 200 ft
o
2550m
Figure
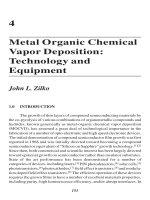
1 Location of wells at the Wilsonville site. Wells used in the investigation are located
in
profiles
V and W
(shadc:ld
area).
less
applicable
to
systems
that
require
deeper
wells
because
wells
used
in
this
project
were
rela-
tivelyshallow
«45
ft
deep),
so
pressure
changes
during
sample
removal
were
relatively
minor.
This
study
is
an
outgrowth
of
an
earlier
project
by
Griffin
et
al.
(1985).
To
develop
a
reasonable
protocol
for
sampling
volatile
organic
compounds
from
wells
finished
in
fine-grained
materials,
the
optimal
time
for
collecting
the
water
sample
had
to
be
determined.
A
major
problem
with
sampling
for
volatile
organic
compounds
is
their
loss
from
the
sample
before
analysis.
To
be
conservative,
we
defined
the
optimal
time
for
sampling
for
volatile
organic
compounds
as
the
time
when
their
concentrations
were
greatest.
4
>
ft
m
640
195
V4
V3
630
Peoria
Loess
Roxana
Silt
190
Vandalia Till,
zone 1
620
(stiff, clayey)
610
185
590 180
, well
screen
580
V2
V1
Trench Area B
Vandalia Till, zone 3
(weathered, jointed)
Vandalia Till, zone 4
(unweathered)
Banner Formation
o
I
o
30m
.
1~Oft
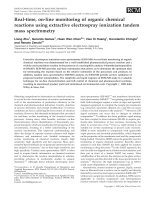
Figure 2 Cross section for profile V through trench area B to gob pile.
-
A
related
experiment
was
performed
to
determine
whether
purging
affected
concentrations
of
non-
volatile
organic
compounds
in
groundwater
samples.
Samples
were
collected
before
and
24
hours
after
purging
for
analysis
of
nonvolatile
compounds
to
determine
whether
purging
had
af-
fected
these
compounds.
Time-series
analyses
were
not
possible
for
the
nonvolatile
compounds
because
the
large
sample
volume
required
for
the
chemical
analyses
required
several
hours
of
well
recovery.
A
complete
list
of
these
data
is
published
separately
in
Chou
et
al.
(1991).
Geological Characteristics
of
the Wilsonville Site
Follmer
(1984)
reported
the
geological
characteristics
of
the
Wilsonville
site.
Figure
1,
a
map
of
the
site
study
area,
indicates
the
monitoring
wells
installed
for
previous
ISGS
research.
Eleven
nests
of
piezometers
and
monitoring
wells
(labeled
A
to
K)
and
two
series
of
monitoring
wells
(labeled
V
and
W),
totaling
more
than
70
holes,
were
drilled
for
the
ISGS.
The
shaded
area
in
fig-
ure
1
denotes
the
wells
used
for
this
project.
The
Wilsonville
site
is
underlain
by
15
to
30
m
(50
to
100
ft)
of
glacial
drift that
overlies
Pennsyl-
vanian
age
shale
bedrock.
Overlying
the
bedrock
is
a thick
sequence
of
glacial
tills
with
only
oc-
casional
thin,
discontinuous
lenses
of
silt,
sand,
and
gravel.
This,
in
turn,
is
overlain
by
loess.
Fig-
ure
2
illustrates
the
sequence
of
unconsolidated
materials
underlying
the
site.
The
oldest
Quaternary
deposit
at
the
site
is
a
sequence
of
fine-grained
glacial
tills
of
the
Banner
Formation,
which
is
pre-Illinoian
age.
Lenses
of
silt
and
sand
and
gravel
are
present
locally
throughout
the
glacial
drift
sequence.
Although
these
lenses
are
typically
less
than
5
cm
(2
in.)
thick,
1.8
m
(6
ft)
of
clean
gravel
was
found
in
one
boring
(V20).
Where
present,
these
lenses
5
Table
1
Depth, hydraulic conductivity, and number of samples collected for volatile organic chemical
analysis from wells used in the study.
Screened
Hydraulic
Completion
depth
conductivity
Number of
Well zone
(m) (cm/sec)
samples
V1S
Zone 3 4.8 - 5.4
7.7 x
10·&
26
V1M
Zone 2 6.6 - 7.2
1.1
x
10.
5
27
V1D
Sand in 9.4 - 10.0
4.6 X
10'&
37
zone 1
V2S
Zone 3 5.0 - 5.7
6.7 x
10.
5
27
V2M
Sand in 6.6 - 7.2
2.4 x
10.
5
28
zone 2
V2D
Sand
in
10.5 - 11.2
6.0 x
10.
6
39
zone 1
V3S Interface 5.4 -
6.1
4.9 x
10.
6
21
between
zones 2 and 3
V3D
Sand
in
11.5 -
12.1
2.1
x
10.
6
38
Banner
Fm
W1M Zone 2 6.6 - 7.2
2.4 x
10.
5
18
W2D Zone 1 12.8 - 13.5
1.8 x
10.
6
17
W3D Zone 2 4.6 - 5.2
3.9x10·&
22
commonly
are
found
between
stratigraphic
units
and
subunits.
However,
the
lenses
appear
to
have
no
significant
lateral
continuity.
Overlying
the
Banner
Formation
is
the
Vandalia
Till
Member
of
the
Glasford
Formation.
This
for-
mation
is
Illinoian
age
and
ranges
from
6
to
18
m
(20
to
60
ft)
thick.
The
Vandalia
till
typically
con-
sists
of
four
zones:
(1)
unweathered,
calcareous,
loamy,
stiff,
semiplastic,
dense
basal
till;
over-
lain
by
(2)
partly
weathered,
calcareous,
loamy,
brittle,
fractured,
dense
basal
till;
(3)
weathered,
leached,
loamy,
soft
ablation
till;
and
(4)
weathered,
leached,
clayey,
stiff
ablation
till
(Sangamon
Paleosol).
The
unweathered
basal
till
(zone
1)
of
the
Vandalia
till generally
is
unfractured.
Above
this
zone,
the
Vandalia
till
has
a
weathered
zone
(zone
2)
as
much
as
4.5
to
6 m
(15
to
20
ft)
thick.
The
lowest
part
of
the
weathered
zone
is
brittle
and
locally
highly
jOinted.
Jointing
follows
both
vertical
and
horizontal
planes,
but
it
is
more
common
in
the
vertical
plane.
Zone
3
is
malleable
and
has
no
visible
joints.
Zone
4,
the
upper
weathered
portion
of
the
Vandalia,
constitutes
the
Sangamon
soil
profile
formed
prior
to
loess
deposition.
The
surficial
geologic
materials
at
the
site
consist
of
0.6
to
2.4
m
(2
to
8 ft)
of
windblown
silt
deposits,
the
Peoria
loess,
and
Roxana
silt.
A
pile
of
coal
refuse,
4.5
to
9 m
(15
to
30
ft)
tall,
and
composed
of
rock
debris
from
an
underground
coal
mine,
covered
about
4
hectares
(10
acres)
of
the
site.
Much
of
this
pile
has
since
been
removed
as
part
of
the
mine
reclamation
project.
METHODOLOGY
Sampling
Scheme
To
test
the
hypothesis
that
voe
concentration
is
a
function
of
sampling
time,
the
sampling
scheme
palled
for
samples
to
be
collected
before
well
purging
(0
hour)
and
several
times
after
6
~
'.
,
purging.
A linear
model
was
selected
to
determine
whether
the
independent
variables
(wellioca-
tion
and
time
of
sample
collection)
affected
the
dependent
variable
(constituent
concentration).
Application
of
a
linear
model
requires
that collection
times
not
be
random;
therefore,
samples
were
collected
before
purging
(0
hour)
and
2,
4,
6,
24,
and
48
hours
after
purging.
Approximately
half
as
many
samples
were
collected
at
48
hours
as
were
collected
at
earlier
times
to
decrease
the
number
of
required
analyses.
Extensive
sample
duplication
was
considered
necessary
to
as-
sure
at
least
one
valid
sample
for
each
well
at
every
time
and
sampling
occasion.
Samples
col-
lected
in
April
and
June
1987
were
duplicated
for
most
of
the
time
intervals.
Well
Installation
and
Sampling Procedures
The
11
monitoring
wells
used
in
this investigation
were
constructed
in
1982
by
boring
a
hole
to
a
selected
depth,
between
4.5
and
14
m
(15
and
45
ft),
with
a
hollow-stem
auger
drill
rig.
Each
well
was
installed
in
a
separate
borehole.
A
well
casing
with
a
slotted
well
screen
was
lowered
to
the
bottom
of
the
hole
through
the
hollow-stem
auger.
Each
well
casing
was
5
cm
(2
in)
ID
(inside
diameter);
well
screens
were
0.6
m
(2
ft)
long.
Screen
and
casing
materials
were
constructed
of
stainless
steel.
Following
placement
of
the
casing
and
screen,
the
hollow-stem
auger
was
withdrawn
from
the
hole,
and
clean
medium-grained
silica
sand
was
placed
to
approximately
0.3
m
(1
ft)
above
the
well
screen.
A
plug
of
expanding
cement,
0.6
to
1.5
m
(2
to
5 ft)
thick,
was
then
placed
above
the
sand
pack.
Expanding
cement,
rather
than
bentonite,
was
used
for
sealing
to
minimize
the
pos-
sibility of
the
seal
cracking
due
to
the
possible
presence
of
organic
solvents.
A
mixture
containing
70
percent
(by
volume)
clean
silica
sand
and
30
percent
granular
bentonite
was
used
to
backfill
each
hole
to
within
about
1.2
m
(4
ft)
of
the
surface.
If
water
was
standing
in
the
hole
above
the
cement
plug
at
the
time
of
construction,
a
19-1iter
(5
gal.)
pail
of
bentonite
pellets
(if
available)
was
used
instead
of
granular
bentonite
to
minimize
bridging
of
the
backfill.
To
aVoid
vertical
cross
contamination,
drill
cuttings
were
not
used
for backfill.
The
annulus
was
then
plugged
to
the
sur-
-
v-
v-
v-
V-
I"
~
o;~
~~
expanding
or-
~~
cement
r-
stai~less
steel
casing
r-
sand-bentonite
slurry
~~~ ~~
r-
expanding
~
::
cement
~
~~;r-
sand pack
:~:o
ot ~-well
screen
::r===f:
Figure 3 Design of monitoring
wells
used
in
this project.
face
with
expanding
cement
and
mounded
slightly
around
the
casing
to
promote
drainage
away
from
the
well.
Wells
used
in
this
investigation
were
located
along
profiles
V
and
W,
as
shown
on
figure
1.
Table
1
gives
the
screened
depth
for
each
well
used
in
this
study.
Figure
3
shows
well
construction
details.
Monitoring
wells
were
developed
using
PTFE
bailers
and
a
stainless
steel
diaphragm
pump
(lEA,
Inc.,
Aquarius
Model).
When
bailers
were
used,
they
were
lowered
to
the
bottom
of
the
well
and
surged
to
draw
in
fine
materials.
Because
the
wells
recovered
slowly,
the
development
procedure
had
to
be
repeated
at
least
four
times
per
well.
The
wells
were
developed
several
days
apart
to
allow
them
to
recover
fully.
The
diaphragm
pump
was
used
during
the
final
stage
of
development,
which
allowed
field
measurements
to
determine
the
hydraulic
conductivity
of
the
soil's
screened
interval
using
an
analysis
for a
constant
pumping
rate.
Table
1
presents
hydraulic
conductivity
values
determined
by
the
0
recovery
test
method
(Todd
1980)
for
the
11
wells.
The
variability
in
the
hydraulic
conductivity
values
reflects
the
geology
of
the
finished
zones.
Values
are
greatest
for
wells
finished
in
sand
lenses
or
influenced
by
fractures.
Wells
were
purged
and
water
samples
were
retrieved
using
a
TIMCO
1-meter
(3-ft)
long
Clear
PTFE
Point
Source
Bailer
(Timco
Mfg.;
Prairie
du
Sac,
WI),
dedicated
to
each
well.
This
bailer
was
designed
to
collect
volatile
organics.
To
minimize
7
Table 2 Chromatographic conditions and detection limits for volatile organic compounds.
Detection
limit
Compound Column
Detector
(Jl9/L)
Methylene chloride
1
a
Hall
b
0.02
1,1-Dichloroethylene 1
Hall
0.04
1,1-Dichloroethane
1
Hall
0.03
Trans-1,2-dichloroethylene 1 Hall
0.03
Chloroform 1
Hall
0.03
1,2-Dichloroethane 1 Hall
0.03
1,1,1-Trichloroethane 1
Hall
0.02
Carbon
tetrachloride 1
Hall
0.04
Trichloroethylene 1 Hall 0.02
Tetrachloroethylene
1
Hall 0.02
Chlorobenzene 1 Hall
0.05
1,2-Dichlorobenzene
1
Hall 0.05
1,3-Dichlorobenzene 1 Hall 0.05
1 A-Dichlorobenzene 1 Hall 0.05
Benzene 1
PID
c
0.2
Toluene 1 PID 0.2
Ethylbenzene 1 PID
0.2
m-Xylene
1
PID
0.2
0-
& p-Xylene. 1
PID
0.2
a Column 1 conditions: 8 ft x 2 mm ID glass column containing Carbopack B 60/80 mesh coated with 1%
SP-1000 with helium carrier gas at 40 mUmin flow rate. Column temperature held at 45° C for 3 min,
then programmed at
8° C/min
to
220° C and held for 25 min.
b Hall detector: Hall electrolytic conductivity detector.
C PID: Photoionization detector. PID and Hall detectors are connected
in
series.
dewatering
of
the
well's
screened
section,
purging
ended
when
the
retrieved
bailer
was
no
longer
full
(bailers
were
50%
longer
than
the
screen).
Methods
used
for
sample
collection
and
analysis
in
the
current
study
followed
those
in
the
study
by
Griffin
et
al.
(1985);
however,
improved
laboratory
analytical
capabilities
allowed
quantification
of
more
compounds
in
our
study.
In
addition,
many
of
the
same
personnel
participated
in
both
studies,
further
assuring
consistent
methodology
in
the
two
studies.
Table
1
lists
the
number
of
samples
collected
from
each
well
for
this
investigation.
To
prevent
cross
contamination,
the
person
collecting
samples
wore
vinyl
medical
gloves
that
were
discarded
after
each
sample
or
set
of
duplicates
was
collected.
Bottom-emptying
devices
for
the
bailers
were
stored
in
separate
plastic
bags
and
thoroughly
rinsed
with
groundwater
from
the
sampled
well
before
each
sample
was
collected.
Bailers
were
not
rinsed
before
each
sample
was
collected
because
they
were
stored
in
the
well,
and
therefore,
in
contact
with
the
water
they
were
to
collect.
.
Samples
were
collected
in
40-mL
clear
borosilicate
glass
vials
with
open-top
screw
caps
and
Teflon-faced
silicone
septa,
or
in
Pierce
40-mL
amber
borosilicate
glass
vials
with
open
closures
fitted
with
silicone/Teflon-faced
septa.
These
vials
were
washed
in
hot,
soapy
water,
rinsed
thoroughly
with
deionized
water,
and
baked
at
150
0
C for 2
to
4
hours.
The
septa
were
baked
separately
at
80
0
C for 1
hour.
The
vials
were
sealed
in
an
"organic-free"
area
until
needed
in
the
field.
Vials
were
prepared
no
sooner
than
one
week
before
the
sampling
date
to
avoid
possible
contamination.
8
Approximately
the
first
20
mL
of
well
groundwater
was
used
to
rinse
the
vial
and
cap.
The
vial
was
then
filled
with
water
from
the
bailer
and
tightly
capped
to
exclude
air.
If
air
was
present,
the
vial
was
emptied
and
refilled.
Clear
vials
were
labeled,
wrapped
in
foil,
and
placed
in
separate
plastic
bags.
Amber
vials
were
labeled
and
placed
in
a
sample
collection
box.
In
the
field,
samples
were
kept
sealed,
on
ice,
and
in
a
cooler.
After
transport
to
the
laboratory,
the
samples
were
stored
in
a refrigerator
at
4
0
C
until
the
analyses
could
be
performed.
Chemical Analysis
Chemical
characterization of water samples
Griffin
et
al.
(1984)
characterized
the
chemical
composition
of
the
soil-core
samples
in
previous
work.
U.
S.
EPA
Methods
601, 602,
624,
and
625
(U.S.
EPA
1982)
were
used
in
the
chemical
characterization
of volatile
and
nonvolatile
or-
ganic
priority
pollutants.
Other
chemical
analyses,
such
as
for
pH,
specific
conductivity,
and
heavy
metals,
were
conducted
also.
In
addition,
a
laboratory
(Environmental
Testing
and
Certifica-
tion),
contracted
by
the
Chemical
Waste
Management
Corporation,
analyzed
water
samples
from
ISGS
monitoring
wells
at
Wilsonville
in
February
1986.
Volatile organic compounds
U.S.
EPA
Methods
601
and
602
(U.S.
EPA
1982;
Federal
Register
1984)
were
used
as
guidelines
for
the
analysis
of
organic
compounds.
Deviations
from
these
two
methods
were
•
analytical
delays
up
to
one
month
(possible
effects
were
examined
statistically
see
below)
•
blanks
not
analyzed
with
every
group
of
samples
(analyzed
blanks
showed
lit-
tle
carryover
from
previous
injections
or
interference
problems)
•
field
samples
not
spiked
with
known
concentrations
of
analytes
(spiked
water
samples
showed
acceptable
recoveries).
Because
previous
research
had
characterized
the
chemical
composition
of
the
soil
core
and
water
samples
from
the
study
wells,
only
the
primary
glass
column,
8
feet
by
2
mm
10
and
con-
taining
1
percent
SP-1000
on
60/80
mesh
Carbopack
B,
was
used
for
the
analysis.
A
secondary
column
for
confirmation
was
not
used.
Stringent
quality
assurance
procedures
were
incorporated
into
the
analytical
process.
Quality
con-
trol
samples
of
purgeable
hydrocarbon
from
U.S.
EPA
Environmental
Monitoring
and
Support
Laboratory
(EMSL),
Quality
Assurance
Branch,
Cincinnati,
Ohio,
were
analyzed
twice
during
the
project
to
determine
accuracy
and
precision.
The
average
percent
recovery
and
the
standard
deviation
of
percent
recoveries
for
each
concentration
were
calculated.
In
both
cases,
the
measured
analyte
concentrations
were
within
the
acceptance
limits
for
the
samples.
A
new
calibration
curve
was
generated
each
work
day
before
analyzing
any
samples.
If
the
calibration
factor for
any
compound
had
a
relative
standard
deviation
of greater
than
10%
between
standard
solUtions,
the
calibration
was
repeated
using
a
fresh
calibration
standard.
The
gas
chromatograph
was
operated
using
temperatures
and
flow
rates
recommended
by
U.S.
EPA
(1982).
The
purge
and
trap
gas
chromatographic
system
was
calibrated
by
using
an
intemal
standard
method.
Three
calibrated
standard
solutions
were
prepared.
One
standard
solution
con-
tained
concentrations
of
the
analytes
slightly
above
the
estimated
detection
limit.
Concentrations
in
the
other
standard
solutions
corresponded
to
the
range
of
concentrations
expected
in
the
samples.
A
known
amount
of
fluorobenzene
or
1,2-dichloropropane
and
l-bromo-2-fluoroben-
zene,
which
served
as
the
internal
standard
solution,
was
injected
into
a
purging
vessel
with
each
sample.
Each
calibrated
standard
solution
was
analyzed,
and
response
(area)
against
the
concentration
for
each
compound
and
internal
standard
soluntion
was
calculated.
If
the
response
factor
(RF)
value
over
the
working
range
(%
relative
standard
deviation)
is
constant,
the
RF
can
be
assumed
to
be
invariant
and
the
average
RF
is
used
for
calculations.
Estimated
detection
limits
were
obtained
by
spiking
known
amounts
of
compounds
of
interest
into
reagent
water.
Successively
more
dilute
solutions
were
analyzed
until
no
response
above
back-
9
ground
was
observed.
The
lowest
con-
centration
for
which
a
response
was
observed
was
defined
as
the
detection
limit.
Table
2
presents
the
operating
conditions
for
the
chromatograph
and
detection
limits
for
the
volatile
organic
compounds.
Quality
assurance
data
are
available
from
the
authors
on
re-
quest.
Samples
collected
in
April
1987
ex-
ceeded
the
EPA
method's
maximum
holding
time
of
14
days,
whereas
the
June
1987
samples
were
analyzed
within
the
time
limit.
To
investigate
whether
the
extended
holding
time
af-
fected
the
analytical
results
of
the
samples
collected
in
April,
the
average
concentrations
of
each
compound
in
each
sample
collected
during
April
and
June
were
compared
using
the
pair-
wise
t-test.
This
comparison
was
not
ideal
because
some
changes
in
con-
centrations
in
the
groundwater
were
ex-
pected
between
the
two
sampling
dates;
however,
large
changes
in
all
compounds
were
not
expected.
Of
the
136
pairs
of
data,
59
decreased
in
con-
centration
between
the
two
sampling
times
and
77
increased.
Concentra-
tions
were
statistically
lower
for
Aqueous
(acid
fraction)
Adjust
pH
~
11
extract
with
3 X
60
mL
15%
methylene
chloride
in
hexane
Adjust
pH
~
2
extract
with
3 X
60
mL
15%
methylene
chloride
in
hexane
.
Extract
(base/neutral)
fraction
' I
Report
1
___
1
GC/MS
confirmation
GC/MS
confirmation
Note:
GC/MS
confirmations
were
performed
In
only
a
few
cases.
Figure 4
Base/neutral
and
acid
fraction analysis
scheme.
samples
taken
from
V1
M
and
V2M
in
April
than
those
taken
in
June;
samples
collected
in
April
from
V1
M
and
V2M
had
the
longest
holding
times.
No
statistical difference
in
concentrations
was
determined
for
the
remaining
nine
wells.
The
statistical
analysis
was
confirmed
using
a
non-
parametric
test,
the
Wilcoxon
rank
sum
test.
Data
were
not
removed
from
the
protocol
time-series
data
set
because
the
sequence
of
sample
analyses
by
well
number
was
consistent
throughout
the
study,
so
it
was
believed
that
relative
concentration
changes
with
time
were
not
affected.
The
results
determined
in
this
study
are
consistent
with
the
findings
of
Friedman
et
al.
(1986).
Nonvolatile organic compounds
Figure
4
outlines
the
method
used
for
extracting
nonvolatile
organic
compounds
(baselneutral
and
acid
extracts).
An
800-mL
water
sample
was
serially
ex-
tracted
(under
basic
and
then
acidic
conditions)
with
15%
methylene
chloride
in
hexane.
The
sample
was
made
basic
with
10
N
NaOH
to
pH
11
and
extracted
three
times
to
obtain
the
base/neutral
fraction;
the
aqueous
fraction
was
then
acidified
with
concentrated
sulfuric
acid
to
pH
2
and
extracted
three
times
to
obtain
the
acid
fraction.
Extractions
were
performed
using
a
separatory
funnel.
Detailed
procedures
for
analysis
of
extractable
priority
pollutants
have
been
published
elsewhere
(U.S.
EPA
1982,
U.S.
Federal
Register
1984).
A dry
nitrogen
stream,
rather
than
a
Kuderna-Danish
evaporator
specified
by
the
U.S.
EPA,
was
used
for
final
concentration
be-
cause
the
dry
nitrogen
was
more
convenient,
and
recoveries
obtained
were
comparable
with
those
obtained
using
the
U.S.
EPA
methods.
An
internal
standard
calibration
procedure
was
used.
Internal
standards
solutions,
1,3,5-
tribromobenzene
and
2,3,5-trimethylphenol,
were
used
because
they
behave
similarly
to
the
non-
volatile
organic
compounds
listed
in
table
3.
Previous
chemical
characterization
of
water
samples
from
some
of
the
same
wells
showed
that
tribromobenzene
and
trimethylphenol
were
not
affected
by
method
or
matrix
interferences
(Griffin
et
al.
1984).
A calibration
standard
solution
spiked
with
a
constant
amount
of
internal
standard
was
used.
In
determining
the
detection
limits,
we
ob-
10
r
Table 3 Chromatographic conditions
and
detection limits for base/neutral
and
acid
extractables
in
boiled
deionized
water.
Oetection
limit
Compound
Column
Oetector
(J.19/L)
Base/neutral extractables
Hexachloroethane
~
ECO
b
0.01
1,3,5-Trichlorobenzene
2
ECO
0.01
1,2,4-Trichlorobenzene
2
ECO
0.01
Hexachloro-1,3-butadiene
2
ECO
0.02
Hexachlorocyclopentad
iene
2
ECO
0.05
Pentachlorobenzene
2
ECO
0.01
Hexachlorobenzene
2
ECO
0.01
Heptachlor
2
ECO
0.01
Aldrin 2
ECO
0.01
Heptachlor epoxide
2
ECO
0.02
Oieldrin
2
ECO
0.01
Endrin 2
ECO
0.01
Endrin aldehyde 2
ECO
0.02
Acid extractables
Phenol
3
c
FIO
d
5.54
2-Chlorophenol 3
FlO
6.50
2,4-0ichlorophenol 3
FlO
6.21
2,4-0initrophenol 3
FlO
19.35
2,4,6-
Trichlorophenol
3
FlO
9.15
4-Nitrophenol 3
FlO
17.22
Pentachlorophenol 3
FlO
15.51
a
Column
2 conditions: 6 ft x 2
mm
10
glass column containing 80/100
mesh
Chromosorb
WHP
coated
with
3%
SE-30
with
P-5
(5%
methane/95% argon) carrier
gas
at
36
mUmin flow
rate.
Column
temperature
held
at
80°
C for 1
min,
then
programmed
at
5°
C/min
to 220° C
and
held
for 5
min.
b
ECO:
Electron capture detector.
c
Column
3 conditions:
30
m x
0.32
mm
10
08-1 fused silica capillary column
with
0.25
IJ.m
film
thickness
(J
& W Scientific, Inc.).
Column
temperature
held
at
80°
C for 1
min,
then programmed
at
5°
C/min
to
220° C
and
held
for 6
min.
Flow
rate:
36
cm/sec (approximately
1.8
mUm
in)
of
helium. Split
less
injection
of
1
IJ.Usample.
d
FlO:
Flame
ionization detector.
served
that
the
peak
area
(response)
to
concentration
was
linear
for
each
compound
in
the
calibration
standard.
Table
3
presents
the
operating
conditions
for
the
gas
chromatography
and
detection
limits.
RESULTS AND DISCUSSION
Volatile Organic Compound
Data
A
total
of
302
samples
were
analyzed
for
up
to
19
volatile
organic
compounds.
Concentrations
of
all
VOCs
were
anomalously
low
in
two
samples,
which
contained
air
bubbles.
These
were
con-
sidered
"blunders"
and
discarded,
leaving
the
analytical
results
of
300
valid
samples
for
sub-
sequent
statistical
evaluation.
Because
duplicate
samples
had
been
collected
for
both
blunders,
the
loss
of
the
two
samples
did
not
affect
the
validity
of
the
statistical
analysis.
Table
4
lists
the
compounds
identified
in
the
groundwater
samples
and
the
number
of
results
above
the
detection
limit
for
each
compound.
Any
compound
not
detected
in
the
sample
collec-
11
tion
of
a single well
was
eliminated
from
the statistical analyses.
Appendix
A
in
Chou
et
al.
(1991)
lists
the
concentrations of volatile organics
and
recovery times for
each well.
Field
measurements
of
temperature,
pH,
and
specific conductance
showed
no
variation with
respect
to
time
since
purging,
and
therefore could
not
be
used
as
indicators
of
the
best
sampling
time for volatile
organics.
This
is
consistent with
the
findings
of
Gibs
and
Imbrigiotta
(1990),
who
showed
that field parameters
are
unreliable for determining
vec
sampling
time
for groundwater
wells finished
in
coarse-grained deposits.
Before statistical
analysis
was
performed,
results from individual wells
were
examined for obvious
trends.
Figures 5
and
6
show
the
concentrations of selected compounds from
two
representative wells.
Two
data
pOints
for a
sampling
time represent concentrations in duplicate
samples.
The
five
aromatic
compounds
in
samples collected from well
V1
M
in
April 1987
showed
an
increase
in
con-
centration until
4 to 6
hours
after purging,
and
then a gradual decrease
in
concentration
(fig.
5).
Other typical results
are
concentrations
shown
for various chlorinated compounds
found
in
V2M
in
June
1987.
No
clear trend relative
to
time
is
evident
in
the chlorinated compounds
because
the
pattern
of
concentration for
each
compound
is
quite different from
the
others
(fig.
6).
We
have
no
explanation for this variability
in
concentration.
The
raw
data illustrate that statistical analysis
was
necessary
to
determine whether
any
sample
collection time was better than another.
To
maximize
the probability of detecting
vecs
in
the
water
samples,
we
defined the best
sample
collection
time
to
be
when
vec
concentrations
were
highest
(and
fewest
vec's
were
un-
detected).
The
best sampling time corresponds
to
the time when total volatilization losses
from
water standing
in
the
well
were
least.
As
discussed
in
the
methodology
section,
the
project
was
designed
so
that data could
be
analyzed using a linear
model.
A general linear
model
(GLM),
which
is
part
of
the
SAS
statistical
package
(SAS
1985),
was
selected.
GLM
assumes that the concentration data
are
distributed
nor-
mally with respect
to
time.
Table
4
Number
of
samples
with
concentration
above
detection
limit
for
each
compound.
Compound
Carbon
tetrachloride
Chloroform
Methylene
chloride
1
,1-Dichloroethane
1,2-Dichloroethane
1,1-Dichloroethylene
Trans-1,2-dichloroethylene
1,1,1-Trichloroethane
Trichloroethylene
Tetrachloroethylene
Benzene
Chlbrobenzene
1,2-Dichlorobenzene
1,3-Dichlorobenzene
1,4-Dichlorobenzene
Ethyl
benzene
Toluene
m-Xylene
o-Xylene
Number
of
samples
above
detection
limit
48
243
252
201
193
81
117
235
272
171
121
65
71
21
71
70
135
25
85
12
Concentraction
range
(~g!l)
0.11
-
593
0.03
-
335
0.05
-
649
0.04
-
29
0.03
-
270
0.05
-
106
0.07
-
294
0.07
-
550
0.52
-
1395
0.02
-114
0.3
- 176
1.40
-
159
0.28
-
188
6.93
-
38.6
0.62
-
236
0.59
-1726
0.2
-
1635
4.22
-
2620
0.88
-
1722
180
160
140
:0
c.
.So
120
c
0
.~
100
C
Ql
80
()
c
0
U
60
40
20
0
0
4
8
12
Time (hr)
1,2-DiChlO
r
o
benzene
1,4-DiChl
Orobenzene
Chlorobenzene
1,3-Dichlorobenzene
16
20
24
Figure 5
Concentrations
of
benzene
compounds
in
samples
collected
from
well
V1
M
in
April
1987
vs.
time
since
purging.
300
Trans - 1,2-Dichloroethane
:g:
200
S
c
0
Chloroform
.~
C
Methylene Chloride
Ql
()
c
8 100
DiChloroethylene
1,2-Dichloroethane
0
0
20
40
Time (hr)
Figure 6
Concentrations
of
chlorinated volatile organic
compounds
collected
from
wells
V2M
in
June
1987
vs.
time
since
purging.
For
each
compound,
there
were
two
independent
variables:
well
(from
which
the
compound
was
taken)
and
time
(of
collection).
GLM
implements
a
multiple
linear
regression
analysis,
which
re-
lates
the
behavior
of
the
dependent
variable
to
a
linear
function
of
the
independent
variables
(Freund
and
Littell
1981).
The
GLM
was
selected
over
other
linear
models
because
it
does
not
re-
quire
a
balanced
data
set
(SAS
1985).
The
model
allows
a
different
number
of
observations
for
each
independent
variable.
The
realities
of
groundwater
sampling
in
the
field
(e.g.,
a
few
broken
sample
bottles,
air
bubbles
in
some
samples)
caused
the
number
of
observations
at
each
well
and
sampling
time
to
be
unequal,
creating
an
unbalanced
data
set.
In
this
study
the
general
linear
model
was
used
to
determine
whether
concentration
was
related
to
the
well
location
and
the
sample
collection
time.
A
95%
significance
level
was
selected.
The
null
hypothesis
was
that
the
concentration
was
not
related
to
well
location
or
time.
13
Table 5
Tukey
groupings
of
1-2
Dichlorobenzene
concentrations
in
wells
V1
M
and
V2M
for
the
dependent
variable
time.
Tukey
Mean
Collection
grouping
concentration
Number
time
A
150.71
8
2
hr
A
145.73
8
4
hr
A
144.06
8
24
hr
A
135.03
7
6
hr
A
134.04
4
48
hr
B
51.95
8
o
hr
Note:
Means
with
the
same
letter
are
not
significantly
different.
Table 6
Tukey
groupings
based
on
chlorobenzene
concentrations
in
wells
V1
M
and
V2M
for
the
dependent
variable
time.
Tukey
Mean
Collection
grouping
concentration
Number
time
A
116.73
8
4
hr
A
113.95
8
2
hr
B A
107.24
4
48
hr
B A
99.44
8
24
hr
B
C
77.65
7
6
hr
C
56.91
8
o
hr
Note:
Means
with
the
same
letter
are
not significantly
different.
For
each
compound,
the
GLM
was
used
first
to
determine
whether
any
significant
difference
ex-
isted
among
the
average
concentrations
found
in
the
11
wells.
GLM
showed
that
the
concentra-
tions
for
each
compound
were
not
from
the
same
statistical
population
for
all
wells.
Concentration
data
were
expected
to
be
from
different
populations
because
of
the
large
range
of
average
con-
centration
data.
However,
GLM
can
determine
only
whether
the
concentration
is
dependent
on
well
location;
it
cannot
determine
whether
some
wells
can
be
grouped.
We
wanted
to
group
data
from
different
wells
to
form
larger
data
sets.
This
exercise
required
the
Tukey
honestly
significant
difference
test
(SAS
1982),
which
used
the
results
of
GLM
to
group
wells
with
concentration
data
that
were
not
significantly
different
for
each
compound.
The
analysis
was
performed
at
the
95%
significance
level.
After
similar
wells
were
grouped
by
the
Tukey
procedure
for
each
compound,
the
statistical
analyses
were
repeated
to
determine
which
sample
collection
times
were
similar
for
each
com-
pound
in
each
group
of
similar
wells.
The
number
of
well
groups
per
compound
ranged
from
one
for
1,3-dichlorobenzene,
found
in
only
one
well,
to
five
for
1,1-dichloroethane.
The
wells
included
in
each
group
differed
by
compound,
although
wells
V1
M
and
V2M
(near
the
center
of
the
plume
for
several
compounds)
were
frequently
grouped
together.
These
statistical
analyses
were
performed
under
the
assumption
that
the
concentration
data
were
normally
distributed
in
time,
without
first
determining
whether
the
assumption
was
correct.
The
as-
sumption
of
normality
with
respect
to
time
for
each
Tukey
group
was
later
examined
using
four
nonparametric
tests:
the
Savage
test,
the
Kruskal-Wallis
test,
the
Brown-Mood
test,
and
the
Van
der
Waerden
test.
The
Savage
test
examines
whether
data
follow
an
exponential
distribution;
our
data
did
not.
The
Kruskal-Wallis
test
determines
whether
two
or
more
sets
of
data
are
from
dif-
ferent
populations
on
the
baSis
of
ranks
of
data.
Brown-Mood
tests
the
same
hypothesis
by
com-
paring
the
medians;
the
Van
der
Waerden
test
compares
the
means.
These
three
tests
indicated
that
data
in
each
Tukey
group
were
from
the
same
population.
Table
5
illustrates
the
use
of
the
Tukey
procedure
to
differentiate
1,2-dichlorobenzene
concentra-
tions
before
and
after
purging
of
wells
V1
M
and
V2M.
The
letters
under
the
category,
Tukey
grouping,
indicate
the
data
sets
that
are
not
significantly
different
at
the
95%
significance
level.
Hence,
for
1,2-dichlorobenzene
found
in
wells
V1
M
and
V2M,
the
concentration
data
from
samples
collected
at
2,
4,
6,
24,
and
48
hours
were
not
Significantly
different
from
one
another,
but
they
were
significantly
different
from
samples
collected
before
purging.
The
results
shown
for
chlorobenzene
in
table
6
are
more
complex,
but
they
still
show
the
lowest
concentration
values
obtained
before
purging.
For
all
well
groups
and
compounds,
the
concentration
in
samples
collected
before
purging
was
either
significantly
lower
or
not
Significantly
different
from
all
other
times,
if
the
compounds
had
concentrations
above
5
J.1gJL.
In
some
cases,
the
concentrations
in
samples
collected
at
zero
time
(before
purging)
were
as
much
as
an
order
of
magnitude
lower
than
the
concentrations
in
14
samples
taken
at
later
times.
Statistical
analyses
for
wells
and
compounds
with
average
con-
centrations
below
5 giL
showed
no
pattern,
due
at
least
in
part
to
the
low
accuracy
of
the
analyti-
cal
determination
near
detection
limit.
Because
the
concentrations
before
purging
were
never
sig-
nificantly
higher
than
the
concentrations
after
purging,
and
in
many
cases
were
significantly
lower,
the
statistical
evidence
demonstrates
that
purging
should
be
required
for
wells
finished
in
fine-grained
sediments.
Results
for
any
sample
collection
time
after
purging
were
not
consistently
different
from
the
results
for
the
rest
of
the
sample
collection
times
tested.
Therefore,
the
Tukey
results
were
ex-
amined
further
to
determine
whether
concentrations
at
any
time
after
purging
appeared
to
be
generally
higher
than
other
times.
For
concentrations
greater
than
300
(lg/L,
samples
collected
4
and
6
hours
after
purging
conSistently
produced
higher
concentrations
than
any
other
sampling
time.
However,
when
all
concentrations
were
considered,
the
time
difference
was
less
obvious.
To
determine
whether
any
time
generally
yielded
higher
concentrations
than
the
others,
each
time
was
given
a
number
on
the
basis
of
its
Tukey
grouping
(tables
5
and
6).
The
Tukey
groups
assigned
A
had
the
highest
mean
concentration,
B
the
next
highest,
etc.
Times
with
only
an
A
were
given
a
1,
times
with
both
an
A
and
a B
were
given
a
1.5,
times
with
only
a B
were
given
a
2,
times
with
Band C
were
given
2.5,
and
times
with
only
a C
were
given
3.
Therefore,
the
time
with
the
lowest
score
had
the
highest
mean
concentration.
These
values
were
multiplied
by
the
number
of
wells
in
each
group
for
each
compound.
Consider,
for
example,
samples
collected
24
hours
after
purging.
In
table
5,
the
24-hour
time
was
assigned
a
value
of
1
for
being
only
in
group
A,
and
the
value
was
multiplied
by
2
for
the
two
wells
in
the
group.
The
24-hour
time
in
table
6
was
assigned
a
value
of
1.5
for
being
in
groups
A
and
B.
This
value
also
was
multiplied
by
2 for
the
two
wells
in
the
group.
This
procedure
was
fol-
lowed
for
all
remaining
times,
compounds,
and
groups
of
similar
wells.
When
all
these
values
were
totaled,
the
4-hour
time
had
a
total
of
74.5
and
O-hour
time
had
a
total
of
122;
the
remaining
times
had
total
values
between
78
and
83.
This
ranking
procedure
suggests
that
the
concentra-
tions
generally
were
Slightly
higher
at
4
hours
than
at
any
other
time.
This
procedure,
however,
was
performed
only
to
look
for a
general
trend;
the
previous
statistical
analysis
showed
that
no
time
after
purging
was
conSistently
different
from
the
others
at
the
95%
significance
level.
An
attempt
was
made
to
correlate
the
importance
of
purging
with
the
volatility
of
each
compound.
This
was
done
in
a
manner
Similar
to
that
used
to
determine
whether
any
time
generally
produced
higher
concentrations
than
the
other
times,
but
was
done
separately
for
each
compound.
Be-
cause
there
was
no
overall
statistical
difference,
however,
between
the
after-purging
times,
the
totals
for
the
after-purging
times
were
averaged.
The
before-purging
total
was
then
divided
by
the
after-
purging
value
to
produce
a
ratio.
The
higher
the
ratio,
the
more
sensitive
the
compound
was
to
purging
and
recovery
time.
A
ratio
of
less
than
1.25
was
arbitrarily
defined
as
having
low
sensitivity
to
purging,
1.26
to
1.75
was
defined
as
moderately
sensitive,
1.76
to
2.25
was
defined
as
highly
sensitive
and
greater
than
2.25
was
defined
as
very
highly
sensitive.
The
compounds
that
exhibited
the
greatest
increase
in
concentration
after
well
purging
included
tetrachloroethylene,
benzene
and
various
substituted
benzenes,
and
0-
and
p-xylenes
(table
7).
Relative
sensitivity
to
purging
and
recovery
was
compared
with
the
Henry's
Law
constant
for
each
of
the
volatile
organiC
compounds.
Henry's
Law
constants
are
highest
for
the
most
volatile
compounds.
It
was
hypothesized
that
the
most
volatile
compounds
would
be
the
most
affected
by
purging
because
they
would
have
experienced
the
greatest
losses
from
the
water
standing
in
the
well
casing.
Table
7
provides
a list
of
the
tested
compounds,
Henry's
Law
constants,
and
the
rela-
tive
sensitivity
of
the
compounds
to
well
purging.
While
approximately
haH
of
the
compounds
be-
haved
as
expected,
based
on
their
Henry's
Law
constants,
haH
did
not.
Therefore,
no
correlation
was
seen
between
sensitivity
to
purging
and
a
compound's
Henry's
Law
constant.
Nonvolatile Organic
Data
The
effect
of
purging
on
nonvolatile
compounds
also
was
tested
statistically.
Data
for
nonvolatile
compounds
in
27
pairs
of
samples
collected
before
and
24
hours
after
purging
were
compared
15
Table 7 Tested compounds, Henry's Law constants, and relative sensitivity to well purging.
Compound
Benzene
Carbon tetrachloride
Chlorobenzene
Chloroform
1,2-Dichlorobenzene
1,3-Dichlorobenzene
1,4-Dichlorobenzene
1,1-Dichloroethane
1,2-Dichloroethane
1,1-Dichloroethylene
Trans-1,,2-dichloroethylene
Ethylbenzene
Methylene chloride
1,1,1-Trichloroethane
Tetrachloroethylene
Toluene
Trichloroethylene
m-Xylene
o-Xylene
p-Xylene
5.43
X
10-
3
2.3 X
10-
2
3.45 X
10-3
4.35 X
10-
3
1.2 X
10-
3
1.8 x
10-3
1.5 x
10-3
5.87 X
10-3
9.77 X
10""
3.01 X
10-
2
6.72 X
10-3
8.44 X
10-
3
2.68 X
10-
3
8.00 X
10-
3
1.49 X
10-
2
5.94 X
10-
3
1.03 X
10-
2
7.68 X
10-
3
5.10x10-
3
7.68 X
10-
3
a Henry's Law constants from Howard (1989) at temperatures
of
20° to 25° C.
Sensitivity to
well purging
b
high
low
high
moderate
very high
very high
high
moderate
low
moderate
moderate
high
low
low
high
low
low
very high
high
high
b Sensitivity to well purging was determined qualitatively by summing the Tukey group value (A=1, A&B=1.5,
B=2, B&C=2.5, C=3) for each set
of
statistically similar wells. Purging totals were averaged for the number of
sample collection times and the before purging total was divided into the after purging total. A ratio of up to
1.25 was considered
low, 1.26 to 1.75 was considered moderate, 1.76 to 2.25 was considered high, and
greater than 2.25 was considered very highly sensitive to purging.
using
the
pairwise
t
test
(see
Appendix
B
in
Chou
et
al.
1991).
Only
17
data
pairs
were
available
for
acid
fraction
compounds
because
phenol
and
2-chlorophenol
were
the
only
compounds
detected,
and
they
were
not
detected
in
all
samples.
Eleven
base/neutral
compounds
were
iden-
tified,
producing
175
pairs
of
base/neutral
data
above
the
detection
limit.
For
both
the
acid
frac-
tion
and
the
base/neutral
compounds,
concentrations
after
purging
were
higher
than
concentra-
tions
before
purging
at
the
95%
significance
level.
CONCLUSIONS
Results
of
this
investigation
clearly
demonstrate
that
wells
finished
in
fine-grained
sediments
should
be
purged
before
samples
are
collected
for
volatile
organic
chemical
analysis.
The
results
also
indicate
that
samples
collected
4
hours
after
purging
may
yield
a
higher
concentration
of
VOCs
than
those
collected
earlier or
later,
but
this
difference
is
not
statistically
significant.
These
results
are
similar
to
those
of
McAlary
and
Barker
(1987),
who
observed
minimal
losses
at
some
time
up
to
about
6
hours
after
purging.
Because
the
changes
in
volatile
organic
chemical
con-
centrations
observed
during
recovery
in
this
investigation
were
not
statistically
Significant,
they
do
not
mandate
a
change
from
the
common
practice
of
sampling
wells
the
day
after
purging.
Samples
collected
24
hours
after
purging
did
not
produce
results
significantly different
from
samples
collected
earlier.
Similarly,
the
data
provide
evidence
that
purging
a
well
in
the
morning
and
sampling
for volatile
organic
compounds
later
the
same
day
is
acceptable.
The
necessity
for
purging
wells
finished
in
fine-grained
deposits
was
further
substantiated
by
the
comparison
of
concentrations
of
nonvolatile
compounds
in
samples
collected
before
purging
and
24
hours
after
purging.
Samples
collected
after
purging
had
higher
concentrations
of
nonvolatile
organic
compounds,
at
a
significance
level
of
95%.
16
REFERENCES
Barcelona,
M.J.,
J.P.
Gibb,
JA
HeHrich,
and
E.E.
Garske,
1985,
Practical
guide
to
ground-water
sampling:
illinois
State
Water
Survey,
Contract
Report
374,94
p.
Barcelona,
M.
J.,
and
J.
A.
Helfrich,
1986,
Well
construction
and
purging
effects
on
ground-water
samples:
Environmental
Science
and
Technology,
v.
20,
no.
11,
p.
1179-1184.
Chou,
S.F.J.,
B.L.
Herzog,
J.
R.
Valkenburg,
and
RA
Griffin,
1991,
Appendixes
A
and
B
to
Optimal
Time
for
Collecting
Volatile
Organic
Chemical
Samples
for
Slowly
Recovering
Wells:
Illinois
State
Geological
Survey,
Open
File
Series
1991-11.
Fenn,
D.,
E.
Cocozza,
J.
Isbister,
O.
Braids,
B.
Yare,
and
P.
Roux,
1977,
Procedures
manual
for
groundwater
monitoring
at
solid
waste
disposal
facilities:
U.
S.
Environmental
Protection
Agency,
EPAl530/SW-611,
269
p.
Follmer,
L.
R.,
1984,
Soil
-
an
uncertain
media
for
waste
disposal,
in
Proceedings
of
the
Seventh
Annual
Madison
Waste
Conference:
Department
of
Engineering
and
Applied
Science,
University
of
Wisconsin-Extension,
p
296-311.
Freund,
R.J.,
and
R.C.
Littell,
1981,
SAS
for
linear
models:
A
guide
to
the
ANOVA
and
GLM
procedures:
SAS
Institute,
Inc.,
Cary,
NC,
231
pp.
Friedman,
L.C.,
L.J.
Schroder,
and
M.G.
Brooks,
1986,
Recovery
of
several
volatile
organiC
compounds
from
simulated
water
samples:
Effect
of
transport
and
storage:
Environmental
Science
and
Technology,
v.
20,
no.
8,
p.
826-829.
Gibb,
J.P.,
R.M.
Schuller,
and
R.A.
Griffin,
1981,
Procedures
for
the
collection
of
representative
water
quality
data
from
monitoring
wells:
Illinois
State
Water
and
Geological
Surveys,
Cooperative
Groundwater
Report
7,
61
p.
Gibs,
J.,
and
T.
E.
Imbrigiotta,
1990,
Evaluation
of
well-purging
criteria for
sampling
purgeable
organic
compounds:
Groundwater,
v.
28,
no.
1,
p.
68-78.
Giddings,
T,
1983,
Bore-volume
purging
to
improve
monitoring
well
performance:
An
otten-
mandated
myth,
in
Proceedings
of
the
Third
National
Symposium
on
Aquifer
Restoration
and
Ground-Water
Monitoring:
National
Water
Well
Association,
Dublin,
OH,
p.
253-256.
Gilham,
R.W.,
M.J.L.
Robin,
J.F.
Barker,
and
J.A.
Cherry,
1983,
Groundwater
monitoring
and
sample
bias:
Environmental
Affairs
Department,
American
Petroleum
Institute,
206
pp.
Griffin,
RA,
R.E.
Hughes,
L.R.
Follmer,
C.J.
Stohr,
W.J.
Morse,
T.M.
Johnson,
J.K.
Bartz,
J.D.
Steele,
K.
Cartwright,
M.M.
Killey,
and
P.B.
DuMontelle,
1984,
Migration
of
industrial
chemicals
and
soil-waste
interactions
at
Wilsonville,
Illinois
in
Proceedings
of
the
Tenth
Annual
Research
Symposium
of
the
Solid
and
Hazardous
Research
Division:
U.S.
Environmental
Protection
Agency,
Cincinnati,
OH,
EPA-600/9-84-007,
p.
61-77.
Griffin,
R.A.,
B.L.
Herzog,
T.M.
Johnson,
W.J.
Morse,
R.E.
Hughes,
S.F.J.
Chou,
and
L.R.
Follmer,
1985,
Mechanisms
of
contaminant
migration
through
a
clay-barrier case
study,
Wilsonville,
Illinois,
in
Proceedings
of
the
Eleventh
Annual
Research
Symposium
on
Land
Disposal,
Remedial
Action,
Incineration
and
Treatment
of
Hazardous
Waste:
U.S.
Environmental
Protection
Agency,
Cincinnati,
OH,
EPA-600/9-85-013,
p.
27-38.
Herzog,
B.L.,
RA
Griffin,
C.J.
Stohr,
L.R.
Follmer,
W.J.
Morse,
and
W.J.
Su,
1989,
Investigation
of
failure
mechanisms
and
migration
of
industrial
chemicals
at
Wilsonville,
Illinois:
Ground
Water
Monitoring
Review,
v.
9,
no.
2,
p.
82-89.
Howard,
P.
K.,
1989,
Handbook
of
Environmental
Fate
and
Exposure
Data,
v.
I &
II,
Lewis
Publishers,
Chelsea,
MI,
574
p.
(v.
I),
546
p.
(v.
II).
Humenick,
M.J.,
L.J.
Turk,
and
M.P.
Colchin,
1980,
Methodology
for
monitoring
ground
water
at
uranium
solution
mines:
Ground
Water,
v.
18,
no.
3,
p.
262-273.
.
McAlary,
T.
A.,
and
J.
F.
Barker,
1987,
Volatilization
losses
of
organics
during
ground
water
sampling
from
low
permeability
materials:
Ground
Water
Monitoring
Review,
v.
7,
no.
4,
p.63-68.
Pettyjohn,
W.A.,
W.J.
Dunlap,
R.L.
Cosby,
and
J.W.
Keeley,
1981,
Sampling
ground
water for
organic
contaminants:
Ground
Water,
v.
19,
no.
2,
p.
180-189.
SAS
Institute
Inc.,
1982,
SAS
users
guide:
Statistics:
Cary,
NC,
585
p.
SAS
Institute
Inc.,
1985,
SAS/STAT
guide
for
personal
computers,
version
6
edition:
Cary,
NC,
378
p.
17
Scalf,
M.A.,
J.F.
McNabb,
W.J.
Dunlop,
R.L.
Cosby,
and
J.S.
Fryberger,
1981,
Manual
of
ground-water
sampling
procedures: National
Water
Well
Association,
Dublin,
OH,
93
p.
Schuller,
A.M.,
J.P.
Gibb,
and
A.A.
Griffin,
1981,
Recommended
sampling
procedures for
monitoring
well:
Ground
Water Monitoring
Review,
v.
1,
no.
1,
p.
42-46.
Seanor,
A.
M.,
and
L.
K.
Brannaka,
1983,
Efficient sampling techniques:
Ground
Water
Age,
v.
17,
no.
8,
p.
41-46.
Summers,
W.
K.,
and
L.
A.
Brandvold,
1967,
Physical
and
chemical
variations
in
the
discharge
of
a flowing well:
Ground
Water,
v.
5,
no.
1,
p.
9-10.
Todd,
D.
K.,
1980,
Ground
Water
Hydrology,
2nd
edition:
John
Wiley
and
Sons,
Inc.,
p
131-134.
Unwin,
J.
P.,
and
D.
Huis,
1983,
A laboratory investigation
of
the
purging
behavior
of
small-
diameter
monitoring
well,
in
Proceedings
of
the
Third
Annual
Symposium
on
Ground
Water
Monitoring
and
AquiferRestoration:
National
Water
Well
Association,
Dublin,
OH,
p.
257-262.
U.
S.
EPA,
1982,
Test
methods:
methods
for organic chemical
analysis
of
municipal
and
industrial wastewater, editors, J.
E.
Longbottom
and
J.J. Lichtenberg:
Environmental
Monitoring
and
Support
Laboratory,
Cincinnati,
OH
45268,
EPA-600/4-82-057.
U.
S.
Federal
Register,
1984,
Part
VIII,
Environmental
protection
agency,
guidelines establishing
test procedures for
the
analysis
of
pollutants under the clean water
act;
final
and
interim final
rule,
Methods
601
and
602,
p.
29-48.
Wilson,
L.
G.,
and
J.
M.
Dworkin,
1984,
Development
of
a primer
on
well
water
sampling
for
volatile organic
substances:
U.
S.
Geological
Survey,
Reston,
VA,
44
p.
WOOd,
W. W,
1976,
Guidelines for collection
and
field
analyses
of
ground water
samples
for
selected
unstable
constituents:
U.
S.
Geological
Survey
Techniques
of
Water
Resources
Investigations,
Book
1,
Chapter 0-2,
24
p.
18