Volatile organic compound emission and other trace gases from selected animal buildings ppt
Bạn đang xem bản rút gọn của tài liệu. Xem và tải ngay bản đầy đủ của tài liệu tại đây (1.21 MB, 12 trang )
N. M. Ngwabie, G. W. Schade, T. G. Custer, S. Linke and T. Hinz / Landbauforschung Völkenrode 3 / 2007 (57):273-284
273
Volatile organic compound emission and other trace gases from selected animal buildings
Ngwa Martin Ngwabie
1,2
, Gunnar W. Schade
2,3
, Thomas G. Custer
2,4
, Stefan Linke
5
and Torsten Hinz
5
1
Department of Agricultural Biosystems and Technology, Swedish
University of Agricultural Sciences, Alnarp, Sweden
2
Institute of Environmental Physics, University of Bremen, 28334
Bremen/Germany
3
Department of Atmospheric Sciences, Texas A&M University, Col-
lege Station, TX, USA; Email:
4
Max Planck Institute for Chemistry, Department of Atmospheric
Chemistry, Joh Joachim-Becher-Weg 27, 55020 Mainz/Germany
5
Federal Agricultural Research Center (FAL), Institute of Technology
and Biosystems Engineering, Bundesallee 50, 38116 Braunschweig/
Germany
Abstract
Using chemical ionization mass spectrometry and photo-
acoustic spectroscopy, we analysed the evolution of vola-
tile organic compounds (VOCs) and other trace gases dur-
ing an approximately one-week measurement period each
in a pigsty and a sheep shed at the Federal Agricultural
Research Centre (FAL) in Mariensee, Germany. When ac-
tivities in the sheep shed were most intense during feeding
hours and manure removal, concentration surges of VOCs
were observed, which strongly correlated with methane
and ammonia levels. Immediately after this disturbance,
especially the manure removal, which lasted for about
30 minutes, the short-term concentration spikes decayed
exponentially as a result of dilution of the shed air with
relatively clean air from outside the shed. Emission factors
were modelled from the daily surge and decay proles in
the shed and were further used to estimate emission rates
for Germany. Concentrations measured at an exhaust ue
of a pigsty section were much smoother than in the sheep
shed. For both sheds, correlations of VOC mixing ratios
with methane or ammonia were used to calculate shed,
respectively per animal emission factors, and to estimate
nationwide release rates for a number of VOCs. VOC
emissions from both sheds were dominated by alcohols,
ethanol from the sheep, methanol from the pigs. Ethanol
and other fermentation products have known sources in
the fodder and the excrements. New is the nding that
also high amounts of methanol are released, the source of
which is not entirely clear. Total annual VOC emissions
from the animal husbandry sector in Germany are likely
around 150 Tg carbon, less than previously estimated and
of a much different composition.
Keywords: Volatile Organic Compounds (VOC), emissions,
animal sheds, sheep, pigs, excrements
Zusammenfassung
Volatile Organische Komponenten und andere Spuren-
gase in ausgewählten Tierställen
In dieser Arbeit werden die jeweils rund eine Woche dau-
ernden Spurengasmessungen in einem Schafstall und am
Abzug einer Schweinestallabteilung der FAL in Marien-
see beschrieben. Mittels photoakustischer Spektroskopie
wurden Ammoniak, Methan, Kohlenstoffdioxid, Distick-
stoffmonoxid und Wasserdampf, mittels chemischer Io-
nisations-Massenspektrometrie die Konzentrationen von
über 40 volatilen organischen Komponenten (VOK) im 2-
oder 3-Minuten Zyklus bestimmt Die Konzentrationen im
Schafstall stiegen besonders während der regelmässigen
Abfuhr der Exkremente (30 min) unter dem Spaltenbo-
den zeitgleich mit der Fütterung stark an. Spitzenwerte für
verschiedene VOK stiegen dann bis in den µmol pro mol-
Bereich, und waren mit parallelen Anstiegen von Ammo-
niak und Methan korreliert. Die nur kurzzeitig sehr hohen
Konzentrationen wurden im Anschluss über die normale
Stallventilation mit Frischluft von aussen verdünnt, was zu
einer exponentiellen Abnahme führte. Eine Bilanzanaly-
se mittels Modellierung des dieses Konzentrationsabfalls
wurden dazu benutzt, VOK-Emissionsfaktoren pro Stall
bzw. Tier zu berechnen. Anders als im Schafstall zeigte
der Konzentrationsverlauf am Abzug des Schweinestalls
wesentlich moderatere Veränderungen, In beiden Fällen
jedoch wurden die Korrelationen zu Ammoniak und Me-
than dazu verwendet, Gesamtemissionen zu bestimmen. In
beiden Stallungen dominierten Alkohole die VOK-Emissi-
onen, im Schafstall Ethanol, im Schweinestall Methanol.
Die VOK-Quellen liegen in der Futterfermentation und
Exkrementzersetzung. Die Fermentationsprodukte Etha-
nol, Acetaldehyd, und Essigsäure waren stets präsent. Neu
sind inbesondere die Messungen hoher Konzentrationen
Methanols, dessen Ursprung noch etwas unklar ist. Auf
Deutschland hochgerechnete Gesamtemissionen von VOK
pro Jahr liegen wahrscheinlich um 150 Tg Kohlenstoff, et-
was weniger als zuvor berechnet und in deutlich anderer
Zusammensetzung.
Schlüsselwörter: Volatile Organische Komponenten (VOK),
Emissionen, Tierstall, Schaf, Schwein, Exkremente
274
1 Introduction
Agriculture is a source of trace gases and particles emit-
ted into the atmosphere with possible effects on global
atmospheric chemistry, a source of odour and particulate
matter pollution (Gustafsson and Wachenfelt, 2006; Hobbs
et al., 1997; Hobbs et al., 1998; McGinn et al., 2003; Ra-
baud et al., 2002; 2003; Schiffman et al., 2001), and im-
pact on human and animal health (Zhang et al., 1998).
Livestock management has been identied as a source of
methane, ammonia and nitrous oxide (Berges and Crutzen,
1996). Although many Volatile are also produced, there is
limited information on the factors affecting their release
and the subsequent effects on the environment. To begin
addressing these issues, more comprehensive studies of
aerial pollutants from livestock husbandry are necessary.
Mitigation strategies through better animal management
practices are more effective if planning is done with up-to-
date information on the types and magnitudes of odorous
VOC emissions. Previous work has identied numerous
VOC species contributing to odour problems inside vari-
ous animal buildings (Filipy et al., 2006; Rabaud et al.,
2002; Hobbs et al., 2004; Schiffman et al., 2001) and in
ambient air (Rabaud et al., 2003; Hobbs et al., 1997; Hobbs
et al., 1998;). However, based on the analytical techniques
used, it is unclear whether the identied species represent
the bulk of VOC carbon or just a small fraction. Recently,
chemical ionisation mass spectrometry has been used to
quantify VOCs in cow sheds (Shaw et al., 2007; Ngwabie
et al., 2007), and short-chain alcohols were identied as the
dominant contributors to VOC emissions alongside many
VOCs previously found.
This article reports on measurements carried out by the
University of Bremen and the Federal Agricultural Re-
search Centre in Germany. Recently we have calculated
ux values for a number of VOCs from dairy cows in Ger-
many (Ngwabie et al., 2007) and this contribution is a fol-
low-up from the dairy cow report. Alongside the mixing ra-
tio measurements of ammonia, methane, nitrous oxide and
carbon dioxide, this paper identies major VOCs emitted
from sheep and pig buildings. We also present the estimat-
ed mass release rates of some VOCs from these buildings.
2 Materials and methods
VOCs were measured with a commercial proton trans-
fer reaction mass spectrometer (PTR-MS, Ionicon Ana-
lytik), Innsbruck, Austria), full details of which are given
elsewhere (de Gouw et al., 2003; Lindinger et al., 1998).
The instrument was operated in a similar way as within
the cowshed (Ngwabie et al., 2007), with measured VOC
mixing ratios reported with an accuracy of 30 %, or better
when a calibration gas was available. The concentrations
of methane, nitrous oxide, ammonia and carbon dioxide
were monitored in 2-minute intervals with a photo-acoustic
spectrometer (Brüel and Kjaer model, 1302), operated the
same way as inside the cowshed. Factory calibration of the
instrument was left unchanged for the experiments reported
here.
2.1 Experimental sitesExperimental sites sites
Measurements were carried out in a sheep shed and a pig-
sty at a FAL branch in Mariensee near Neustadt-Hanno-
ver, Germany, during the winter months when all animals
spend their time indoors.
Data was collected from a pigsty from 21
st
to 28
th
of Janu-
ary 2005. Hygiene regulations did not permit entry into the
pigsty, and the measurement setup was therefore deployed
in a nearby building with a heated sampling line hooked
up to the exhaust of a ue. The normally intermittent ex-
haust was changed to a constant low ow midway through
the weeklong sampling period. The pigsty had a mixture
of weaner and nishing pigs on a slated oor system. Liq-
uid manure collected beneath the oor was channelled to a
storage tank outside the pigsty. The solid manure under the
oor was pushed out once to twice a week. Feeding times
during sampling were between 7:30 and 8:30 in the morn-
ing and between 13:00 and 13:30 in the afternoon.
Measurements in the sheep shed (dimensions 23 m ×
15 m × 4 m [LWH]) were carried out from 1
st
to 7
th
Feb-
ruary 2005. This shed housed 120 sheep subdivided into
72 ewes, 18 rams and 30 lambs. It had a two double stall
setting with the sheep free to move about. Each row was
further subdivided into 5 compartments to prevent over-
crowding. The oor was slatted with the manure collected
in a pit beneath. Twice a day at about 08:00 h and 14:00
h the manure was mechanically removed and dumped in
a heap outside the shed. Passive ventilation was provided
through four ues in the roof and via opening of windows.
2.2 Measurements
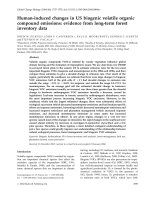
The PTR-MS and the photo-acoustic spectrometer were
set up as shown in Figure 1. Air was sucked at a constant
12 L min
-1
through 20 m long sampling lines from inside
or outside of the animal shed (0.635 mm ID Teon PFA)
to the PTR-MS and photo-acoustic monitoring devices us-
ing a membrane pump. The source of the sample air was
chosen through switching a three-way, PFA solenoid valve
controlled by the PTR-MS computer.
Sheep shed
Air from inside the shed was sampled from a central loca-
tion at a height of 2 m. The air at this location should gener-
ally be well-mixed and a good representative of the shed as
N. M. Ngwabie, G. W. Schade, T. G. Custer, S. Linke and T. Hinz / Landbauforschung Völkenrode 3 / 2007 (57):273-284
275
a whole. To complement air measurements, a temperature
sensor was placed near the centre of the shed at a height
of 2 m and recorded temperatures (0.5 °C resolution) at a
120 s time interval. Reference air was sampled at a point
outside a partially open shed window.
Figure 1:
Experimental set-up for monitoring gaseous emissions in animal housing
Flowmeter
Photo-acoustic
Multigas Monitor
PTR-MS
Reference line,
9.5 mm OD (PFA)
Three-way
valve (PFA)
1 - 2 µm filter
1 - 2 µm filter
Animal shed line
9.5 mm OD (PFA)
Computer
Pump
0.32 mm
0.32 mm
0.635 mm
Pigsty
The instrumental setup was installed in a neighbouring
ofce building. The sample line ran up to the exhaust of a
ventilation shaft in the roof where the air was sucked from
near the edge of the exhaust hood through an externally
heated Teon PFA line. Reference air was sampled from
the roof of the ofce building in which the instrument was
housed.
Although the reference air in both cases was unavoid-
ably inuenced by emissions from the surrounding animal
sheds, these sampling positions represented the closest nat-
ural source of „clean“ air that could be used for comparison
with that in the sheds. Both animal shed air and outside air
sampling inlets were equipped with 1 – 2 µm Teon PTFE
lters that trapped particles from the air stream prior to
trace gas monitoring. The high air-ow rate ensured that
sampled air spent a very short time in the tubing (~3 s) prior
to chemical analysis. For all measurements, the residence
time of air in the PTR-MS is estimated to be on the order of
0.3 seconds with a total measurement cycle including one
measurement of each selected mass every 107 seconds. Air
was exchanged in the photo-acoustic spectrometer approx-
imately every 120 seconds. Animal shed air was sampled
for 30 minutes at the top of each hour while outside refer-
ence air was sampled for the last 30 minutes of each hour
enabling monitoring of both shed and outside conditions
proportionally.
3 Results and discussions
3.1 PTR-MS data and VOC assignment
Prior to individual mass monitoring in the pigsty and the
sheep shed, initial measurements were conducted in or-
der to determine which mass-to-charge ratios (chemicals)
might be found at elevated abundances inside the animal
facilities as compared to ambient air. Full mass scans rang-
ing from 20 to 210 atomic mass units were performed and a
t-test of means carried out comparing ion signals observed
in animal shed air to those in ambient air using P < 0.05 as
a cut-off to determine whether there was an observable dif-
ference between them. Those mass-to-charge (m/z) ratios
showing signicant deviation between inside and outside
air were pinpointed for further measurements.
Although the PTR-MS instrument is very reliable for on-
line monitoring, secondary techniques or hyphenation with
gas chromatography are necessary for complete and unam-
biguous compound identication. In the event where such
instrumentations are not available, mass to VOC assign-
ments must be approached with some care. We have previ-
ously discussed our mass to VOC assignments (Ngwabie
et al., 2007), so only a summary shall be given here. It
has been shown that several ions associated with common
VOCs are essentially free from interference from other
VOCs when sampling air in the troposphere of rural and
urban environments (de Gouw et al., 2003; Warneke et al.,
2003). We assumed that the sample air from the animal
housings was not signicantly different from that of the ur-
ban or rural troposphere. As a more solid approach, we con-
sulted reports that detailed other techniques for compound
identication in animal housings for comparisons (Filipy
et al., 2006; Hobbs et al., 1997, 1998, 2004; McGinn et al.,
2003; Rabaud et al., 2002, 2003; Schiffman et al., 2001;
Spinhirne et al., 2003, 2004; von Hartungen et al., 2004).
In some cases, such as with m/z 47, the natural
13
C abun-
dance of an ion at m/z + 1 provided additional insight into
the dominant carbon number of an ion at m/z. When avail-
able and of sufcient intensity, measured
13
C abundances
of ions were compared to those expected.
Here, we report on 17 major VOCs that were temporally
associated with particular m/z values in the sheep shed ac-
cording to the previously described criteria. They are listed
in Table 1. The same VOCs were identied in the pigsty
at different concentrations with the exception of toluene
and caproic acid due to signicantly lower pigsty signals
276
compared to ambient air.
Table 1:
Trace gases identied in the sheep shed and pigsty with associated mass to charge ratios, mixing ratios and ranges observed. Legal 8-h limits in workplace
environments for Germany (MAK) are included.
VOC and other gases Sheep shed Median (Range) Pigsty Median (Range) MAK
Data from multi-gas monitor µmol mol
-1
(ppm)
Nitrous oxide 0.47 (0.39 – 0.60) 0.43 (0.34 – 0.50) 100
Carbon dioxide 1200 (902 – 1970) 723 (503 – 1250) 5000
Methane 71.05 (35.2 – 336) 4.69 (3.01 – 8.96) NA
Ammonia 6.39 (0.92 – 19.6) 4.17 (1.16 – 6.92) 20
Data from PTR-MS nmol mol
-1
(ppb)
Methanol (m/z 33) 121.7 (8.2 – 1756.1) 45 (6 – 71.3) 200000
Acetaldehyde (m/z 45) 183.6 (46.4 – 1011.1) 5.8 (1.1 – 33.1) 50000
Ethanol (m/z 47) 6570.7 (1263.7 – 94363.8) 118.3 (98.2 – 163.9) 500000
Acetone (m/z 59) 20.6 (6.7 – 57.9) 10.1 (3.3 – 361.1) 500000
Trimethylamine (m/z 60) 14.2 (2.6 – 35.4) 7.7 (2.5 – 18) 2000
Isopropanol (m/z 41,43) 17.9 (4.1 – 140.2) 17 (1.5 – 91.9) 200000
Dimethyl sulphide (m/z 63) 1.6 (0.5 – 5.3) 2.9 (0.9 – 5.9) NA
Methyl ethyl ketone (m/z 73) 1.4 (0.4 – 8.3) 1.1 (0.5 – 1.9) 200000
Toluene (m/z 93) 0.2 (0 – 8.8) NA 50000
Phenol (m/z 95) 1 (0.3 – 1.8) 0.3 (0.1– 0.5) 2000
C8 aromatic (benzaldehyde m/z 107) 0.1 (0.02 – 0.8) 0.06 (0.01 – 0.14) 100000
4-methyl phenol (m/z 109) 3.9 (0.9 – 9) 1.9 (0.8 – 3.7) 5000
Volatile fatty acids nmol mol
-1
(ppb)
Acetic (m/z 43, 61, 79) 14.3 (2.9 – 87.8) 44.5 (7.8 – 107.9) 10000
Propanoic (m/z 55, 75, 93) 11.4 (3 – 139.7) 6.3 (2 – 11.7) 10000
Butyric & isobutyric (m/z 71, 89, 107) 5.5 (1 – 56.2) 4.9 (1.6 – 9.7) NA
Valeric & isovaleric (m/z 103, 121) 0.6 (0.3 – 3) 0.6 (0.2 – 41.4) NA
Caproic (m/z 99, 117, 135) 0.6 (0.1 – 5) NA NA
NA: Not available
Ion signal intensities at m/z 33, 45, 47, and 59 were as-
sociated with methanol, acetaldehyde, ethanol and acetone,
respectively with mixing ratios calculated based on results
of calibration gas dilution. The signal at m/z 47 was as-
signed to ethanol based on the
13
C abundance of m/z 48.
High mixing ratios of methanol were observed in both
facilities, a dominant compound also identied inside the
large FAL cowshed (Ngwabie et al., 2007). However, it was
ethanol that had the highest mixing ratio in both ruminant
sheds, a nding supported by measurements in California
(Mitloehner et al., 2007; Shaw et al., 2007).
While ions observed at m/z 61 might be associated with
acetic acid, isopropanol, n-propanol, or methyl formate
(Spanel and Smith, 1997; Warneke et al., 1996), we have
associated them solely to acetic acid for reasons described
in our earlier publication (Ngwabie et al., 2007), further
supported by the m/z 61 to m/z 62 ratio. The fragment ion
at m/z 43 was similarly assumed to be a mixture of higher
alcohols (C
3
– C
8
) and acetic acid (Buhr et al., 2002; von
Hartungen et al., 2004). As before, we investigated the m/z
43 to m/z 44 ratio, which in this case suggested that the
acetic acid contribution to m/z 43 was negligible, instead
nding a ratio ≥ 0.036 suggestive of higher alcohol contri-
butions to m/z 43. The sum of the m/z 43 abundance with
its fragment ion at m/z 41 was used to calculate the mixing
ratio of all higher alcohols as “isopropanol”. The resulting
mixing ratios of acetic acid and “isopropanol” ought to be
regarded as upper limits for either animal housing.
The major odorants trimethylamine, dimethyl sulde,
Volatile Fatty Acids (VFAs), and p-cresol (4-methyl phe-
nol), were assigned to m/z 60, 63, the series 75 (C
3
), 89
(C
4
), 103 (C
5
), and 117 (C
6
) (von Hartungen et al., 2004),
and m/z 109, respectively. All have previously been associ-
ated with animal husbandry VOC emissions. The remain-
ing, signicantly enhanced ion signals at m/z 73, 93, 95,
and 107, were attributed to methyl ethyl ketone, toluene,
phenol, and C
8
aromatics (xylenes, ethylbenzene, and
benzaldehyde) plus hydrated butyric acid, and should be
largely free of interference.
N. M. Ngwabie, G. W. Schade, T. G. Custer, S. Linke and T. Hinz / Landbauforschung Völkenrode 3 / 2007 (57):273-284
277
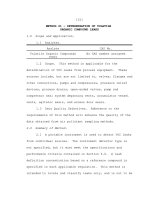
Figure 2:
Time series of calibrated VOCs in the sheep shed (ppm = µmol mol
-1
)
14.5 15.5
16.5
0.0 0.5 1.0 1.5
Shed air
Outside air
m/z 33 (methanol)
Temp [deg C]
0.0 0.4 0.8 1.2
m/z 45 (acetaldehyde)
0 20 40 60 80
m/z=47 (ethanol)
34.0 34.5 35.0 35.5 36.0
0.00 0.02 0.04
m/z 59 (acetone)
Day of year (2005)
VOC mixing ratio [ppm]
3.2 Trace gas variability
Our discussions here are concentrated on trace gases emit-
ted in the sheep shed as there is little research information
on this. Methane, carbon dioxide, ammonia and nitrous
oxide exhibited regular daily spikes in both animal sheds
much in the same pattern as the VOCs. In particular, meth-
ane showed a clear distinction between shed and outside
air mixing ratios in the sheep shed indicating a large and
constant production source, likely the ruminants’ respira-
tion. This distinct separation between shed and reference
air was not observed for ammonia in either shed, likely
due to its adsorption to the walls inside the model 1302
analyser used in this study. Table 1 lists median values of
mixing ratios for these gases including the maximum and
minimum values attained in both sheds.
Figure 2 depicts two days of the week long campaign in
the sheep shed with the upper panel showing the tempera-
ture variation with a mean of 15 ± 1 °C. The shed VOC
278
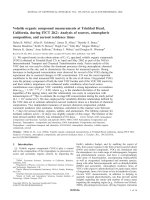
Figure 3:
A selection of measured VOCs at the pigsty exhaust ue.
Methane
Shed air
Outside air
m/z 33 (methanol)
m/z 61 (Acetic Acid)
m/z 89+71 (Butyric Acids)
m/z 60 (Trimethylamine)
25.5 26.0 26.5 27.0 27.5 28.0 28.5
0.000
0.000
0.00
0.00
0
0.05
0.04
2
0.10
0.08
4
6 8 10
12
Mixing ratio [ppm]
0.15 0.20
0.010 0.020 0.004 0.008
Day of year (2005)
N. M. Ngwabie, G. W. Schade, T. G. Custer, S. Linke and T. Hinz / Landbauforschung Völkenrode 3 / 2007 (57):273-284
279
mixing ratios showed regular interval spikes, which ap-
peared to decay exponentially. The periodicity of the emis-
sion spikes in the sheep shed was associated with regular
activities that included cleaning and manure removal and
feeding. During this time, the manure underneath the oor
was mechanically removed by a conveyor and dumped on
a heap outside the shed. At this time, the odour in the shed
was the most unpleasant, likely caused by the manure stir-
ring/overturning.
As an example for the concentration variations at the pigsty
exhaust ue, Figure 3 shows a selection of measured VOCs
with different properties, and methane for comparison. A
carryover effect (from shed to ambient air) can be observed
for nearly all VOC, increasing from methanol, through the
acids, to trimethylamine (TMA). For the latter and for am-
monia, true background may not have been observed within
the half-hour period of ambient air measurements due to ex-
cessive adsorption to the sampling lines. The concentration
increase in the afternoon of 26 January was likely caused
by the periodic excrement removal, the temporary drop
the following day just before noon remains unexplained.
Methanol, VFAs, TMA and other VOC mixing ratios (not
shown) appeared to correlate with temperature. This can be
explained by taking into account that the shed exhaust for
this experiment had been xed at a low ow instead of con-
stantly adjusting to keep pigsty temperature nearly constant,
therefore allowing pigsty temperature to vary.
3.3 Flux estimates
The accuracy of ux calculations from animal buildings
depends on how precisely the trace gas concentrations and
the air exchange rates can be measured. It is difcult to
calculate the air exchange rate in naturally ventilated build-
ings. This has commonly been overcome using a tracer gas
such as sulphur hexauoride to determine the ventilation
rate indirectly. Though SF
6
has unwanted long-term cli-
matic effects, nding a well mixed and inert tracer in the
animal building itself is challenging, further limiting this
method. The carbon dioxide mass balance method has been
used with the assumption that all carbon dioxide produc-
tion in the building is through respiration (CIGR, 2002).
However, this is hardly the case as carbon dioxide is also
produced from other sources such as the manure and litter
(Jeppsson, 2000).
Here, we used two different methods to estimate the re-
lease rates of selected VOCs from the sheep shed: (i) cor-
relations with ammonia or methane multiplied by previ-
ously estimated ammonia or methane uxes, and (ii) model
ts to the concentration prole in the shed to calculate the
constant background production and the semi-instantane-
ous emission rates during cleaning and feeding periods.
VOC uxes for the pigsty unit were estimated using the
correlation method only due to a lack of sufcient data for
analysis using method (ii).
(i) Flux estimate from correlations
This method has previously been used to estimate uxes
(Berges and Crutzen, 1996; Hobbs et al., 2004; Schade
and Crutzen, 1995). Its basis lies much less in the fact that
certain VOCs are formed during the same biological proc-
esses that produce ammonia or methane, but more in the
fact that emissions are often driven by substrate dynamics,
such as biological activity in general, or physical substrate
disturbance. Hence, observed correlations are most often
caused by covariances, not as a result of a biological con-
nection between emitted methane (or ammonia) and VOCs.
This explains why some carefully conducted laboratory
measurements on various manure substrates do not show
strong correlations between these trace gases (Hobbs et al.,
2004) in contrast to eld studies under typical conditions
such as this one. The advantage of the correlation method
in this case is based on the comparatively large body of
research on livestock ammonia and methane emissions.
In Germany, emission rates of methane, ammonia, nitrous
oxide and carbon dioxide have been compiled from many
sources, and were recently summarized through Germa-
ny’s reporting duties on greenhouse and related trace gases
to the United Nations (Dämmgen, 2004). A value of 0.023
Tg a
-1
(Tg = 10
12
g) of methane for the categories “enteric
fermentation” and “manure management”, and 0.002 Tg
a
-1
of ammonia for the category “manure management”
alone have been calculated to come from the holdings of
sheep in Germany for the year 2002. For swine, the report
lists 0.553 Tg a
-1
of methane (from “enteric fermentation”
and “manure management”) and 0.123 Tg a
-1
of ammonia
(from “manure management”) for 2002.
For this study, mass emission ratios for VOCs to meth-
ane or VOCs to ammonia were calculated where signi-
cant correlations where observed (R
2
> 0.5). These were
then multiplied with the above methane (ammonia) mass
release rates to get estimates of nationwide VOC uxes.
The emission ratio E
V
(here for methane) is given by equa-
tion 1:
P
(
VOC
)
shed
P
(
VOC
)
VOC
V
Out
g
/
mol C in
E
*
>
g C
/
g CH
@
(1)
P
(
CH
4
)
shed
P
(
CH
4
4
)
Out
16
g
/
mol CH
4
P
(VOC)
shed
P
(VOC)
Out
is the enhancement of the VOC
mixing ratio in the animal shed to that outside and
P
(CH
4
)
shed
P
(CH
4
)
Out
the enhancement of methane (or
ammonia) mixing ratio to the ambient level. Hence, only a
280
correct relative difference in the measured quantities is
needed. Though errors increase with a decrease in the shed-
to-reference abundance, all reported VOCs showed suf-
ciently large shed to reference concentration differences, as
was true for ammonia and methane.
We observed the strongest correlations between trace
gases that have similar emission sources within the ani-
mal sheds (manure or the animals) or that have a similar
biochemical production process, such as acetic acid and
methane from fermentation. These species had R
2
values
of 0.8 and better. A summary of our ndings is presented
in Table 2 (sheep shed) and Table 3 (pigsty). In the sheep
shed, ethanol had the highest emission with a range of
1.5 – 6.0 Gg a
-1
C but showed no signicant correlation
with methane in the pigsty. However methanol did have a
good correlation with methane emitted from the pigsty and
was found to be the largest single emission with a value of
3 – 9 Gg a
-1
C.
Table 2:
Flux estimates of VOC from sheep shed based on correlation with methane or ammonia. Values for methane and ammonia emissions for 2002 were adopted
from Dämmgen (2004)
VOC Statistics
E
V
CH
4
/ NH
3
Emission VOC Emission
(g C) / (g CH
4
)
(± 30 %) [g a
-1
] [Gg a
-1
C]
R
2
= 0.88
Methanol N = 1017 (1.2 ± 0.2) × 10
-3
0.023 × 10
12
CH
4
0.02 – 0.04
Acetaldehyde
R
2
= 0.89
N = 1049
+ 1.5
(3.8
– 1.0
) × 10
-3
0.023 × 10
12
CH
4
0.04 – 0.16
Ethanol
R
2
= 0.88
N = 1049
+ 73
(128
– 37
) × 10
-3
0.023 × 10
12
CH
4
1.5 – 6.0
R
2
= 0.94
Acetone N = 1049 (6.8 ± 1.1) × 10
-4
0.023 × 10
12
CH
4
0.01 – 0.02
R
2
= 0.80
Propanol N = 1128 (6.1 ± 1.0) × 10
-4
0.023 × 10
12
CH
4
0.01 – 0.02
R
2
= 0.96 < 0.001
DMS N = 1128 (3.5 ± 0.5) × 10
-5
0.023 × 10
12
CH
4
(0.6 – 1.6 Mg a
-1
S)
MEK
R
2
= 0.81
N = 1128
+ 1.8
(5.9
– 1.3
) × 10
-5
0.023 × 10
12
CH
4
< 0.003
R
2
= 0.88
Acetic acid N = 1128 (3.0 ± 0.5) × 10
-4
0.023 × 10
12
CH
4
< 0.01 – 0.02
Propionic acid
R
2
= 0.84
N = 1049
+ 1.4
(3.6
–
) × 10
-4
1.1
0.023 × 10
12
CH
4
< 0.015
R
2
= 0.87
TMA N = 1049 (4.8 ± 1.3) × 10
-4
0.023 × 10
12
CH
4
< 0.01 – 0.02
R
2
= 0.85 < 0.01 – 0.02
TMA N = 996 (4.9 ± 1.5) × 10
-3
0.002 × 10
12
NH
3
(2.3 – 7.8 Mg a
-1
N)
(ii) Flux estimate from emission prole model in the sheep
shed
We analyzed short-term abundance increases and their ex-
ponential decay to derive apparent shed air turnover rates
and constant background trace gas emission rates. This was
done using equation 2 with the assumptions (i) of observ-
ing well-mixed air, (ii) that dilution with reference air from
outside the shed was the dominant process that resulted in
the decay of the VOC abundance, and (iii) that chemical or
physical removal inside the shed is negligible.
x(t)
x
0
x
bg
u exp
D u t
x
bg
P'
(2)
In equation 2, x is the mixing ratio at time t, x
0
the mixing
ratio at the top of a concentration spike, x
bg
the background
or reference mixing ratio measured outside the shed, D the
decay constant (dilution rate [h
-1
]), t the step time being
equivalent to 107 s, and P’ the constant mixing ratio added
from continuous emissions into the shed during one meas-
urement cycle of 107 s. Using the value of P’ from the
non-linear model t, a constant mass ux P of the VOC
during each period was calculated assuming an instanta-
neous dilution into the known shed volume. A non-linear
least squares routine was tted using both the morning and
afternoon spikes, as there might be differences between
them. The results of this analysis for selected VOCs that
produced good ts are summarised in Table 4. The dilu-
tion rates D did not vary signicantly between the model
t suggesting that the assumptions about the concentration
N. M. Ngwabie, G. W. Schade, T. G. Custer, S. Linke and T. Hinz / Landbauforschung Völkenrode 3 / 2007 (57):273-284
281
decay being largely due to dilution is supported. Produc-
tion values P showed much larger variation as is expected
for the different compounds, sources and production rates.
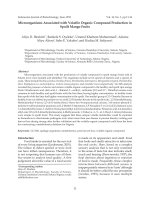
To estimate the contribution of the actual emission surge
to the total emissions, we assumed that each abundance
spike was caused by a short duration, symmetric emission.
This was then modelled as being Gaussian in shape, adjust-
ing the height and width to t the measurements, assum-
ing the measurements represented a resultant mixing ratio
from this nearly instantaneous emission into the shed, with
its volume and dilution rate as given parameters. A typi-
cal model curve for methanol is depicted in Figure 4. The
bell-shaped model curve was then integrated and scaled to
the number of sheep in the shed. Lastly, we converted this
animal emission factor to an annual ux using a total of 2
spikes in a day, 365 days in a year and 2771100 sheep for
Germany (Dämmgen, 2004), with the annual ux derived
from the mean of four to eight integrated spikes (Table 4).
Table 4 contains ux estimates from both sub-models,
and emission values were estimated for Germany assum-
ing that emission factors do not differ signicantly across
different sheds and that management systems are fairly
constant over the entire country.
Table 3:
Flux estimates of VOC from pigsty based on correlation with methane or ammonia. Values for methane and ammonia emissions for 2002 were adopted from
Dämmgen (2004)
VOC Statistics
E
V
CH
4
/ NH
3
Emission VOC Emission
(g C) / (g CH
4)
(± 30 %) [g a
-1
] [Gg a
-1
C]
R
2
= 0.92
Methanol N = 685 (1.1 ± 0.2) × 10
-2
0.55 × 10
12
CH
4
6.1 ± 3.1
R
2
= 0.96
Acetone N = 578 (7.3 ± 1.1) × 10
-3
0.55 × 10
12
CH
4
4.0 ± 2.0
R
2
= 0.95 0.8 ± 0.5
DMS N = 597 (1.5 ± 0.3) × 10
-3
0.55 × 10
12
CH
4
(0.3 – 1.1 Gg a
-1
S)
R
2
= 0.95
MEK N = 685 (1.1 ± 0.2) × 10
-3
0.55 × 10
12
CH
4
0.6 ± 0.3
R
2
= 0.91
Propionic acid N = 685 (4.5 ± 0.9) × 10
-3
0.55 × 10
12
CH
4
2.5 ± 1.4
R
2
= 0.92
Butyric acid N = 685 (4.9 ± 0.9) × 10
-3
0.55 × 10
12
CH
4
2.7 ± 1.5
R
2
= 0.91
Valeric acid N = 624 (7.0 ± 1.3) × 10
-4
0.55 × 10
12
CH
4
0.4 ± 0.2
R
2
= 0.94
Acetaldehyde N = 614 (2.8 ± 0.5) × 10
-3
0.12 × 10
12
NH
3
0.3 ± 0.2
Acetone
R
2
= 0.93
N = 525
+ 1.5
(7.2
– 1.2
) × 10
-3
0.12 × 10
12
NH
3
+ 0.5
0.9
– 1.4
Butyric acid
R
2
= 0.93
N = 627
+ 1.1
(4.8
– 0.7
) × 10
-3
0.12 × 10
12
NH
3
+ 0.3
0.6
– 0.2
R
2
= 0.92 0.6 ± 0.3
TMA N = 627 (5.4 ± 0.7) × 10
-3
0.12 × 10
12
NH
3
(0.1 – 0.35 Gg a
-1
N)
Figure 4:
Example of modeled mixing ratio curve for methanol in the sheep shed.
The spike emission model has a 30 minutes offset in time for clarity
34.5 34.6 34.7 34.8 34.9 35.0 35.1 35.2
0.0 0.5 1.0 1.5 2.0
Day of Year 2005
Shed emission surge
Spike emission model
Model (without dilution)
Model (with dilution)
methanol (ppm)
282
Table 4:
Selected VOC emissions from spike analysis for sheep. Errors indicate
statistical variability
VOC
D P
S Annual ux
‡
[h
-1
] [mg sheep
-1
[mg sheep
-1
[Gg a
-1
C]
h
-1
]
spike
-1
]
Methanol 1.09 26 ± 13 103 ± 52 0.3 ± 0.1
Acetalde-
hyde
0.82 45 ± 40 60 ± 21 0.7 ± 0.5
Ethanol 1.07 2124 ± 1644 8569 ± 3700 40 ± 20
Acetic
acid
0.91 8 ± 5 12 ± 9 0.09 ± 0.05
Propionic
acid
1.06 4 ± 2 168 ± 303 0.2 ± 0.3
Butyric
acid
1.11 3 ± 2 36 ± 48 0.08 ± 0.06
Valeric
acid
0.93 0.2 ± 0.1 1 ± 1 0.005 ± 0.003
Caproic
acid
1.15 0.3 ± 0.2 9 ± 14 0.02 ± 0.02
D: Decay rate; P: Constant production; S: Production from emission spikes.
‡
2771100 sheep for Germany (Dämmgen, 2004), 2 Spikes per day, 365
per year.
days
On comparing the ux values from both the correlation
and the dilution modelling methods in the sheep shed, we
observed a difference by an order in magnitude for most of
the species (Tables 2 and 4). Though both methods have
shortcomings, the most likely factor leading to larger val-
ues for the second model is the assumption that the animals
spend all year inside the shed, and that the conditions en-
countered during the campaign were representative under
that assumption. In the case of the sheep shed investigated,
the above calculation showed a relatively large effect of
the spikes on total emissions. Such spikes will hardly occur
when the sheep are not inside the shed. Hence, the second
model likely creates an overestimate of emissions. The cor-
relation estimate does not include such assumptions, but
instead presumes that the relative emission of VOC per
ammonia or methane remains nearly constant, whether the
animals are inside or outside the shed. Thereafter, the ex-
trapolation gives a mean value under the conditions previ-
ously evaluated for the reference emission, i.e. of methane
and ammonia.
Generally, the use of emission factors from one animal
shed to calculate regional emissions may pose problems
as there can be differences in animal nutrition and man-
agement systems, and differences in manure manage-
ment leading to various emission sources within different
animal housings. Controlled experiments have shown that
factors like temperature, humidity and ventilation rate can
also inuence emission rates (Nimmermark and Gustafs-
son, 2005). Another issue of concern is that the CH
4
and
NH
3
uxes used for VOC ux extrapolation that were for
“manure management” plus “enteric fermentation” and for
“manure management”, respectively, may not have been
representative for the measurement situation. The factors
extend to both grazing and housed animals and all types of
manure management systems. We used these uxes with
calculated emission ratios from housed livestock only and
for a specic manure management system for VOC ux
estimation. Therefore our estimates are possibly not com-
prehensive and may have an associated error of a factor of
two at least.
Table 5:
Emission ratio (E
V
) of VOC to NH
3
in Germany and the UK compared
Animal Type VOC
E
V
Germany E
V
UK
‡
Pigs Acetone 6 – 9 × 0 1
-3
< 0. 1 × 0 1
-3
Acetic acid NA 0.1 – 0.2
Propionic acid 3 – 6 × 0 1
-3
6 – 9 × 0 1
-3
DMS .2 –1 .8 × 1 0 1
-3
0.05 – 0. 15
Valeric acid 0.6 – 0.8 × 0 1
-3
0 – 30 ×1 0 1
-3
p-cresol 1 – 3 × 0 1
-3
70 – 90 × 0 1
-3
Sheep Acetone 5 – 8 × 0 1
-3
5 – 8 × 0 1
-3
Acetic acid 2 – 4 × 0 1
-3
0 – 20 ×1 0 1
-3
Propionic acid 2 – 4 × 0 1
-3
< 1 × 0 1
-3
DMS 0.3 – 0. 4 × 0 1
-3
0.15 – 0.3
‡
Hobbs et al., 200 ; NA = Not Applicable4
When we compare our emission ratios (Table 5) to am-
monia with published values from the United Kingdom
(Hobbs et al., 2004), same order of magnitude results are
obtained for a number of VOCs for which data exist in both
cases. The largest differences were found for p-cresol and
higher volatile fatty acids, as well as for DMS. Differences
among the VFA’s are not surprising, because differences
in manure degradation age and bacterial composition can
readily cause different VFA abundances. The difference for
DMS remains unexplained.
4 Conclusions
With the use of a proton transfer reaction mass spectrom-
eter we have identied and measured the mixing ratios
of major volatile organic compounds emitted by pigs and
sheep in Germany. The diurnal variations of carbon diox-
ide, nitrous oxide, methane, and ammonia have also been
monitored with the aid of a photo-acoustic analyser.
The results are summarised as follows:
1) Some 17 major VOCs were measured in the sheep shed
while in the pigsty we identied 15 main compounds
N. M. Ngwabie, G. W. Schade, T. G. Custer, S. Linke and T. Hinz / Landbauforschung Völkenrode 3 / 2007 (57):273-284
283
with the PTR-MS.
2) Trace gas emissions showed periodic spikes with emis-
sion surges coinciding with manure removal and animal
feeding.
3) Using VOC correlations with ammonia or methane, we
calculated emission factors for Germany. Some of our
emission factors are in line with those for the UK cal-
culated by Hobbs et al., (2004). Major deviations were
found for p-cresol, higher acids, and with DMS having
the largest disagreement.
4) Mass release rates of VOCs were also modelled from
the emission proles in the sheep shed. We found large
discrepancies likely related to high short-term emissions
during manure removal, and the assumption that the ani-
mals remain inside the shed all year round.
5) Emissions were dominated by methanol in the pigsty
and ethanol in the sheep shed.
6) Legal threshold limits for livestock and human welfare
were not exceeded in both sheds monitored.
Table 6:
VOC Emissions from animal husbandry in Germany in Gg a
-1
C. Calcu-
lated from correlation with methane unless stated otherwise.
VOK Dairy Pigs Sheep Total
cows
‡
Methanol 0.7 – 2.3 3 – 9 0.02 – 0.04 3.7 – 11
Ethanol 4 – 31 NA 1.5 – 6 5.5 – 37
Acetalde- 0.3 – 1.2 0.1 – 0.5 0.04 – 0.7 0.4 – 2.4
hyde
Acetone 0.4 – 1.3 0.5 – 6 0.01 – 0.02 0.9 – 7.3
MEK 0.1 – 0.3 0.3 – 0.9 < 0.003 0.4 – 1.2
“Propa- 0.1 – 2 ~0.01 0.01 – 0.02 0.1 – 2
nols”
Acetic acid 1 – 5 NA < 0.01 – 0.02 1 – 5
Propionic 0.14 – 0.5 1 – 4 < 0.015 1.1 – 4.5
acid
Butyric 0.2 – 0.4 0.4 – 4 0.02 – 0.14
†
0.6 – 4.5
acid
Valeric acid 0.02 – 0.04 0.2 – 0.6 0.002 – 0.008
†
0.2 – 0.6
DMS 0.04 – 0.23 0.3 – 1.3 < 0.001 0.3 – 1.5
TMA 0.3 – 2 0.3 – 0.9 0.01 – 0.02 0.6 – 2.9
Sum 7 – 45 6 – 27 2 – 7 15 – 77
NA = Not Applicable,
‡
Ngwabie et al., 2007,
†
Calculated from emission model
A summary of our VOC emission estimates for the three
livestock types investigated (Table 6, including previously
published work) indicates that emissions are dominated
by ethanol and methanol with ethanol mainly released by
cows and methanol mainly by pigs, which maybe due to
the differences in nutrition and digestive systems. For in-
stance, pigs are not ruminants but receive a higher amount
of pectin in their diets compared to cows, with pectin a
potentially dominant source of emitted methanol (Galbally
and Kirstine, 2002). On the other hand, if the main source
of acetone is animal respiration (fat metabolism), then this
would explain our measurements (and the discrepancy to
the UK measurements, Table 5), as there was no strong
tendency for a dominant acetone emission from a certain
animal species.
The total annual VOC emissions from the measured ani-
mal groups were estimated to range from as low as 15 to
as high as 77 Tg carbon. Taking into account that the Ger-
man cow population is three times as high including all
other than just dairy cows, and that poultry emissions were
not investigated in this study, likely increases the actual
emissions by a factor of two. Considering further that the
numbers in Table 6 are likely only accurate to a factor of
two, we estimate that German VOC emissions from animal
husbandry likely range from 100 to 200 Gg C per year.
Though this is only slightly smaller to the previous esti-
mate or ~230 Tg C (Dämmgen, 2004), which was based
on the work of Hobbs et al. (2004), the determined VOC
composition is much different. That is to say, emissions
are dominated by short-chained alcohols, and not VFAs
and DMS. Interestingly, the magnitude compares well
with VOC emissions of car trafc in Germany, estimated
by the German Umweltbundesamt to have been 250 Gg
C per year in 2002. However, the animal emissions are of
fundamentally different origin and composition. While car
trafc emissions are dominated by partially highly reac-
tive hydrocarbons, animal emissions are dominated by
relatively unreactive alcohols, acetone, and acids. Hence,
the impact of animal husbandry VOC emissions on tropo-
spheric ozone is likely smaller, though not conned to the
atmospheric boundary layer but possibly affecting free
tropospheric ozone chemistry.
Our measurements are a starting point and a reference for
further VOC identication and quantication from animal
husbandry. To augment these measurements, there is need
to access trace gas emissions from other animal categories,
such as bulls, and birds for a full impact on the environ-
ment. In addition, the effects of different holding types
and manure treatment types among the dominant emitters
needs close examination. Though there has been research
into some methods to reduce emissions during feeding like
spraying with water droplets or a water/oil mixture, and
addition of tallow to animal feed, much work still has to
be done to nd ways to avoid large spikes during active
periods as shown by our measurements. In addition , better
ventilation and management practices may go a long way
to reducing emissions from animal manure and reducing
exposure to farm workers and the animals themselves.
284
Acknowledgement
We are grateful to Mr. Zieseniss and Mr. Lindwedel from
the FAL in Mariensee for information about the shed activ-
ities, and Olaf Schroeder of FAL Braunschweig for his help
at the experimental sites. This work was partially funded by
the Bundesanstalt für Landwirtschaft und Ernährung (BLE)
under project number 514-33.26/04HS006. Full funding
for N.M. Ngwabie came from the German Research Foun-
dation (DFG) under project number SCHA922/2-1.
References
Berges MGM, Crutzen PJ (1996) Estimates of global N2O emissions
from cattle, pig and chicken manure, including a discussion of CH4
emissions. J Atm Chem 24(3):241-269
Buhr K, Ruth S van, Delahunty C (2002) Analysis of volatile flavour com-
pounds by proton transfer reaction-mass spectrometry : fragmentation
patterns and discrimination between isobaric and isomeric compounds.
Int J Mass Spectrom Ion Phys 221(1):1-7
CIGR (2002) Climatisation of animal houses : forth report of working
group. Danish Institute of Agricultural Sciences, Research Centre
Bygholm
Dämmgen U (ed) (2004) Nationaler Inventarbericht 2004 - Berichterstat-
tung unter der Klimarahmenkonvention der Vereinten Nationen : Teil-
bericht für die Quellgruppe Landwirtschaft. Braunschweig : FAL, 279
p, Landbauforsch Völkenrode SH 260
Filipy J, Rumburg B, Mount G, Westberg H, Lamb B (2006) Identifica-
tion and quantification of volatile organic compounds from a dairy.
Atmos Environ 40(8):1480-1494
Galbally IE, Kirstine W (2002) The production of methanol by flowering
plants and the global cycle of methanol. J Atm Chem 43(3):195-229
Gouw J de, Warneke C, Karl T, Eerdekens G, Veen C van der, Fall R
(2003) Sensitivity and specificity of atmospheric trace gas detection by
proton-transfer-reaction mass spectrometry. Int J Mass Spectrom Ion
Phys 223:365-382
Gustafsson G, Wachenfelt E v (2006) Airborne dust control measures for
floor housing system for laying hens [online]. Zu finden in < http://cigr-
ejournal.tamu.edu/submissions/volume8/BC%2005%20018%20Gusta
fsson%20near%20final%2014Aug2006.pdf> [zitiert am 16.07.2007]
Hartungen E von, Wisthaler A, Mikoviny T, Jaksch D, Boscaini E, Dun-
phy PJ, Mark TD (2004) Proton-transfer-reaction mass spectrometry
(PTR-MS) of carboxylic acids : determination of Henry‘s law con-
stants and axillary odour investigations. Int J Mass Spectrom Ion Phys
239(2-3):243-248
Hobbs PJ, Misselbrook TH, Pain BF (1997) Characterisation of odorous
compounds and emissions from slurries produced from weaner pigs
fed dry feed and liquid diets. J Sci Food Agric 73(4):437-445
Hobbs PJ, Misselbrook TH, Pain BF (1998) Emission rates of odorous
compounds from pig slurries. J Sci Food Agric 77(3):341-348
Hobbs PJ, Webb J, Mottram TT, Grant B, Misselbrook TM (2004) Emis-
sions of volatile organic compounds originating from UK livestock
agriculture. J Sci Food Agric 84(11):1414-1420
Jeppsson KH (2000) SE-structure and environment : carbon dioxide
emission and water evaporation from deep litter systems. J Agric Eng
Res 77(4):429-440
Lindinger W, Hansel A, Jordan A (1998) Online monitoring of volatile
organic compounds at the ppt levels by means of Proton-Transfer-
Reaction Mass Spectrometry (PTR-MS) : medical applications, food
control and environmental research. Int J Mass Spectrom Ion Phys
173:191-241
McGinn SM, Janzen HH, Coates T (2003) Atmospheric ammonia, vola-
tile fatty acids, and other odorants near beef feedlots. J Environ Quality
32(4):1173-1182
Ngwabie MN, Schade GW, Guster T, Linke S, Hinz T (2007) Abundance
and flux estimates of volatile organic compounds from a dairy cowshed
in Germany. J Environ Quality
Nimmermark S, Gustafsson G (2005) Influence of temperature, humidity
and ventilation rate on the release of odour and ammonia in a floor
housing system for laying hens [online]. Zu finden in < http://cigr-
ejournal.tamu.edu/CIGRStyleGuidelinesExample.pdf> [zitiert am
16.07.2007]
Rabaud NE, Ebeler SE, Ashbaugh LL, Flocchini RG (2002) The applica-
tion of thermal desorption GC/MS with simultaneous olfactory evalu-
ation for the characterization and quantification of odor compounds
from a dairy. J Agric Food Chem 50(18):5139-5145
Rabaud NE, Ebeler SE, Ashbaugh LL, Flocchini RG (2003) Characteri-
zation and quantification of odorous and non-odorous volatile organic
compounds near a commercial dairy in California. Atmos Environ
37(7):933-940
Schade GW, Crutzen PJ (1995) Emissions of aliphatic amines from ani-
mal husbandry and their reactions : potential source of N2O and HCN.
J Atmos Chem 23:319-346
Shaw SF, Mitloehner M, Jackson W, Depeters EJ, Fadel JG, Robinson PH,
Holzinger R, Goldstein AH (2007) Volatile organic compound emis-
sions from dairy cows and their waste as measured by proton-transfer-
reaction mass spectrometry. Environ Sci Technol 14:1310-1316
Schiffman SS, Bennett JL, Raymer JH (2001) Quantification of odors and
odorants from swine operations in North Carolina. Agric For Meteorol
108(3):213-240
Spanel P, Smith D (1997) SIFT studies of the reactions of H3O+, NO+,
and O2+ with a series of alcohols. Int J Mass Spectrom Ion Phys
167/168:375-388
Spinhirne JP, Koziel JA, Chirase NK (2003) A device for non-invasive
on-site sampling of cattle breath with solid-phase microextraction.
Biosystems Eng 84(2):239-246
Spinhirne JP, Koziel JA, Chirase NK (2004) Sampling and analysis of
volatile organic compounds in bovine breath by solid-phase micro-
extraction and gas chromatography-mass spectrometry. J Chromat A
1025(1):63-69
Warneke C, Gouw JA de, Kuster WC, Goldan PD, Fall R (2003) Valida-
tion of atmospheric VOC measurements by proton-transfer-reaction
mass spectrometry using a gas-chromatographic preseparation method.
Environ Sci Technol 37(11):2494-2501
Warneke C, Kuczynski J, Hansel A, Jordan A, Vogel W, Lindinger W
(1996) Proton transfer reaction mass spectrometry (PTR-MS) : propa-
nol in human breath. Int J Mass Spectrom Ion Phys 154:61-70
Zhang Y, Tanaka A, Dosman JA, Senthilselvan A, Barber EM, Kirychuk
SP, Holfeld LE, Hurst TS (1998) Acute respiratory responses of human
subjects to air quality in a swine building. J Agric Eng Res 70(4):367-
373