Detection of Pseudomonas aeruginosa in sputum headspace through volatile organic compound analysis potx
Bạn đang xem bản rút gọn của tài liệu. Xem và tải ngay bản đầy đủ của tài liệu tại đây (445.4 KB, 9 trang )
RES E A R C H Open Access
Detection of Pseudomonas aeruginosa in sputum
headspace through volatile organic
compound analysis
Pieter C Goeminne
1,4*
, Thomas Vandendriessche
2
, Johan Van Eldere
3
, Bart M Nicolai
2
, Maarten LATM Hertog
2
and Lieven J Dupont
1
Abstract
Introduction: Chronic pulmonary infection is the hallmark of Cystic Fibrosis lung disease. Searching for faster and
easier screening may lead to faster diagnosis and treatment of Pseudomonas aeruginosa (P. aeruginosa). Our aim
was to analyze and build a model to predict the presence of P. aeruginosa in sputa.
Methods: Sputa from 28 bronchiectatic patients were used for bacterial culturing and analysis of volatile
compounds by gas chromatography–mass spectrometry. Data analysis and model building were done by Partial
Least Squares Regression Discriminant analysis (PLS-DA). Two analysis were performed: one comparing P. aeruginosa
positive with negative cultures at study visit (PA model) and one comparing chronic colonization according to the
Leeds criteria with P. aeruginosa negative patients (PACC model).
Results: The PA model prediction of P. aeruginosa presence was rather poor, with a high number of false
positives and false negatives. On the other hand, the PACC model was stable and explained chronic P. aeruginosa
presence for 95% with 4 PLS-DA factors, with a sensitivity of 100%, a positive predictive value of 86% and a
negative predictive value of 100%.
Conclusion: Our study shows the potential for building a prediction model for the presence of chronic
P. aeruginosa based on volatiles from sputum.
Keywords: Bronchiectasis, Chronic colonization, Gas chromatography mass spectro metry, Cystic fibrosis,
Non-cystic fibrosis
Introduction
Chronic pulmonary infection is the hallmark of Cystic
Fibrosis (CF) lung disease. Preventing or treating chronic
infection plays a key role in these patients. Previous
studies showed that Pseudomonas aeruginosa (P. aerugi-
nosa) infection is associated with lower forced expiratory
volume in one secon d (FEV
1
) during childhood, faster
decline in FEV
1
during childhood and reduced survival
[1-9]. Chronic P. aeruginosa infection is normally pre-
ceded by an intermittent presence of the bacteria [10].
Early eradication during this period is important to delay
chronic colonization [11]. To accomplish early eradica-
tion, regular surveillance cultures of sputum are indi-
cated. For non-expectorating patients, oropharyngeal
swabs or bronchoalveolar lavage can be used [10].
One of the difficulties measuring successful eradica-
tion is proving that the bacteria are completely elimi-
nated from the patient, rather than just temporarily
suppressed to a low level that is not detectable, particu-
larly by cough swab [12,13]. Sputum culture can be false
negative due to overgrowth of other bacteria or (main-
tenance) treatment with inhaled or oral antibio tics
[14,15]. A positive culture should not be regarded as a
gold standard for diagnosing (chronic) P. aeruginosa in-
fection in CF patients with bronchiectasis and repeated
culturing is still a cornerstone of a possible classification
based on both bacterial cultures and specific antibody
* Correspondence:
1
Department of Lung Disease, UZ Leuven, Leuven, Belgium
4
Pulmonary Medicine, University Hospital Gasthuisberg, Herestraat 49, Leuven
B-3000, Belgium
Full list of author information is available at the end of the article
© 2012 Goeminne et al.; licensee BioMed Central Ltd. This is an Open Access article distributed under the terms of the
Creative Commons Attribution License ( which permits unrestricted use,
distribution, and reproduction in any medium, provided the original work is properly cited.
Goeminne et al. Respiratory Research 2012, 13:87
/>analysis [16]. Repeated culturing is also the cornerstone
in non-CF bronchiectasis for the diagnosis of chronic P.
aerugiosa although different definitions are used [17].
Therefore, other techniques aiming at diagnosis and
follow-up of bacterial infection are being investigated.
One approach is detection of volatile organic com-
pounds (VOCs) produced by bacter ia. P. aeruginosa may
be detected by analyzing VOCs pro duced in vitro
(Table 1), although the many studies addressing this
question measured a variable range of VOCs. Breath or
sputum samples are more challenging to investigate as
many factors might infl uence the VOCs spectrum (eg.
recent meal, other bacteria, concomitant medication). A
few studies investigating in vivo samples (breath, sinus
mucus and sputum) (Table 1) suggest that P. aeruginosa
can be detected via the breath using not only hydrogen
cyanide as a single marker [18], but also other biomar-
kers [19,20]. These in vivo studies use bacterial cultures
as a gold standard to assess P. aeruginosa presence in
the sample, not taking into account chronically colo-
nized patients with a false negative sputum culture.
The aims of our study were to predict sputum culture
positivity for P. aeruginosa in patients with bronchiec-
tasis (PA model) and to predict chronic colonization sta-
tus with P. aerug inosa in patients with bronchiectasis
(PACC model) by analysis of the presence of VOCs
(Figure 1).
Materials and methods
Patients
Consecuti ve patients who were visiting the outpa tient
clinic with CF and non-CF bronchiectasis were included
in the study. They were asked to colle ct their morn-
ing sputa, after rinsing their mouth with water and
before breakfast, and to bring it to the outpatient clinic.
A part of the sputum was used for routine bacterial
culture. The second part was used for VOC s analysis
within two hours of outpatient clinic visit. Clinical
records were reviewed to assess chronic colonization
status according to the Leeds criteria [32]. In brief,
chronic colonization is diagnosed when more than 50%
of the months, when samples had been taken, were
P. aeruginosa culture positive. Informed consent was
obtained from all patients. Approval was obtained from
the local ethical committee of UZ Leuven, Belgium
(B51060 - B32220084152).
Table 1 Literature overview of volatile organic
compounds found in in vitro and in vivo studies in
samples with Pseudomonas aeruginosa
In vitro Volatiles reference
acetaldehyde, acetic acid, acetone,
ammonia, ethanol, dihydrogen sulfide,
dimethyl disulfide, dimethyl sulfide,
methyl mercaptan
[21]
ammonia, hydrogen cyanide,
methyl mercaptan
[22]
hydrogen cyanide [23]
2-aminoacetophenone, ammonia,
ethanol, formaldehyde, hydrogen sulfide,
isoprene, methyl mercaptan,
trimethylamine
[24]
2-aminoacetophenone, 2-pentanone,
4-methylphenol, acetic acid, acetone,
acetonitrile, ethanol, ethylene glycol,
indole
[25]
1-butanol, 1-undecene, 2-butanone,
2-heptanone, 2-nonanone, 2-undecanone,
3-methyl-1-butanol, toluene
[26]
2-aminoacetophenone [27]
1-undecene, 2-aminoacetophenone,
2-butanone, 2-nonanone, 2-undecanone,
3-methyl-1-butanol, 4-methyl-quinazoline,
butanol, dimethyl disulfide, dimethyl trisulfide,
methyl mercaptan, toluene
[28]
2-propanol [29]
2-aminoacetophenone, dimethyl disulfide,
dimethylpyrazine, dimethyl sulfide,
undecene
[30]
Methyl thiocyanate [20]
In vivo
breath hydrogen cyanide [18]
breath Methyl thiocyanate [20]
breath 2-propanol [29]
sinus mucus 2-aminoacetophenone, 2-methylbutyric acid,
3-hydroxy-2-butanone, acetamide,
acetic acid, acetone, dimethyl disulfide,
dimethyl sulfide, dimethylsulfone,
hydrogen sulfide, indole, isovaleric,
phenol, propanoic acid
[30]
sputa 1-heptene, 2-nonanone, 2,4-dimethyl-heptene,
3-methyl-1-butanol, limonene
[31]
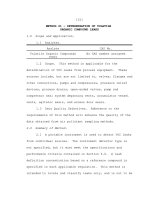
Figure 1 Volatile analysis flow-chart. Sputum culture was
first analyzed for the presence of P. aeruginosa. The PA model
analyzed positive versus negative P. aeruginosa patients. In a second
step the Leeds criteria were applied to each patient to determine
P. aeruginosa chronic colonization [32]. The PACC model
compared chronically colonized patients with non-chronically
colonized patients. PA = P. aeruginosa; PACC = P. aeruginosa
chronic colonization.
Goeminne et al. Respiratory Research 2012, 13:87 Page 2 of 9
/>Detection of volatiles
From every patient 20 grams of morning sputum was
transferred into a 10 mL glass headspace vial (Filter Ser-
vice, Belgium) within 4 hours from collection, flushed
with nitrogen gas and sealed using crimp-top caps with
TFE/silicone septa seals (Filter Service, Belgium). Prior
to solid phase micro extraction (SPME), the sputum
samples were incubated for 24h at 37°C in a heated
tray oven. Headspace volatiles were extracted by expos-
ing a divinylbenzene-carboxen-polydimethylsiloxane SPME
fiber (DVB-CAR-PDMS, 50/30 μm film thickness;
Supelco Inc., Bellefonte, PA, USA) to the vial headspace
for 60 min at 37°C. The headspace in our samples is
defined by the gaseous constituents of the closed space
above the sputum. Every 100 measurements, a new fiber
was used. Each fiber was conditioned according to man-
ufacturer’s description.
The determination of the VOCs was performed on an
Agilent 6890N gas chromatograph (GC) (Agilent Tech-
nologies, Santa Clara, USA) coupled to an Agilent 5973
Network Ma ss Selective Detector (MS) (Agilent Tech-
nologies, Santa Clara, USA). Automated headspace
SPME extraction was performed with an MPS-2 robotic
arm (MPS2, Gerstel Multipurpose Sampler, Mülheim an
der Ruhr, Germany). After extraction, the VOCs were
thermally desorbed into a split/splitless injector heated
at 250°C and equipped with a SPME liner (0.75 i.d.,
Supelco Inc., USA). To detect low concentration vola-
tiles, splitless injection was used. Splitless injection
was performed for 0.5 min at 75 mL/min and the
fiber was further exposed in the injector for 5 min for
thermal conditioning.
Separation was done on an Optima-5-MS capillary
column (30 m x 0.25 mm i.d. x 0.25 μmd
f
) (Mache rey-
Nagel, Germany). Helium was used as carrier gas under
a constant flow of 1.0 mL/min. The GC temperature
program started isothermal at 35°C for 3 min and was
then ramped to 250°C at a rate of 10°C min
-1
. Finally,
the temperature was kept isothermal at 250°C for 5 min.
The total run time was 29.50 min. The GC interface
temperature was 280°C.
Mass spectra in the 15 to 350 m/z range were
recorded at a scanning speed of 4.15 scans cycles per
second. The MS source and quadrupole temperatures
were 230°C and 150°C respectively. The chromatography
and spectral data were evaluated using the MSD Chem-
Station Software (Agilent Technologies, Santa Clara,
USA) and AMDIS v. 2.1 (Automated Mass Spectral De-
convolution and Identification System, NIST, Gaithers-
burg, MD, USA). Only those compounds with a signal
to noise ratio > 20 and that could be identified through
comparison with the spectral library NIST having a
match and reversed match percentage > 80% and from
which additionally the spectrum was manually
controlled, were included in the analysis. The volatile
compounds were identified by comparing the experi-
mental spectra with those of the National Institute for
Standards and Technology (NIST98 v. 2.0, Gaithersburg,
MD, USA) and by retention indices. The reten tion time
is the characteristic time it takes for a specific volatile to
pass through the system. The (Kovats) retention index
of a compound is its retention time normalized to the
retention times of adjacently eluting n-alkanes. They
help to identify components by comparing experimen-
tally found retention indices with known values. The
Kovats retention index is used to allow other analytical
laboratories to compare measured values. We evaluated
VOCs with a molecular weight higher than 30. Lower
molecular weight VOCs (such as Hydrogen Cyanide)
could not be evaluated as too many small compounds
were co-eluting in the beginning of the chromatogram.
Therefore, it was not possible to determine their pres-
ence in a reliable way (even with deconvolution pro-
grams). Hydrocarbon standards (C
8
to C
20
in hexane,
Sigma-Aldrich, Steinheim, Germany) were injected using
the same G C-MS method to determine the retention
indices of the individual compounds using a modified
Kovats method [33].
Bacterial culturing
Sputa were inoculated on standard culture media (Blood
agar with optochin disc, Mannitol Salt agar and Mac-
Conkey agar). Selective culture media were used for
Haemophilus spp. (Haemophilus agar) Burkholderia
cepacia complex (Mast B. cepacia complex agar) and
fungi (Sabouraud agar)
Pseudomonas aeruginosa (PA) model
For the PA model, we compared patients with a P. aeru-
ginosa positive sputum culture at study to those with a
negative P. aeruginosa sputum culture at study visit
(Figure 1).
Pseudomonas aeruginosa chronically colonized
(PACC) model
For the PACC model, we compared patients with a
known P. aeruginosa colonization according to the Leeds
criteria to those without P. aeruginosa colonization at
study visit (Figure 1) [32].
Multivariate data analysis
All data was evaluated using multivariate data analysis
techniques, including Principal Component Analysis
(PCA) and Partial least-squares discriminant analysis
(PLS-DA). The former is an unsupervised explorative
method which is based on the principle of latent vari-
ables. It transforms large multivariate datasets of corre-
lated variables into a new (reduced) dataset containing
Goeminne et al. Respiratory Research 2012, 13:87 Page 3 of 9
/>orthogonal (uncorrelated) variables only, named princi-
pal components. The latter is then used to reveal the
relation of the samples to a given parameter, where the
predictor variable is used in the calculation of the latent
variables. The goal is to describe as much of the re-
sponse variation and to search for directions that are
relevant with respect to the predictor varia ble. The
obtained PLS model can be further used to predict the
predictor variable response for unknown samples. Data
preprocessing steps included mean centering and weigh-
ing of all variables by their standard deviation to give
them equal variance. In order to eval uate every dataset
before analysis, a PCA was conducted to detect possible
outlying samples by means of the 95% Hotelling’sT
2
limit. Hotelling's T-squared statistic is a generalization of
Student’s t statistics that is used in multivariate hypoth-
esis testing. Two samples were discarded from the data-
set due to technical failure during measurement. PLS-
DA, a supervised technique, was used to discriminate
between non-infected patients versus patients infected
with P. aeruginosa or chronically colonized patients ver-
sus noncolonized patients. In order to test the perform-
ance of the models, a segmented (4 x 7) cross-validation
was applied. The quality of the model was evaluated by
using the R
2
-value between measured and predicted.
The Variable Identification (VID) coefficients were cal-
culated to identify possible biomarkers. The VID coeffi-
cient was calculated as the correlation coefficient
between each original X-variable and the Y-variable as
predicted by the PLS-DA model [34]. The VID is there-
fore important to understand what the potential rele-
vance of each aroma compound is with respect to the
predictor variable. PCA and PLS-DA analyses were per-
formed using Unscrambler vs 9.8 (CAMO Technologies
Inc., Woodbridge, USA).
Results
Population
During the study period 30 patients were recruited and
sputum was analyzed of 28 patients (male (43%); average
age 29 y ± 12; 11% non-CF bronchiectasis and 89% CF).
Two samples were discarded from the dataset due to
technical failure during measurement. Bacterial culturing
of the 28 patients showed that 14 patients had
P. aeruginosa in their sputa (50%) collected at the time
of the study. Five patients did not grow P. aeruginosa
in sputum culture but were known to be chronically
colonized according to the Leeds criteria [32]. The
remaining nine patients had no history of having P. aer -
uginosa cultured in their sputum. The patient s with
chronic P. aeruginosa colonization had an average IgG
for P. aeruginosa of 40 AU.
All but one patient were taking antibiotics as treat-
ment, either with a single or a combined scheme of
antibiotics (68% on chronic macrolide therapy, 54% on
inhaled tobramycin and/or on inhaled colistimethate;
11% on oral penicillines; 14% on oral quinolones; 7% on
oral cefalosporins, 4% on oral clindamycin and 7% on
oral co-trimoxazoles.) Two of the patients on oral anti-
biotics took their oral antibiotic treatment as mainten-
ance therapy and the other nine received it due to an
exacerbation they had suffered. In addition to P. aerugi-
nosa, bacterial culture isolated Staphylococcus aureus in
36%, Aspergillus fumigatus in 29%, Achromobacter xylo-
soxidans in 11%, Haemophilus influenza in 7% and B.
cepacia complex in 7%.
GC-MS results
Around one hundred aroma compounds were detected
using the deconvolution software AMDIS. This resulted
in 61 VOCs (Table 2) of which the retention indexes
(RI) were also checked.
Multivariate data analysis
PA model
In the PA model, P. aeruginosa positivity wa s based on
sputum culture positivity for P. aeruginosa at study visit,
excluding the patients known to be chronically colonized
from the P. aeruginosa positives. The PA model showed
an explained variance of 95% after 9 PLS-DA Factors
but showed an unstable validation. It also showed less
good prediction for the presence of PA in sputum cul-
ture with high number of false positives and false nega-
tives. Sensitivity was 72%, specificity was 40%, positive
predicted value was 63% and negative predicted value
was 67% (Figure 2).
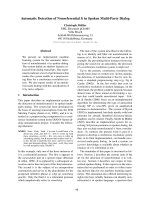
PACC model
Our PACC model included all P. aeruginosa chronically
colonized patients, even if sputum culture at study visit
was negative. The PACC model can explain the
colonization status with P. aeruginosa with an explained
variance of 95% with 4 PLS-DA Factors, and a stable val-
idation. It showed a good prediction of presence with P.
aeruginosa. The PACC model had no false negatives, but
there were three false positive (Figure 3). This means
our PACC model has a sensitivity of 100%, a specificity
of 67%, a positive predictive value of 86% and a negative
predictive value of 100%.
Volatile analysis of the PACC model
Based on the PLS-DA, the Variable Identification (VID)
coefficient s were calculated in order to examine the rela-
tionship between each VOC and the presence of P. aeru-
ginosa. VID coefficients showed a positive and negative
correlation with the presence of certain VOCs, although
most correlation loadings were low (Table 2). This can
also be perceived in the correlation loadings plot s
Goeminne et al. Respiratory Research 2012, 13:87 Page 4 of 9
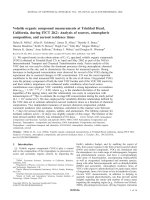
/>(Figure 4). Using two principle compounds , 86% of P.
aeruginosa presence can be explained through the PACC
model. There’s a clear separation between P. aeruginosa
positive and negative patients in the correlation loadings
plot (Figure 4). VOCs analysis shows that the five largest
negative correlations can be seen for the sulphur com-
pounds dimethyl disulfide (VID = −0.46), dimethyl tri-
sulfide (VID = −0.47) and dimethyl tetrasulfide (VID =
−0.43) and two other compounds: hexane (VID = −0.38)
and 2-methyl pentane (VID = −0.59). The five largest
positive correlations were found for the terpenes 1-
undecene (VID = 0.37) and 1-α-pinene (VID = 0.42) and
the compounds dodecane (VID = 0.40), terp inen-4-ol
(VID = 0.40) and 2,2,6-trimethyl-octane (VID = 0.42)
(Table 2).
Exclusion of the non-CF bronchiectatic patients from
the PLS analysis, analyzing only the CF population did
not change the results in terms of positions of the VOCs
and amount of X (=VOCs) and Y (=P. aeruginosa) vari-
ation explained (data not shown).
Discussion
Our study shows that it may be possible to use the pres-
ence of VOCs in sputum to assess the presence of P.
Table 2 Overview of all volatile organic compounds
studied with their respective retention time (RT), Kovats
retention index (RI) and variable identification
coefficients (VID) in the PACC model
Name RT KRI VID
1R-α-pinene 8,872 937,3333 0.42
2,2,6-trimethyl-octane 9,363 963,52 0.42
dodecane 13,29 1200 0.40
terpinen-4-ol 13,03 1183,14 0.40
1-undecene 11,6 1091,77 0.37
3,7-dimethyl-1,6-octadien-3-ol 11,73 1099,704 0.32
2,6,7-trimethyl- decane 11,03 1058,378 0.31
indole 14,69 1296,944 0.31
toluene 5,377 759,4782 0.31
ethanol 1,746 < 600 0.31
3-hydroxy-2-butanone 4,261 697,5298 0.30
acetic acid 2,673 609,3811 0.28
amylene hydrate 3,046 630,086 0.27
caryophyllene 16,55 1438,148 0.26
1-methyl-4-(1-methylethyl)-cyclohexanol 12,95 1178,121 0.26
2,5-dimethyl-2,5-hexanediol 8,466 915,68 0.25
2-nonanone 11,56 1089,816 0.25
acetone 1,859 < 600 0.22
2-ethyl-1-hexanol 10,54 1029,248 0.22
2-heptanone 7,947 889,1041 0.21
2-ethoxy-2-methyl-propane 2,801 616,4863 0.21
phenylethyl alcohol 11,97 1115,187 0.18
1-octen-3-ol 9,66 979,36 0.18
4-methyl octane 7,46 865,5206 0.17
1-butanol, 3-methyl-, acetate 7,686 876,4649 0.15
1-butanol, 3-methyl- 4,796 727,2273 0.14
d-limonene 10,6 1032,445 0.14
Eucalyptol 10,64 1034,991 0.14
6-methyl-2-heptanone 9,192 954,4 0.14
Thymol 14,62 1292,222 0.12
Benzeneacetaldehyde 10,76 1042,214 0.12
2-hexanone 5,859 786,2337 0.11
2,4-dimethyl-1-heptene 7,004 843,4383 0.11
5-methyl-2-(1-methylethyl)-cyclohexanone 12,63 1157,529 0.10
2,4-dimethyl-heptane 6,599 823,8257 0.09
Pyrollidine 3,583 659,8945 0.08
2,3-dimethyl-heptane 7,3 857,7724 0.06
2,6-dimethyl-7-octen-2-ol 11,27 1072,114 0.05
3-methyl-2-pentanone 5,085 743,2695 −0.03
2-undecanone 14,61 1291,597 −0.04
3-octanone 9,737 983,4667 −0.08
methyl isobutyl ketone 4,806 727,7824 −0.08
Table 2 Overview of all volatile organic compounds
studied with their respective retention time (RT), Kovats
retention index (RI) and variable identification
coefficients (VID) in the PACC model (Continued)
phenol 9,733 983,2533 −0.12
3-methyl-3-buten-1-ol 4,686 721,1213 −0.14
2-pentyl-furan 9,89 991,6267 −0.15
3-methyl butanal 3,194 638,3014 −0.16
1-propanol 2,213 < 600 −0.19
3-methyl-, (ethyl ester) butanoic acid 7,213 853,5593 −0.20
octane 6,122 800,7264 −0.22
1-butanol 3,487 654,5656 −0.22
2-butanone 2,492 < 600 −0.23
2-pentanone 3,776 670,6078 −0.24
thiocyanic acid, methyl ester 4,188 693,4777 −0.24
2-methyl-,(ethyl ester) butanoic acid 7,151 850,5569 −0.26
2-methyl butanal 3,355 647,2384 −0.27
ethyl acetate 2,709 611,3794 −0.28
hexane 2,528 601,3322 −0.38
dimethyl tetrasulfide 13,5 1214,583 −0.43
dimethyl disulfide 4,878 731,7791 −0.46
dimethyl trisulfide 9,5 970,8267 −0.47
2-methyl-pentane 2,259 < 600 −0.59
Volatile Organic Compounds (VOCs) were ranked according their VID with
high values indicating a positive correlation with Pseudomonas aeruginosa
infection and negative values indicating a negative correlation; KRI = Kovats
Retention Index.
Goeminne et al. Respiratory Research 2012, 13:87 Page 5 of 9
/>aeruginosa and colonization status with P. aeruginosa.
Analysis showed that not a single but a pattern of VOCs
are linked to the presence of P. aeruginosa. V OCs
that were positively associated with P. aeruginosa
included the terpenes 1-undecene, 1-α-pinene, dode-
cane, terpinen-4-ol and 2,2,6-trimethyl-octane. A more
pronounced negative correlation can be seen for the
sulphur compounds dimethyl disulfide, dimethyl trisul-
fide and dimethyl tetrasulfide with the addition of hex-
ane and 2-methyl-pentane. The results of the PACC
model showed a sensitivity and negative predictive value
of 100%. This suggests that, based on VOCs analysis,
our model is able to predict chronic colonization with
P. aeruginosa. Some of the patients known with chronic
colonization of P. aeruginosa had a negative sputum cul-
ture for P. aeruginosa at study visit. This suggests that
gas chromatography – mass spectrometry may be more
sensitive than bacterial culturing.
Previous studies have shown that several VOCs in
sputa, breath and mucus may indicate the presence of
P. aeruginosa [18,29-31]. Our study results confirm that
most of these VOCs were presen t in sputum from
patients with P. aeruginosa, but none of these VOCs
were highly specific for the presence of P. aeruginosa.
We could not identify one single VOC that was repre-
sentative for the presence of P. aeruginosa presence.
In our study, the presence and absence of a library
of 61 VOCs was identified and found to discriminate
between patients with and without P. ae ruginosa in
sputum. Some of the VOCs we identified in the sputum
headspace samples were the same as those found in
other stud ies. If we compare the result s with the study
of Savelev et al. we can find their suggested markers in
our samples [31]. They looked for specific biomarkers,
showing the highest individual sensitivity for 2-nona-
none. Although our specific aim was to look for a pre-
diction model, rather than searching and evaluating
individual candidate biomarkers, we found a similar
positive correlation with 2-nonanone (VID= 0.25), lim-
onene (VID= 0.14), 2,4-dimethyl-heptene (VID=0.11)
and 3-methyl-1-butanol (VID= 0.14).
A clear distinction needs to be made between VOCs
analysis of bacterial cultures (in vitro studies) and
patient in vivo sample analysis. One typical example is
2-aminoacetophenone. 2-aminoacetophenone is known
for its sweet grape-like odour. On culture plates growing
P. aeruginosa [27,28], its odour increases when adding
tryptophan. This is because 2-aminoacetophenone is
an intermediate in the biosynthetic pathway for quinazo-
lines, a pathway branching from the tryptophan cata-
bolic pathway. Conversely, only one in vivo study could
show it s presence in trace quantities [30]. This indicates
that the VOCs profile produced by P. aeruginosa in vivo
may differ from its in vitro VOCs production and cannot
be extrapolated from in vitro to in vivo analysis pur-
poses, as culture media can have an impact on VOCs.
Moreover, most in vitro studies are explorative studies,
describing the spectrum of VOCs in different bac terial
cultures without assessing them as biomarkers (such as
dimethyl disulfide and dimethyl sulfide), with the excep-
tion of hydrogen cyanide [21,23], 2-propanol [29] and
methyl thiocyanate [20]. Hydrogen cyanide, 2-propanol
and methyl thiocyanate were also found in in vivo sam-
ples (breath). Hydrogen cyanide was not evaluated as
our GC-MS results only allowed reliable evaluation of
VOCs with a molecular weight higher than 30. For 2-
propanol, the isomer 1-propanol could be detected but
Figure 3 PACC model. Y-axis shows prediction of chronic
colonization with P. aeruginosa of our model. X-axis shows chronic
colonization status with P. aeruginosa based on sputum Leeds
criteria. Model predicts with a sensitivity of 100%, specificity of 67%,
positive predicted value of 86% and negative predicted value of
100%. FN = False negatives; FP = False positives; TN = True
negatives; TP = True positives.
Figure 2 PA model. Y-axis shows prediction of P. aeruginosa
presence of our model based on VOC analysis. X-axis shows
presence of P. aeruginosa based on sputum culture. Sensitivity was
72%, Specificity was 40%, positive predicted value was 63% and
negative predicted value was 67%.
Goeminne et al. Respiratory Research 2012, 13:87 Page 6 of 9
/>was also seen in samples without P. aeruginosa. Methyl
thiocyanate (or thiocyanic acid, methyl ester) was not
associated with P. aeruginosa in our samples. Shestivska
et al. could not find methyl thiocyanate in some P. aeru-
ginosa strains. This means that methyl thiocyana te is
strain specific and might explain its absence in our study
population.
The different results on the presence of VOCs shown
in some previous studies ( Table 1) raises the question if
not a single VOC is indicative of P. aeruginosa presence
but rather a pattern of VOCs, as suggested by our
results. However we did not analyze VOCs with a mo-
lecular weight lower than 30. Recently, strong evidence
showed that hydrogen cyanide could be used as a bio-
marker, showing significant higher in vivo concentra-
tions in most strains of P. aeruginosa [18]. This
biomarker could then be used in the detection of P. aer-
uginosa in breath, whether or not in combination with
CH
3
SCN (methyl thiocyanate) as possible biomarker
[20]. Further research is warranted to identify a single
biomarker or a pattern of VOCs (“a breathogram”). This
would mean the addition of a new tool for the diagnosis
of (chronic) P. aeruginosa infection and the monitoring
of response to treatment (eg eradication therapy) [35].
The use of novel devices using the breath end portion
of a normal spirometry measurement to perform a chro-
matographic preseparation, followed by an ion mobility
spectrome try (IMS) or devices allowing fast analysis of
breath using a selected ion flow tube mass spectrometry
(SIFT-MS) make it fast and feasible to do VOCs analysis
[36,37]. SIFT-MS has the advantage of being fast and
having high sensitivity. It can also determine the end-
tidal breath phase by quantification of water vapour in
breath samples while the soft ionization technique
allows easy analysis of high moisture samples such as
breath. IMS has the disadvantage of not knowing what
chemical compound is seen unless a large database with
standards is available, but it has been proven that IMS is
also fast and can show a fingerprint, characteristic for an
infection [38].
A limitation of our study might be the impact other
variables have on VOCs such as antibiotic therapy and
other bacteria. Bacterial culture results from all our
patients showed a great diversity and variability without
a distinct pattern of bacterial co-existence between
patients. More importantly, our statistical design, using
PLS-DS, minimizes the impact of variables such as anti-
biotic therapy and other bacteria. PLS-DS re veals the
relation of the samples to a given parameter, particularly
P. aeruginosa.
Our findings of terpenes and terpenoids in sputum
headspace are interesting as they are common constitu-
ents of food. Alpha-pinene for example is detected in
fruits and pepper. Although we asked the patients to
produce their sputa after rinsing their mouth and before
breakfast, we cannot reliably say this was done by the
patient. However, if the detected VOCs would indeed be
related to food, this would mean that all patients with
Figure 4 Biplot using the first two PLS-DA factors. The plot shows a good separation of P. aeruginosa positive chronic colonized patients
(triangles and squares) and P. aeruginosa negative patients (circles). Significant correlation of volatiles is suggested when volatiles project between
r=0.75 (inner circle) and r=1 (outer circle). The vector shows the direction where volatiles are positively correlated with chronic P. aeruginosa.
The pattern of volatiles could explain P. aeruginosa infection in 86% using the first two PLS-DA factors (62% and 24%). X and Y axis both show
partial least square regression r. Each PLS factor explains 10% and 6% of the X-variation respectively. The light gray symbols visualize the volatile
organic compounds, sorted by structure. Squares: Chronic colonization and positive sputum cultures for P. aeruginosa at the time of study.
Triangles: Chronic colonization but negative sputum culture for P. aeruginosa at the time of study. Circles: Negative for P. aeruginosa.
Goeminne et al. Respiratory Research 2012, 13:87 Page 7 of 9
/>P. aerug inosa had the same food VOCS constituents in
their breath.
Quantification of the VOCs was also not performed.
To perform quantification for comple x matrices, the use
of internal standards or standard additions is recom-
mended. Using only a few internal standards, represent-
ing the main chemical classes and extrapolating the
results to all volatiles in the sample, can cause serious
errors. Ideally SPME quantification would require us to
focus on a few volatiles (which was not our aim) and use
isotopically labeled analogues as standards. Although we
did not quantify, all samples were processed and ana-
lyzed in a same manner, reducing the variability due to
the methods. This results in a variability mainly due to
the sample itself.
Another important issue that should be taken into
consideration is that sputum might be contaminated by
saliva, influencing the results of the VOC analysis. This
has been proven for breath analysis, where important
contamination of alveolar breath exhaled via the mouth
can occur [39]. Wang et al. showed that both mouth-
and nose-exhaled breath analyses are needed to identify
the major source of a certain VOC. We tried to
minimize the effect of saliva contamination by asking
the patient to rinse their mouth prio r to sputum produc-
tion. Nonetheless , finding a biomarker for P. aeruginosa
in mouth VOCs would still be interesting as current lit-
erature suggests that a migration from P. aeruginosa
is seen from the upper to the lower airways prior to
colonization [40].
Conclusion
We showed that building a model for the prediction of
P. aeruginosa presence is possible and might even iden-
tify known chronic colonized patients as P. aeruginosa
where sputum culture cannot show its presence. Ba sed
on literature overview and our results, we believe that
not the presence of a single VOC is indicative of P. aeru-
ginosa presence but rather a pattern of VOCs. Follow-up
of patien ts, producing a “breathogram” might be a
promising future perspective, but needs further research,
using new devices such as spirometry combined with
chromatographic preseparation and subsequent ion
mobility spectrometry.
Abbreviations
CF: Cystic fibrosis; FEV
1
: Forced expiratory volume in one second; GC-MS: Gas
chromatography – mass spectrometry; IMS: Ion mobility spectrometry; P.
aeruginosa: Pseudomonas aeruginosa; PACC: Pseudomonas aeruginosa chronic
colonization; PCA: Principal component analysis; PLS-DA: Partial least square
discriminant analysis; RI: Retention index; RT: Retention time; SIFT-
MS: Selected ion flow tube mass spectrometry; SPME: Solid phase micro
extraction; VID: Variable identification; VOCs: Volatile organic compounds.
Competing interest
None of the authors has a financial relationship with a commercial entity
that has an interest in the subject of the presented manuscript.
Authors’ contribution
PG performed the acquisition and analysis of the data, designed the study
and wrote the manuscript. TV aided in the data acquisition and data
processing, performed part of the analysis and reviewed the article. JVE was
involved in the design of the study and reviewed the article. MH contributed
importantly to the interpretation of the data and critically revised the
manuscript. BN was involved in the design of the study and critical revision
of the manuscript. LD was involved in the design and critical revision prior
to submission. All authors read and approved the final manuscript.
Acknowledgements
We would like to thank Elfie Dekempeneer for her advice and help during
the measurements of the samples. We also thank Rita Merckx for her help
and advice concerning bacterial culturing and we thank Stijn Willems for his
critical review of the manuscript.
Author details
1
Department of Lung Disease, UZ Leuven, Leuven, Belgium.
2
Biosyst-MeBios,
University of Leuven, Leuven, Belgium.
3
Department of Microbiology, UZ
Leuven, Leuven, Belgium.
4
Pulmonary Medicine, University Hospital
Gasthuisberg, Herestraat 49, Leuven B-3000, Belgium.
Received: 18 July 2012 Accepted: 27 September 2012
Published: 2 October 2012
Reference
1. Konstan MW, Morgan WJ, Butler SM, Pasta DJ, Craib ML, Silva SJ, Stokes DC,
Wohl ME, Wagener JS, Regelmann WE, Johnson CA: Scientific advisory
group and the investigators and coordinators of the epidemiologic
study of cystic fibrosis. Risk factors for rate of decline in forced
expiratory volume in one second in children and adolescents with cystic
fibrosis. J Pediatr 2007, 151:134–139.
2. McPhail GL, Acton JD, Fenchel MC, Amin RS, Seid M: Improvements in lung
function outcomes in children with cystic fibrosis are associated with
better nutrition, fewer chronic pseudomonas aeruginosa infections, and
dornase alfa use. J Pediatr 2008, 153:752–757.
3. Kerem E, Corey M, Gold R, Levison H: Pulmonary function and clinical
course in patients with cystic fibrosis after pulmonary colonization with
Pseudomonas aeruginosa. J Pediatr 1990, 116:714–719.
4. Emerson J, Rosenfeld M, McNamara S, Ramsey B, Gibson RL: Pseudomonas
aeruginosa and other predictors of mortality and morbidity in young
children with cystic fibrosis. Pediatr Pulmonol 2002, 34:91–100.
5. Kozlowska WJ, Bush A, Wade A, Aurora P, Carr SB, Castle RA, Hoo AF, Lum S,
Price J, Ranganathan S, Saunders C, Stanojevic S, Stroobant J, Wallis C,
Stocks J: London cystic fibrosis collaboration. Lung function from infancy
to the preschool years after clinical diagnosis of cystic fibrosis. Am J
Respir Crit Care Med 2008, 178:42–49.
6. Pamukcu A, Bush A, Buchdahl R: Effects of pseudomonas aeruginosa
colonization on lung function and anthropometric variables in children
with cystic fibrosis. Pediatr Pulmonol 1995, 19:10–15.
7. Kosorok MR, Zeng L, West SE, Rock MJ, Splaingard ML, Laxova A, Green CG,
Collins J, Farrell PM: Acceleration of lung disease in children with cystic
fibrosis after pseudomonas aeruginosa acquisition. Pediatr Pulmonol 2001,
32:277–287.
8. Henry RL, Mellis CM, Petrovic L: Mucoid pseudomonas aeruginosa is
a marker of poor survival in cystic fibrosis. Pediatr Pulmonol 1992,
12:158–161.
9. Courtney JM, Bradley J, Mccaughan J, O’Connor TM, Shortt C, Bredin CP,
Bradbury I, Elborn JS: Predictors of mortality in adults with cystic fibrosis.
Pediatr Pulmonol 2007, 42:525–532.
10. Burns JL, Gibson RL, McNamara S, Yim D, Emerson J, Rosenfeld M, Hiatt P,
McCoy K, Castile R, Smith AL, Ramsey BW: Longitudinal assessment of
pseudomonas aeruginosa in young children with cystic fibrosis. J Infect
Dis 2001, 183:444–
452.
11. Hansen CR, Pressler T, Hoiby N: Early aggressive eradication therapy for
intermittent pseudomonas aeruginosa airway colonization in cystic
fibrosis patients: 15 years experience. J Cyst Fibros 2008, 7:523–530.
12. Armstrong DS, Grimwood K, Carlin JB, Carzino R, Olinsky A, Phelan PD:
Bronchoalveolar lavage or oropharyngeal cultures to identify lower
respiratory pathogens in infants with cystic fibrosis. Pediatr Pulmonol
1996, 21:267–275.
Goeminne et al. Respiratory Research 2012, 13:87 Page 8 of 9
/>13. Endeman H, Schelfhout V, Voorn GP, van Velzen-Blad H, Grutters JC,
Biesma DH: Clinical features predicting failure of pathogen identification
in patients with community acquired pneumonia. Scand J Infect Dis 2008,
40:715–720.
14. Terpstra WJ, Schoone GJ, Ter SJ, van Nierop JC, Griffioen RW: In situ
hybridization for the detection of haemophilus in sputum of patients
with cystic fibrosis. Scand J Infect Dis 1987, 19:641–646.
15. Verenkar MP, Pinto MJ, Savio R, Virginkar N, Singh I: Bacterial pneumonias–
evaluation of various sputum culture methods. J Postgrad Med 1993,
39:60–62.
16. Pressler T, Bohmova C, Conway S, Dumcius S, Hjelte L, Høiby N, Kollberg H,
Tümmler B, Vavrova V: Chronic pseudomonas aeruginosa infection
definition: EuroCareCF working group report. J Cyst Fibros 2011,
10:S75–S78.
17. Pasteur MC, Bilton D, Hill AT: British Thoracic Society guideline for non-CF
bronchiectasis. Thorax 2010, 65:i1–i58.
18. Enderby B, Smith D, Carroll W, Lenney W: Hydrogen cyanide as a
biomarker for Pseudomonas aeruginosa in the breath of children with
cystic fibrosis. Pediatr Pulmonol 2009, 44:142–147.
19. Robroeks CM, van Berkel JJ, Dallinga JW, Jöbsis Q, Zimmerman LJ,
Hendriks HJ, Wouters MF, van der Grinten CP, van de Kant KD, van
Schooten FJ, Dompeling E: Metabolomics of volatile organic compounds
in cystic fibrosis patients and controls. Pediatr Res 2010, 68:75–80.
20. Shestivska V, Nemec A, Dřevínek P, Sovová K, Dryahina K, SpanělP:
Quantification of methyl thiocyanate in the headspace of pseudomonas
aeruginosa cultures and in the breath of cystic fibrosis patients by
selected ion flow tube mass spectrometry. Rapid Commun Mass Spectrom
2011, 25:2459 –2467.
21. Allardyce RA, Langford VS, Hill AL, Murdoch DR: Detection of volatile
metabolites produced by bacterial growth in blood culture media by
selected ion flow tube mass spectrometry (SIFT-MS). J Microbiol Methods
2006, 65:361–365.
22. Carroll W, Lenney W, Wang T, Spanel P, Alcock A, Smith D: Detection of
volatile compounds emitted by pseudomonas aeruginosa using selected
ion flow tube mass spectrometry. Pediatr Pulmonol 2005, 39:452–
456.
23. Gilchrist FJ, Alcock A, Belcher J, Brady M, Jones A, Smith D, SpanělP,
Webb K, Lenney W: Variation in hydrogen cyanide production between
different strains of pseudomonas aeruginosa. Eur Respir J 2011,
38:409–414.
24. Thorn RM, Reynolds DM, Greenman J: Multivariate analysis of bacterial
volatile compound profiles for discrimination between selected species
and strains in vitro. J Microbiol Methods 2011, 84:258–264.
25. Zhu J, Bean HD, Kuo YM, Hill JE: Fast detection of volatile organic
compounds from bacterial cultures by secondary electrospray
ionization-mass spectrometry. J Clin Microbiol 2010, 48:4426–4431.
26. Zechman JM, Labows JN Jr: Volatiles of Pseudomonas aeruginosa and
related species by automated headspace concentration–gas
chromatography. Can J Microbiol 1985, 31:232–237.
27. Cox CD, Parker J: Use of 2-aminoacetophenone production in
identification of pseudomonas aeruginosa. J Clin Microbiol 1979,
9:479–484.
28. Labows JN, McGinley KJ, Webster GF, Leyden JJ: Headspace analysis of
volatile metabolites of pseudomonas aeruginosa and related species
by gas chromatography–mass spectrometry. J Clin Microbiol 1980,
12:521–526.
29. Wang T, Carroll W, Lenny W, Boit P, Smith D: The analysis of 1-propanol
and 2-propanol in humid air samples using selected ion flow tube mass
spectrometry. Rapid Commun Mass Spectrom 2006, 20:125–130.
30. Preti G, Thaler E, Hanson CW, Troy M, Eades J, Gelperin A: Volatile
compounds characteristic of sinus-related bacteria and infected sinus
mucus: analysis by solid-phase microextraction and gas
chromatography–mass spectrometry. J Chromatogr B Analyt Technol
Biomed Life Sci 2009, 877:2011–2018.
31. Savelev SU, Perry JD, Bourke SJ, Jary H, Taylor R, Fisher AJ, Corris PA,
Petrie M, De Soyza A: Volatile biomarkers of pseudomonas aeruginosa in
cystic fibrosis and noncystic fibrosis bronchiectasis. Lett Appl Microbiol
2011, 52:610–613.
32. Lee TW, Brownlee KG, Conway SP, Denton M, Littlewood JM: Evaluation of
a new definition for chronic pseudomonas aeruginosa infection in cystic
fibrosis patients. J Cyst Fibros
2003, 2:29–34.
33. Vandendool H, Kratz PD: A generalization of the retention index system
including linear temperature programmed gas-liquide partition
chromatography. J Chromatogr 1963, 11:463–471.
34. Ooms K: Identification of potentially causal regressors in PLS models.
Dissertation: International Study Program in Statistics. KUL; 1996.
35. Horvath I, Hunt J, Barnes PJ, et al: Exhaled breath condensate:
methodological recommendations and unresolved questions. Eur Respir J
2005, 26:523–548.
36. Westhoff M, Litterst P, Freitag L, Urfer W, Bader S, Baumbach JI: Ion mobility
spectrometry for the detection of volatile organic compounds in
exhaled breath of patients with lung cancer: results of a pilot study.
Thorax 2009, 64:744–748.
37. Buszewski B, Kesy M, Ligor T, Amann A: Human exhaled air analytics:
biomarkers of disease. Biomed Chromatogr 2007, 21:553–566.
38. Vandendriessche T, Keulemans J, Geeraerd A, Nicolai BM, Hertog MLATM:
Evaluation of fast volatile analysis for detection of botrytis cinerea
infections in strawberry. Food Microbiol 2012, 32:406–14.
39. Wang T, Pysanenko A, Dryahina K, Spaněl P, Smith D: Analysis of breath,
exhaled via the mouth and nose, and the air in the oral cavity. J Breath
Res 2008, 2:037013.
40. Hansen SK, Rau MH, Johansen HK, Ciofu O, Jelsbak L, Yang L, Folkesson A,
Jarmer H, Aanæs K, von Buchwald C, Høiby N, Molin S: Evolution and
diversification of pseudomonas aeruginosa in the paranasal sinuses of
cystic fibrosis children have implications for chronic lung infection. ISME
J 2012, 6:31–45.
doi:10.1186/1465-9921-13-87
Cite this article as: Goeminne et al.: Detection of Pseudomonas
aeruginosa in sputum headspace through volatile organic
compound analysis. Respiratory Research 2012 13:87.
Submit your next manuscript to BioMed Central
and take full advantage of:
• Convenient online submission
• Thorough peer review
• No space constraints or color figure charges
• Immediate publication on acceptance
• Inclusion in PubMed, CAS, Scopus and Google Scholar
• Research which is freely available for redistribution
Submit your manuscript at
www.biomedcentral.com/submit
Goeminne et al. Respiratory Research 2012, 13:87 Page 9 of 9
/>