Visualization of Host Behavior for Network Security pdf
Bạn đang xem bản rút gọn của tài liệu. Xem và tải ngay bản đầy đủ của tài liệu tại đây (975.02 KB, 16 trang )
Visualization of Host Behavior for Network
Security
Florian Mansmann, Lorenz Meier, and Daniel A. Keim
Abstract Monitoring host behavior in a network is one of the most essential tasks in
the fields of network monitoring and security since more and more malicious code
in the wild internet constantly threatens the network infrastructure. In this paper,
we present a visual analytics tool that visualizes network host behavior through
positional changes in a two dimensional space using a force-directed graph layout
algorithm.
The tool’s interaction capabilities allow for visual exploration of network traffic
over time and are demonstrated using netflow data as well as IDS alerts. Automatic
accentuation of hosts with highly variable traffic results in fast hypothesis generation
and confirmation of suspicious host behavior. By triggering the behavior graph from
the HNMap tool, we were able to monitor more abstract network entities.
1 Introduction
Today, a lot of research deals with an increasing amount of data being digitally col-
lected in the hope of revealing valuable information that can eventually bring about
a competitive advantage. Visual data exploration, which can be seen as a hypoth-
esis generation process, is especially valuable, because (a) it can deal with highly
non-homogeneous and noisy data, and (b) is intuitive and requires no understanding
of complex mathematical methods [Keim and Ward, 2002]. Visualization can thus
provide a qualitative overview of the data, allowing data phenomena to be isolated
for further quantitative analysis.
The emergence of visual analytics research suggests that more and more visu-
alization research is closely linked with automatic analysis methods. Its goal is
to turn information overload into the opportunity of the decade [Thomas, 2005,
Florian Mansmann, Lorenz Meier, and Daniel A. Keim
University of Konstanz (Germany)
e-mail: {mansmann,meier,keim}@inf.uni-konstanz.de
1
2 Florian Mansmann, Lorenz Meier, and Daniel A. Keim
Thomas and Cook, 2005]. Decision-makers should be enabled to examine this mas-
sive, multi-dimensional, multi-source, time-varying information stream to make ef-
fective decisions in time-critical situations. For informed decisions, it is indispens-
able to include humans in the data analysis process to combine flexibility, creativity,
and background knowledge with the enormous storage capacity and computational
power of today’s computers. The specific advantage of visual analytics is that deci-
sion makers may focus their full cognitive and perceptual capabilities on the analyt-
ical process, while allowing them to apply advanced computational capabilities to
augment the discovery process.
Our objective is to show how visual analysis can foster better insight in the large
data sets describing IP network activity. A non-trivial task of detecting different
kinds of system vulnerabilities can be successfully solved by applying the visual
analytics approach. Whenever machine learning algorithms become insufficient for
recognizing malicious patterns, advanced visualization and interaction techniques
encourage expert users to explore the relevant data and take advantage of human
perception, intuition, and background knowledge. In the process of human involve-
ment acquired knowledge can be further used for advancing automatic detection
mechanisms.
This paper focuses on tracking of behavioral changes in traffic of hosts as one of
the most essential tasks in the domains of network monitoring and network security.
We propose a new visualization metaphor for monitoring time-referenced host be-
havior. Our method is based on a force-directed layout approach which allows for a
multi-dimensional representation of several hosts in the same view. This new visu-
alization metaphor emphasizes changes in the traffic data over time and is therefore
well suited for detecting uncommon system behavior. We use the visual variable
position to give an indication about traffic proportions of hosts at a particular mo-
ment in time: High traffic proportions of a particular protocol attract the observation
nodes resulting in clusters of similar host states. So-called traces then connect the
snapshots of hosts (one snapshot for every time interval) in chronological order re-
sulting in one chain per host.
Various interaction capabilities allow for fine-tuning the layout, highlighting of
hosts of interest, and retrieval of traffic details. As a contribution to visual analytics,
we implemented an automatic highlighting of hosts with high variations in the used
application protocols of network traffic in order to guide the interactive exploration
process.
The rest of the paper is structured as follows: Section 2 discusses related work in
the field of visualization for network monitoring and security with a focus on tools
analyzing application ports, graph-based approaches, and visual analytics applica-
tions. The next section details our system and the graph-based layout, including a
description of the available user interactions. Since the tool lends itself to be applied
to more abstract information, we then show how it can be integrated in our previ-
ously propsed HNMap tool to monitor network behavior of prefixes, autonomous
systems, countries, or continents. To demonstrate and evaluate the usefulness of the
behavior graph, we conduct a small case study and present means for automatic
Visualization of Host Behavior for Network Security 3
highlighting of high variance hosts. After presenting some ideas about further de-
velopments of our tool (section 4), the last section sums up our contributions.
2 Related Work
Ultimately, all previously proposed methods support the administrators in their task
to gain insight into the causes of unusual traffic, malfunctions, or threat situations.
Besides automatic analysis means, network operators often relied on simple statisti-
cal graphics like scatter plots, pair plots, parallel coordinates, and color histograms
to analyze their data [Marchette, 2001]. However, to generate meaningful graphics,
the netflow data and the countless alerts generated by IDSes need to be intelligently
pre-processed, filtered, and transformed since their sheer amount causes scalability
issues in both manual and visual analysis. Since traditional statistical graphics are
familiar to analysts, their design often forms the basic metaphor of newly proposed
visualization systems. Therefore, additional interaction features enhance the user’s
capabilities to discover novel attacks and to quickly analyze threat situations under
enormous time pressure.
One such visualization systems is IDS Rainstorm, which bridges the gap between
large data sets and human perception [Abdullah et al., 2005]. A scatterplot-like vi-
sualization of local IP addresses versus time is provided to analyze the thousands of
security events generated daily by the IDS. After zooming into regions of interest,
lines appear and link the pictured incidents to other characteristics of the data set.
A demonstrative example of work in the field is the situational awareness is
VisAlert [Livnat et al., 2005] which is built upon the w
3
premise, assuming that ev-
ery incident has at least the three attributes what, when, and where. In the VisAlert
display, the location attribute is placed on a map, the time attribute indicated on con-
centric circles around this map, and the classification of the incident is mapped to
the angle around the circle. For each incident, the attributes are linked through lines.
This linking in detail views is also utilized in other applications like TNV
[Goodall et al., 2006]. The main matrix links local hosts, which are colored ac-
cording to their activity level, to external hosts through straight and curved lines.
In addition to that, the system includes a time histogram, a bifocal lens to enlarge
the focus area, colored arrowheads to show traffic direction and protocols, parallel
coordinates linking source and destination port, and details on demand interaction
techniques. While this open source tool is excellent for monitoring a small local net-
work, its limit to display approximately 100 hosts at a time might cause scalability
issues when monitoring medium or large size networks.
As already mentioned, parallel coordinates have become a popular analysis tech-
nique when dealing with network data. VisFlowConnect uses the parallel axis view
to display netflow records as in- and outgoing links between two machines or do-
mains [Yin et al., 2004]. This techniques allows the analyst to discover a variety of
interesting network traffic patterns, such as virus outbreaks, denial of service at-
tacks, or network traffic of grid computing applications.
4 Florian Mansmann, Lorenz Meier, and Daniel A. Keim
It is worth mentioning that visualization techniques like parallel coordinates and
graphs have meanwhile found their way into commercial products, such as the RNA
Visualization Module of SourceFire [Sourcefire, 2005]. However, major drawbacks
of parallel coordinates’ are that they introduce visual clutter due to overplotting of
lines and that only correlations between neighboring axes can be identified.
2.1 Analysis of application ports
An important subarea is visualization of application port activity as an indication to
the running network applications. [Lau, 2004], for example, presented the Spinning
Cube of Potential Doom, a 3D scatterplot with the dimensions local IP address, port
number, and global IP address. The cube is capable of showing network scans due
to emerging patterns. However, 3D scatterplots may be difficult to interpret on a 2D
screen due to overlay problems.
Another port analysis tool is PortVis described by [McPherson et al., 2004]. It
implements scatterplots (e.g., port/time or source/port) with zooming capabilities,
port activity charts, and various means of interaction to visualize and detect port
scans as well as suspicious behavior on certain ports.
For a more detailed analysis, [Fink et al., 2005] proposed a system called Por-
tall to allow end-to-end visualization to view communications between distributed
processes across the network. This system enables the administrator to correlate
network traffic with the running processes on his monitored machines.
2.2 Graph-based approaches for network monitoring
In network monitoring and security, graph-based approaches have been intensively
used. In most cases, however, their use is limited to expressing communication be-
tween hosts or higher-level elements of the network infrastructure among each other
along with information about traffic intensity.
Early internet mapping projects put their focus on geographic visualization where
each network node had a clearly defined geographic position on a map. The same
principle was applied in a study to map the multicast backbone of the internet
[Munzner et al., 1996]. Since the global network topology was shown, the authors
used a 3D representation of the world and drew curved edges on top. Other research
focused on visual scalability issues in 2D representations ranging from matrix rep-
resentation to embeddings of the network topology [Eick, 2005] in a plane.
Measuring the quality of network connections in the internet through metrics
results in huge data sets. Visualizing this information in graphs becomes both chal-
lenging in terms of the layout calculation as well as in terms of visibility of nodes
and links of such a graph. [Cheswick et al., 2000], for example, mapped about
88,000 networks as nodes having more than 100,000 connecting edges. Another
Visualization of Host Behavior for Network Security 5
related study implements a hybrid approach by using longitudinal and hierarchical
BGP information for their graph layout [Claffy, 2001].
For further reading, we recommend Chaomei Chen’s book “Information Visual-
ization – Beyond the Horizon” [Chen, 2004] since it contains a nice overview of the
history of internet cartography.
2.3 Towards visual analytics for network security
One of the key challenges of visual analytics is to deal with the vast amount of
data from heterogeneous data sources, such as the countless number of events and
traffic collected in log files originating from traffic sensors, firewalls, and intrusion
detection systems. Like demonstrated in [Lee et al., 2005], consolidation and analy-
sis of these heterogeneous data can be vital to properly monitor systems in real-time
threat situations. Because gaining insight into complex statistical models and ana-
lytical scenarios is a challenge for both statistical and networking experts, the need
for visual analytics as a means to combine automatic and visual analysis methods
steadily grows along with increasing network traffic and escalating alerts.
[Muelder et al., 2005], for example, proposed a tool to automatically classify net-
work scans according to their characteristics, ultimately leading to a better distinc-
tion between friendly scans (e.g., search engine webcrawlers) and hostile scans.
Wavelet scalograms are used to abstract the scan information on several levels to
make scans comparable. These wavelets are then clustered and visualized as graphs
to provide an intuition about the clustering result.
[Xiao et al., 2006] start their analysis in the opposite direction. First, network
traffic is visualized as scatterplots, Gantt charts, or parallel plots and then the user
interactively specifies a pattern, which is abstracted and stored using a declarative
knowledge representation. A related system is NVisionIP [Lakkaraju et al., 2005],
which employs visually specified rules and comes with the capability to store them
for reusage in a modified form of the tcpdump filter language. The visual analytics
feedback loop implemented in both approaches allows the analyst to build upon pre-
vious discoveries in order to explore and analyze more complex and subtle patterns.
2.4 Summary
While graphs have previously been used to convey connectivity among network
hosts, the novelty of our approach lies in its objective to convey the type of traffic
through node position. We then connect all snapshots of one single host in chrono-
logical order through traces. In the this paper we employ an adapted force-directed
graph layout to better use the available screen space. At the same time, user interac-
tion and automatic highlighting of suspicious hosts facilitate hypothesis generation
and verification through exploration of their behavior in our visual analytics tool.
6 Florian Mansmann, Lorenz Meier, and Daniel A. Keim
3 Technical approach
The goal of our visualization is to effectively discover anomalies in the behavior of
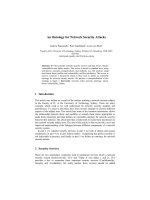
hosts or higher level network entities by comparing their states over time. Figure 1
shows the states of host A and host B at the time intervals 1 to 6 by calculating the
normalized traffic proportions for each type of traffic within the interval. Although
the figure shows all the relevant information, its scalability is limited since perceiv-
ing this detailed information for many hosts and time intervals makes it difficult to
keep an overview.
1 2 3 4 5 6
host A
0.0 0.2 0.4 0.6 0.8 1.0
1 2 3 4 5 6
host B
0.0 0.2 0.4 0.6 0.8 1.0
4
SSH
FTP
DNS
HTTP
Undefined
IMAP
SMTP
host B
−1.0 −0.5 0.0 0.5 1.0
Fig. 1 The normalized traffic measurements define the states of each network entity (host A or
host B) for the intervals 1 to 6. We interpret these states as points in a high-dimensional space (one
dimension per traffic type).
We therefore represent every network entity in a two-dimensional map through
several connected points, which all together compose the entity’s trace. Both color
and shape are used to make the entities distinguishable among each other. Each
node represents the state of one network entity for a specific interval and its position
is calculated through the entity’s state at that interval. We basically map a high-
dimensional space onto a distorted two dimensional space. If the nodes for one
entity are now not in the same place, the entity’s state has changed over time.
This leads to some nice effects which help to visually filter the image. Entities
that do not change form small clusters or might even be only visible as a single point,
whereas entities that have changed reveal visible trails, either locally or throughout
the view. These long lines eventually catch the user’s attention.
To be able to visualize more than two dimensions in a two dimensional plot, we
use an force-directed layout approach to approximate distance relationships from
high-dimensional space into 2D. Every data dimension is represented by a dimen-
sion node. In a first step, the layout of these nodes is calculated. Although arbitrary
layouts are possible to place these dimension nodes, the current implementation
uses a circular force-directed layout to distribute the nodes on the available space.
This chosen layout now defines the distortion of the projected space. After fixing the
positions of the dimension nodes, the observation nodes are placed in the plane and
Visualization of Host Behavior for Network Security 7
1
2
3
4
5
6
SSH
FTP
DNS
HTTP Undefined
IMAP
SMTP
observation nodes
dimension nodes
traces
attraction forces
1
2
3
5
6
host A
host B
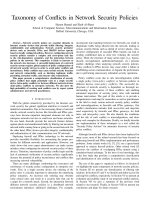
Fig. 2 Sketch showing the coordinate calculation of the host position at a particular point of time.
The final graph layout is calculated using a force-based method considering all attraction and
repulsion forces.
connected to their corresponding dimension nodes via virtual springs. All observa-
tion nodes of the same entity are also tied together with virtual springs. The forces
are calculated in an iterative fashion until an equilibrium is approximated. Figure
2 sketches the layout calculation exemplarily for the two hosts from the previous
figure. The analyst can now trace the state changes for all intervals of the host.
Fine-tuning the graph layout with respect to trace visibility is done by attaching
additional attraction forces to the trace edges, which are then taken into consider-
ation during layout calculation. To visually highlight the time-dependency of the
object nodes, we mapped the alpha value of the connecting traces to time. Older
traces fade out while newer ones are clearly visible.
For many analysis scenarios, not only traffic proportions but also absolute traffic
measures play an important role. In other words, the graph layout will assign almost
the same position to two nodes with each having 50 % IMAP and SMTP traffic, no
matter that the first one has transferred several megabytes whereas the second one
only a few bytes. We thus varied node size according to the absolute value of the
traffic measure (normally the sum of the transferred bytes) using logarithmic scaling
due to large variations in traffic measurements.
8 Florian Mansmann, Lorenz Meier, and Daniel A. Keim
3.1 Layout details
The weights of the attraction edges of each observation node represent the propor-
tions of the employed application protocols within the network traffic of a particular
time interval. The first node of host B in figure 2, for example, is only connected
to the SMTP attraction node. Since node positions are calculated step-wise using a
spring-embedder graph layout and since all attraction nodes push each other away
due to additional repulsion forces, a consistent graph layout is generated where each
nodes has a unique position. We used the [Fruchterman and Reingold, 1991] spring
embedder algorithm to calculate the forces between the nodes. The calculation of
the attracting forces follows the idea of a physical model of atomic particles, ex-
erting attractive and repulsive forces, depending on the distance. While every node
repels other nodes, only nodes that are connected by an edge attract each other.
It is important to note that the forces calculated by this algorithm result in speed,
not acceleration as in physical systems. The reason is that the algorithm seeks for
a static, not a dynamic equilibrium. There are several other algorithms that could
solve our layout problem, like the force directed algorithm from [Eades, 1984],
the variant of [Kamada and Kawai, 1989], and the simulated annealing approach
of [Davidson and Harel, 1996]. The reason for choosing the Fruchterman-Reingold
algorithm is its efficiency, speed and robustness concerning the force and iteration
parameters. As weighted edges were needed we extended the Fruchterman-Reingold
implementation of the JUNG [O’Madadhain et al., 2007] graph drawing library to
support additional factors on the forces.
3.2 Implementation
To build a flexible and fast analysis system, we relied on the database technology
provided by a PostgreSQL database [PostgreSQL Global Development Group, 2007].
Data loading scripts extract the involved IP addresses along with port numbers,
the transferred bytes, and a timestamp from tcpdump files, and store them in the
database. To speed up query time, traffic with identical IPs and ports can be ag-
gregated in 10 min intervals in a new database table. The actual behavior graph
application is implemented in Java.
3.3 User interaction
Since node positions depend on the traffic occurring in the respective time interval
and the pushing forces of nearby nodes, only an approximation of the actual load
situation is given. Furthermore, due to the multi-dimensional nature of the data at
hand, estimating traffic proportions from node positions becomes difficult or even
impossible due to ambiguity (e.g., figure 2 shows that host A and host B have almost
Visualization of Host Behavior for Network Security 9
the same position in the 6th interval). This might happen because there exist several
sets of traffic loads that are mapped to the same 2D location. We resolve this am-
biguity through user interaction: by moving the mouse over a node a detail view is
triggered (see figure 3). Alternatively, the so-called dimension nodes can be moved
using drag & drop to estimate their influence on a particular node or a whole group
of nodes. A simple click on a dimension node results in highlighting all observation
nodes containing the respective traffic. This highlighting is realized by coloring all
normal nodes in grayscale while showing the highlighted nodes in color. Using the
configuration panel, further dimension nodes and observation node groups can be
added to or removed from the visualization.
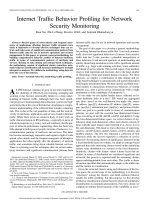
Fig. 3 Host behavior graph showing the behavior of 33 prefixes over a timespan of 1 hour. Interac-
tion is used as a means to retrieve traffic details for a particular node (bar chart in the middle). The
user has selected three prefixes to trace their behavior. The configuration panel on the right allows
for fine-tuning the graph.
Because we carefully designed our application for a multitude of analysis sce-
narios, the user can flexibly choose the attributes representing attraction nodes and
observation node groups depending on the available data in the considered data set.
To abstract from the technical details, he can simply select from the available data
attributes in the two drop-down menus shown in figure 3.
In addition to this, the configuration panel has four sliders: (a) The movement ac-
centuation slider highlights suspicious hosts with highly variant traffic. Further de-
tails about this are given in section 3.5.2. (b) The second slider controls the number
of observation nodes by increasing or decreasing the time-intervals for aggregating
traffic. Changing the granularity of time intervals is a powerful means to remove
10 Florian Mansmann, Lorenz Meier, and Daniel A. Keim
clutter (less nodes due to larger time intervals) or to show more details (more nodes)
to understand traffic situations. (c) Since each distinct node represents the state of
a particular host during a time interval, we use edges to enable the user to trace a
node’s behavior over time. However, following these edges can become a challenge
since nodes can end up in widely varying places. In order to make these observation
node groups more compact, additional attraction forces can be defined on neighbor-
ing nodes of a chain. The strength of these host cohesion forces can be fine-tuned
with the third slider. Figure 4 demonstrates the effect of changing the forces. (d)
Last, but not least, the attraction forces between observation and dimension nodes
play an important role to ensure interpretability of the graph. Too strong attraction
forces result in dense clusters around the dimension nodes, whereas too weak attrac-
tion forces result in ambiguity when interpreting traffic proportions since repulsion
forces among observation nodes push some nodes closer to unrelated dimension
nodes.
1
2
3
4
5
6
SSH
FTP
DNS
HTTP Undefined
IMAP
SMTP
1
2
3
5
6
host A
host B
1
2
3
4
5
6
SSH
FTP
DNS
HTTP Undefined
IMAP
SMTP
1
2
3
5
6
host A
host B
Fig. 4 Fine-tuning the graph layout through cohesion forces between the trace edges can improve
the compactness of traces.
3.4 Abstraction and integration of the behavior graph in HNMap
We previously presented the HNMap as a hierarchical view on the IP address
space [Mansmann et al., 2007]. Hosts are grouped by prefixes, autonomous systems
(ASes), countries, and continents using a space-filling hierarchical visualization.
This scalable approach enables the analyst to retrieve details about a quantitative
measure of network traffic to and from hosts in the visualization using the above
mentioned aggregation levels.
Figure 5 shows the HNMap on the AS level. Through the pop-up menu, a behav-
ior graph for any one of the shown ASes can be displayed. Since detailed informa-
tion to build up the behavior graph is available for all child levels, the user is free to
choose the appropriate one. Note that only the lowest two levels of details are avail-
able since the selected node (red node at the upper left corner of the pop-up menu)
Visualization of Host Behavior for Network Security 11
Fig. 5 We integrated the behavior graph into the HNMap visualization system. The behavior of
the selected HNMap rectangle is presented by showing its child nodes (e.g. hosts, prefixes, ASes,
countries, or continents) instead of being limited to the lowest-level host behavior.
is an AS node. The higher level behavior graphs can be triggered in less granular
HNMap views.
While the behavior graph on prefixes, ASes, countries, or continents represents
less detailed information about the particular substructures of the internet, it has
proven to be beneficial since these aggregated behavior graphs significantly reduce
the information overload that a network administrator needs to face when dealing
with large-scale network traffic monitoring. Hence, finding the relevant subset using
HNMap in combination with aggregation in detail views can be seen as possible
solutions to get hold of scalability problems.
3.5 Application and Evaluation
In order to demonstrate the tool’s capabilities, we present a brief case study using
SNORT intrusion detection alerts followed by a demonstration of the automatic
accentuation visual analytics feature, which is demonstrated on the basis of traffic
measurements from our university gateway.
12 Florian Mansmann, Lorenz Meier, and Daniel A. Keim
3.5.1 Case study
For this case study, we evaluated the 19,000 alerts generated by a SNORT intrusion
detection sensor within our university network in slightly more than two days. The
alerts referred to 17 hosts that scanned the network or generated suspicious network
traffic. The attraction nodes were in this case not initialized with application port
numbers, but rather with the 15 most prominent SNORT alerts of our data set and
an “Undefined” traffic node for the remaining 71 rarely occurring alerts.
Fig. 6 Evaluating two days of SNORT intrusion detection alerts with the behavior graph.
Figure 6 shows the outcome of our behavior graph. Larger nodes indicate a higher
number of alerts and thus helps us to quickly identify the most actively attacking
nodes. The graph layout generated a number of homogeneous and heterogeneous
clusters. Color and shapes make nodes of different observation groups more distin-
guishable.
During interactive exploration, we discovered that the brown host on the upper
left was continually scanning using ICMP PING NMAP and ICMP PING. Further-
more, the green host close to the middle and below “Undefined” generated about
1000 alerts of various kinds, probably actively scanning the sensor machine for
vulnerabilities. The two hosts with router advertisements in the lower left corner are
actual routers of the network and the alerts were only generated because the SNORT
sensor configuration did not exclude them.
Visualization of Host Behavior for Network Security 13
3.5.2 Automatic accentuation of node groups with highly variable traffic
When regarding the behavior graph, clusters immediately stand out. However, in
many scenarios the analyst is rather interested in nodes with highly variable traffic,
or in other words, nodes that jump from one place to the other in the visualization.
Since our visualization spans up a n-dimensional metric space, it is possible to cal-
culate the normalized positional changes pc
norm
of all t subsequent observations of
a host in this Euclidean space:
−→
o
r
=
−→
o
|
−→
o |
(1)
pc
norm
=
∑
t
max
−1
t=1
|
−→
o
r
t
−
−→
o
r
t+1
|
t
max
, 0 ≤ pc
norm
≤ 2 (2)
Note that we first need to calculate the relative position
−→
o
r
of an observation
node – our graph layout tries to place nodes with identical relative positions close
to each other. Then, after calculating pc
norm
for every node observation group, it
becomes trivial to accentuate the groups with the highest values. The bounds of
pc
norm
can be explained through the fact that any component of vector
−→
o
r
t
is counted
twice, once in the calculation of the difference between
−→
o
r
t
and
−→
o
r
t+1
and once
between
−→
o
r
t
and
−→
o
r
t−1
.
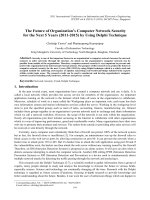
Fig. 7 Automatic accentuation of highly variable /24 prefixes using one hour network traffic from
the university network.
14 Florian Mansmann, Lorenz Meier, and Daniel A. Keim
To demonstrate the capabilities of our tool in a reproducible way, we used traffic
measurements from our university network. In particular, we loaded all netflows
passing the university gateway into the database, aggregated them the traffic /24
prefixes. An aggregating SQL query calculates the data for each node and loads it
into the visualization and exploration tool. Figure 7 shows the behavior of the 96
of the /24 prefixes in the data set. Note that nodes with highly variable traffic are
automatically accentuated in accordance with the outcome of our calculations.
3.5.3 Scalability
Our tool works well with approximately 1000 observation nodes. The number of
actual observation nodes depends on the number of monitored network entities, the
time interval over which the data is aggregated and the monitored time span. Each
one of these can be seen as a factor to estimate the number of observation nodes (e.g.
monitoring 50 hosts over 6 ten minutes intervals results in approximately 300 ob-
servation nodes). Above these 1000 observation nodes, layout calculation becomes
tedious and fine-tuning layout parameters turns into a challenge in itself.
4 Future Work
We noticed that it would add additional functionality if we enable users to select a
certain point in time for visualization. One possibility would be to use a histogram
of the amount of traffic over time. The user could then select an interval on this
histogram to view the traffic. Another interesting possibility would be the option
to visualize network flows in realtime with a sliding time window starting at the
present and extending to some time in the past. As our layout is calculated itera-
tively, realtime visualization should be possible with a decent processor. Another
direction for further work is the integration of an automatic dimension selection.
For datasets with very high dimensionality the view gets cluttered. As our technique
focuses already on a general view and not on details, it would make sense to use
algorithms like PCA to eliminate dimensions which do have only a minor effect on
the resulting visualization layout.
5 Conclusions
In the scope of this paper, we discussed a novel network traffic visualization
metaphor to monitor host behavior. It uses an adaption of the force-driven Fruchter-
man-Reingold graph layout to place host observation points with similar traffic pro-
portions close to each other. Various means of interaction with the graph make the
tool suitable for exploratory data analysis.
Visualization of Host Behavior for Network Security 15
Since our behavior graph can be used to evaluate both low-level host behavior as
well as more abstract network entities, we integrated it in the HNMap tool. It can
there be triggered through a pop-up menu on network entities of various granularity
levels (e.g., hosts, prefixes, ASes).
The usefulness of the presented tool was demonstrated using traffic measure-
ments from our university’s gateway router and IDS alerts from a SNORT sensor.
Within a brief case study, findings that can be extracted from the presented behavior
graph are discussed. To equip our tool with a visual analytics feature, we introduced
a normalized measure for positional changes in n-dimensional euclidean space to
automatically accentuate suspicious node groups with highly variable traffic.
Acknowledgments
This work has been funded by the BW-FIT research cluster “Gigapixel displays”
and by the German Research Society (DFG) under the grant GK-1042, “Explorative
Analysis and Visualization of Large Information Spaces”, Konstanz. We thank the
anonymous reviewers of the VizSec workshop 2007 for their valuable comments.
References
[Abdullah et al., 2005] Abdullah, K., Lee, C., Conti, G., Copeland, J. A., and Stasko, J. (2005).
Ids rainstorm: Visualizing ids alerts. In Proc. IEEE Workshop on Visualization for Computer
Security (VizSEC), Minneapolis, U.S.A.
[Chen, 2004] Chen, C. (2004). Information Visualization - Beyond the Horizon. Springer, 2nd
edition.
[Cheswick et al., 2000] Cheswick, B., Burch, H., and Branigan, S. (2000). Mapping and visualiz-
ing the internet. In Proc. 2000 USENIX Annual Techincal Conference.
[Claffy, 2001] Claffy, K. (2001). Caida: Visualizing the internet. IEEE Internet Computing,
05(1):88.
[Davidson and Harel, 1996] Davidson, R. and Harel, D. (1996). Drawing graphs nicely using
simulated annealing. ACM Trans. Graph., 15(4):301–331.
[Eades, 1984] Eades, P. A. (1984). A heuristic for graph drawing. In Congressus Numerantium,
volume 42, pages 149–160.
[Eick, 2005] Eick, S. G. (2005). The Visualization Handbook, chapter Scalable Network Visual-
ization, pages 819–829. Elsevier.
[Fink et al., 2005] Fink, G. A., Muessig, P., and North, C. (2005). Visual correlation of host pro-
cesses and network traffic. In Proc. IEEE Workshop on Visualization for Computer Security
(VizSEC), pages 11–19.
[Fruchterman and Reingold, 1991] Fruchterman, T. M. J. and Reingold, E. M. (1991). Graph
drawing by force-directed placement. Software - Practice and Experience, 21(11):1129–1164.
[Goodall et al., 2006] Goodall, J. R., Lutters, W. G., Rheingans, P., and Komlodi, A. (2006).
Focusing on context in network traffic analysis. IEEE Computer Graphics and Applications,
26(2):72–80.
[Kamada and Kawai, 1989] Kamada, T. and Kawai, S. (1989). An algorithm for drawing general
undirected graphs. Inf. Process. Lett., 31(1):7–15.
16 Florian Mansmann, Lorenz Meier, and Daniel A. Keim
[Keim and Ward, 2002] Keim, D. and Ward, M. (2002). Visual Data Mining Techniques, pages
403–427. Springer, 2 edition.
[Lakkaraju et al., 2005] Lakkaraju, K., Bearavolu, R., Slagell, A., Yurcik, W., and North, S.
(2005). Closing-the-loop in nvisionip: Integrating discovery and search in security visualiza-
tions. In Proc. IEEE Workshop on Visualization for Computer Security (VizSEC).
[Lau, 2004] Lau, S. (2004). The spinning cube of potential doom. Communications of the ACM,
47(6).
[Lee et al., 2005] Lee, C. P., Trost, J., Gibbs, N., Beyah, R., and Copeland, J. A. (2005). Visual
firewall: Real-time network security monito. In Proc. IEEE Workshop on Visualization for Com-
puter Security (VizSEC), pages 129–136.
[Livnat et al., 2005] Livnat, Y., Agutter, J., Moon, S., Erbacher, R., and Foresti, S. (2005). A visu-
alization paradigm for network intrusion detection. In IEEE Information Asssurance Workshop,
pages 92–99.
[Mansmann et al., 2007] Mansmann, F., Keim, D. A., North, S. C., Rexroad, B., and Shelehedal,
D. (2007). Visual analysis of network traffic for resource planning, interactive monitoring, and
interpretation of security threats. IEEE Transactions on Visualization and Computer Graphics,
13(6).
[Marchette, 2001] Marchette, D. J. (2001). Computer Intrusion Detection and Network Monitor-
ing - A Statistical Viewpoint. Statistics for Engineering and Information Science. Springer.
[McPherson et al., 2004] McPherson, J., Ma, K L., Krystosk, P., Bartoletti, T., and Christensen,
M. (2004). Portvis: a tool for port-based detection of security events. In Proc. ACM workshop on
visualization and data mining for computer security, pages 73–81, New York, NY, USA. ACM
Press.
[Muelder et al., 2005] Muelder, C., Ma, K L., and Bartoletti, T. (2005). A visualization method-
ology for characterization of network scans. In Proc. IEEE Workshop on Visualization for Com-
puter Security (VizSEC), Minneapolis, U.S.A.
[Munzner et al., 1996] Munzner, T., Hoffman, E., Claffy, K., and Fenner, B. (1996). Visualizing
the global topology of the mbone. In IEEE InfoVis, Los Alamitos, CA, USA. IEEE Computer
Society.
[O’Madadhain et al., 2007] O’Madadhain, J., Fisher, D., Smyth, P., White, S., and Boey, Y B.
(2007). Analysis and visualization of network data using jung. Journal of Statistical Software.
[PostgreSQL Global Development Group, 2007] PostgreSQL Global Development Group
(2007). PostgreSQL. cited 10/09/2007.
[Sourcefire, 2005] Sourcefire (2005). Real-time network awareness. cited on 11/11/2005.
[Thomas, 2005] Thomas, J. (2005). Visual analytics: a grand challenge in science - turning in-
formation overload into the opportunity of the decade. In Proceedings IEEE Symposium on
Information Visualization (InfoVis), page xii. IEEE Computer Society. Keynote address.
[Thomas and Cook, 2005] Thomas, J. and Cook, K. (2005). Illuminating the Path: Research and
Development Agenda for Visual Analytics. IEEE-Press.
[Xiao et al., 2006] Xiao, L., Gerth, J., and Hanrahan, P. (2006). Enhancing visual analysis of
network traffic using a knowledge representation. In Visual Analytics Science and Technology
(VAST), pages 107–114.
[Yin et al., 2004] Yin, X., Yurcik, W., Treaster, M., Li, Y., and Lakkaraju, K. (2004). Vis-
flowconnect: netflow visualizations of link relationships for security situational awareness. In
VizSEC/DMSEC, pages 26–34.