Who Has Time To Cook - How Family Resources Influence Food Preparation pdf
Bạn đang xem bản rút gọn của tài liệu. Xem và tải ngay bản đầy đủ của tài liệu tại đây (323.68 KB, 25 trang )
United States
Department
of Agriculture
Economic
Research
Service
Economic
Research
Report
Number 40
Who Has Time To Cook?
Lisa Mancino
Constance Newman
How Family Resources
Influence Food Preparation
May 2007
w
w
w
.
e
r
s
.
u
s
d
a
.
g
o
v
You can find additional information about ERS publications,
databases, and other products at our website.
Visit Our Website To Learn More!
National Agricultural Library
Cataloging Record:
The U.S. Department of Agriculture (USDA) prohibits discrimination in all its
programs and activities on the basis of race, color, national origin, age,
disability, and, where applicable, sex, marital status, familial status, parental
status, religion, sexual orientation, genetic information, political beliefs, reprisal,
or because all or a part of an individual's income is derived from any public
assistance program. (Not all prohibited bases apply to all programs.) Persons
with disabilities who require alternative means for communication of program
information (Braille, large print, audiotape, etc.) should contact USDA's TARGET
Center at (202) 720-2600 (voice and TDD).
To file a complaint of discrimination write to USDA, Director, Office of Civil
Rights, 1400 Independence Avenue, S.W., Washington, D.C. 20250-9410 or call
(800) 795-3272 (voice) or (202) 720-6382 (TDD). USDA is an equal opportunity
provider and employer.
Photo credit: DigitalVision and PhotoDisc.
Mancino, Lisa
Who has time to cook? : how family resources influence food preparation.
(Economic research report (United States. Dept. of Agriculture.
Economic Research Service) ; no. 40)
1. Cookery—United States.
2. Food consumption—United States.
3. Time management—United States.
4. Socioeconomic status.
5. Food relief—United States.
I. Newman, Constance.
II. United States. Dept. of Agriculture. Economic Research Service.
III. Title.
HV696.F6
United States
Department
of Agriculture
www.ers.usda.gov
A Report from the Economic Research Service
Who Has Time To Cook?
How Family Resources Influence
Food Preparation
Lisa Mancino and Constance Newman
Abstract
Households participating in the Food Stamp Program are increasingly headed
by a single parent or two working parents. As this trend continues, more
low-income households may find it difficult to allocate the time needed to
prepare meals that fit within a limited budget and meet dietary require-
ments. Using Tobit analysis of the 2003-04 American Time Use Survey
(ATUS), this study finds that household time resources significantly affect
how much time is allocated to preparing food. In fact, working full-time and
being a single parent appear to have a larger impact on time allocated to
food preparation than an individual’s earnings or household income do. The
results are relevant for the design of food assistance programs as well as for
improving our understanding of how different family time resources affect
consumption behavior.
Keywords: Food preparation, Tobit analysis, time use, Thrifty Food Plan
Acknowledgments
The authors greatly appreciate the thoughtful review suggestions from
Charlene Kalenkoski, David Ribar, Andrea Carlson, Mark Lino, and
Dean Joliffe. We also thank Linda Hatcher and Anne Pearl for editorial
and design assistance.
Economic
Research
Report
Number 40
May 2007
Contents
Summary iii
Introduction 1
So Many Choices, So Little Time: How Economic and
Sociodemographic Factors Influence the Way We
Spend Our Time 3
Modeling Time Use Decisions: Our Data and Econometric Approach 5
Data 5
Econometric Approach 5
Findings: Who’s Cooking and How Much? 10
Conclusions 17
References 18
ii
Who Has Time To Cook? How Family Resources Influence Food Preparation/ERR-40
Economic Research Service/USDA
Summary
USDA uses the Thrifty Food Plan (TFP) to show Food Stamp Program
participants how low-cost, healthy meals can be purchased with monthly
food stamp benefits. When the TFP was first created in 1975, most families
had a nonworking adult in the home who was likely to prepare meals from
scratch. Today, however, an increasing number of low-income families have
either a single working parent or two working parents. These households
may spend less time preparing meals than was typical in the past. Recent
efforts have been made to incorporate more convenient and commercially
prepared foods into the TFP market basket. This research supports those
efforts by showing how differences in family time resources can affect food
preparation decisions.
What Is the Issue?
There is little information on how time resources influence time spent in
preparing food. Thus, to understand if and how time use decisions vary with
both time and monetary resources, this study estimates how the amount of
time an individual spends daily in preparing food correlates with individual
and household characteristics. Does the time allocated to preparing food
vary systematically with income, wage rates, marital status, employment
status, employment status of other household adults, and the number of
children in a household?
What Did the Project Find?
Our study shows that characteristics, such as income, employment status,
gender, and family composition, clearly affect food preparation decisions.
This relationship is weakest among men, stronger among women, and
strongest of all among full-time workers and single parents.
The relationship between personal characteristics and how much time men
spend preparing food, especially low-income men, was unclear. Our results
for men also contradict the hypothesis that lower household earnings mean
more time preparing food. For both full-time employed and nonworking
men, those with lower household income spend less time preparing food
than do men in households with higher incomes.
Regardless of income and marital status, women spend more time preparing
food than men do. Among women, time spent preparing food in the home
falls with higher household income and more time working outside the
home. Our estimates suggest that nonworking women spend just over 70
minutes per day preparing food, whereas women who work part-time spend
53-56 minutes per day and full-time working women spend 38-46 minutes
per day preparing food.
Single women spend less time preparing food than do married or partnered
women whether they are working or not. Single working women spend about
15 minutes less per day preparing food than do married or partnered working
women. Single nonworking women spend approximately 30 minutes less per
day cooking than do nonworking women who are married or have partners.
iii
Who Has Time To Cook? How Family Resources Influence Food Preparation/ERR-40
Economic Research Service/USDA
Among low- and middle-income women, time spent preparing food does
not decrease significantly with higher wage rates. Among higher income
women, however, an increase in weekly earnings of $100 would translate
into 9 fewer minutes spent in preparing food per day.
Having more children who live in the household also increases the time a
woman spends preparing food, suggesting that, among women, household
time resources significantly affect the amount of time allocated to preparing
food. In fact, working full-time and being a single parent appear to affect
the time allocated to preparing food more than an individual’s earnings or
household income do.
Estimates of the time needed to follow recipes from the TFP range from
80 minutes a day to 16 hours a week. We find that many low-income
households—those with two adults or those headed by a single parent that
works less than 35 hours a week—allocate enough time for food preparation.
However, our estimates also say that low-income women who work full-time
spend just over 40 minutes per day and thus may have difficulties meeting
the past plan’s implied time requirements.
How Was the Project Conducted?
We use 2003-04 data from the American Time Use Survey and multivariate
analysis to explore how time allocated to preparing food differs between
low-income and higher income households. A household is defined as low-
income if total income equals 130 percent of the poverty line or less. We
also run separate estimates based on gender and whether an individual
works full-time (more than 35 hours in week), part-time (less than 35 hours
a week, but in the labor force), or is not employed.
The dependent variable, time spent in food preparation, is the total minutes
in a day spent in the following four activities:
• Preparing food and drinks, which includes cooking and in any way getting
food and drink ready for consumption.
• Serving food and drinks, which includes activities like setting the table.
• Food and kitchen cleanup.
• Storing or putting away food and drinks.
We use a Tobit model because food preparation time in a single day is zero
for many individuals. To account for the sample design, we use sampling
weights to obtain representative parameter estimates and specify strata and
clustering variables to increase their efficiency.
iv
Who Has Time To Cook? How Family Resources Influence Food Preparation/ERR-40
Economic Research Service/USDA
Introduction
To ensure access to nutritious food by low-income families,
1
the Food
Stamp Program provides the Thrifty Food Plan (TFP) as a guide for how to
purchase low-cost, healthy meals with food stamp benefits. Initially devel-
oped in 1975, the TFP is maintained by USDA’s Center for Nutrition Policy
and Promotion. CNPP determines the TFP with a model that uses data on
the dietary intakes of low-income individuals and national average food
prices to produce a theoretical food plan. The plan minimizes deviations
from current dietary patterns while meeting nutrition requirements within a
budget that does not exceed maximum food stamp benefits (Carlson et al.,
2007). Because the data on the food people consume and the food they
purchase are not directly linked, researchers must make assumptions about
where food is purchased, in what form, and at what level of convenience or
preparation. As a practice, they have assumed that all meals and snacks are
prepared at home, often from scratch. To allow for more convenient and
commercially prepared foods, the most recent TFP was created using a
panel of experts to determine when these assumptions could be relaxed
(Carlson et al., 2007).
However, there is little information on how much time people actually
reserve for food preparation or how much time is needed to meet basic
dietary requirements on a limited budget. Using a companion piece to the
1999 TFP that provides daily menus to conform with the TFP, Recipes and
Tips for Healthy, Thrifty Meals (USDA, 2000), Rose (2004) estimates that it
would require 16 hours a week to follow the suggested menus. Another
study estimates that each of these recipes require an average of 40 minutes
(Davis and You, 2006), where a typical weekly menu includes two dishes
made from scratch each day. According to these estimates, the daily time
required to meet dietary requirements within a family’s maximum food
stamp benefits could range from 80 minutes to 2½ hours per day.
A growing number of low-income families have either a single working
parent or two working parents. Overall, wage earners have become more
prevalent in the Food Stamp Program: In fiscal year 1990, 19 percent of
food stamp recipient households had earnings, whereas in fiscal year 2005,
29 percent had earnings (Barrett, 2006). Also, single parents make up more
than a third of all food stamp households. According to USDA’s Food and
Nutrition Service (FNS) (the agency that administers the Food Stamp
Program), in fiscal year 2005, over 62 percent of food stamp households
with children were headed by a single adult, representing 34 percent of all
food stamp households (Barrett, 2006). As such, an increasing number of
low-income families may find it difficult to allocate the time needed to
prepare meals that would fit within the implied time budget of the TFP.
How much time one chooses to spend preparing food is likely to depend on
both monetary and time resources. For example, the total time available to
the household for food preparation will depend heavily on the number of
adults in a household, how much time they all spend working in the labor
force, and the number of children. Explicitly recognizing the importance of
time as another household resource was first proposed by Vickery (1977).
Two adults living in a household with only one person working full-time
1
We use the terms “family” and
“household” interchangeably. Although
food stamp benefits and the TFP are
defined in terms of family-level
resources, much of the data used in
this study are defined at the household
level.
1
Who Has Time To Cook? How Family Resources Influence Food Preparation/ERR-40
Economic Research Service/USDA
outside of the home will have more total household time to prepare meals
compared with a single person who works full-time. For simplicity, we refer
to the total number of adult hours available for household activities as
“household time.” In reference to poverty measures, this relationship has
consequences for low-income households with less household time because
the food assistance they receive is calculated according to a uniform TFP
formula (or poverty line in Vickery’s case) that assumes a certain, average
level of time availability. Because time spent in preparing food generally
reduces the monetary cost of food and commercially prepared food costs
relatively more, the food stamp benefit level implied by a uniform TFP may
not fully address the needs of households that are low on both monetary
resources and total household time.
We assess how sensitive time allocated to food preparation is to both mone-
tary and time resources. We use data from the 2003-04 American Time Use
Survey (ATUS) to estimate how the time an individual spends preparing
food varies with labor force participation, wages, the presence of children
and other adult household members, and earnings and labor force participa-
tion of other family members. Ideally, we would analyze total household
time, but the time use data are only available for individuals. Thus, we must
infer the effect of total household time by examining differences across
individuals living in different household types.
2
Who Has Time To Cook? How Family Resources Influence Food Preparation/ERR-40
Economic Research Service/USDA
So Many Choices, So Little Time:
How Economic and Sociodemographic
Factors Influence the Way
We Spend Our Time
The framework developed in Becker’s household production model (1965)
is often used to analyze individual time-allocation choices.
2
This model
assumes that individuals maximize utility from consumption goods and
leisure time, subject to constraints on their time, budget, and ability to make
consumption goods themselves. The model explicitly recognizes time as a
valued input that is optimally allocated to produce income, consumption
goods, and leisure. It predicts that individuals choose a mix of time and
purchased inputs that maximizes well-being while minimizing the full cost
(time and money) of doing so. The resulting supply of time spent in
preparing food is determined by the price of inputs, wages, household
income, and other individual and household characteristics.
In this framework, increasing wages and payoffs from time spent working will
typically reduce the time spent in producing goods and services for personal
use. Increasing other household assets, such as the earnings of other family
members, may also reduce the time an individual spends in home production
activities like cooking. Indeed, as family incomes rise, so does spending on
convenience foods: A 10-percent increase in income brings about an estimated
4 percent rise in spending on food away from home but only a 1-percent
rise in spending for food at home (Blisard, Variyam, and Cromartie, 2003).
However, higher earnings of other family members may also increase the
individual’s time in food preparation if that individual specializes in food
preparation in response to having lower relative earnings.
In terms of family characteristics, the number of people living in a house-
hold should increase the time required to prepare, cook, and clean up after
meals for everyone. Volume discounts and other economies of scale should
also make cooking at home more cost-effective for a larger family. We
expect that households with more children will devote more time to food
preparation, all else equal. Adult individuals who live with other adults may
be better able to share responsibilities for certain household tasks than those
who live alone or as single parents. One single adult will have less total
time to devote to necessary household activities, such as food preparation,
compared with two married or partnered individuals.
Individual differences in time-allocation decisions are also likely to depend
on the households’ overall ability to substitute time for money. All else
equal, individuals living in homes with higher household incomes will be
more able to afford foods prepared away from home and, therefore, more
likely to substitute prepared foods for home-cooked foods. For example, we
expect the inverse relationship between an individual’s wage rate and time
spent cooking to be less pronounced among individuals with lower house-
hold income. Similarly, because lower income households are less able to
substitute time for money, we expect that some aspects of family composi-
tion, such as the number of children and working adults, will have a more
pronounced effect on the amount of time they allocate to preparing food.
3
Who Has Time To Cook? How Family Resources Influence Food Preparation/ERR-40
Economic Research Service/USDA
2
Although modeling the joint supply
of all household members’ time would
be more precise, the ATUS collects time
use data only from a single individual
within a household. Thus, modeling
these decisions as a household would
complicate the conceptual framework
and, ultimately, not be directly applica-
ble to the empirical analysis.
In addition to wages, household wealth, and the time availability of other
household members, certain sociodemographic characteristics will likely
affect how much time an individual allocates to preparing food. For one, we
expect to find that women spend more time preparing food than men do
even when taking into account other factors that determine food preparation
time. As women move into the labor force in greater proportions, the tradi-
tional pattern of women doing all of the food preparation is changing.
Nonetheless, the tradition persists and women tend to do more household
work than men do. Women still spent over twice as much time as men did
in child care activities in 2005 and nearly three times more time in food
preparation (Bureau of Labor Statistics, 2006). Harnack et al. (1998) also
found that men are less likely to be involved in planning or preparing family
meals. In households with both female and male household heads, they
found that less than 30 percent of male respondents reported any involve-
ment in either planning or preparing family meals, whereas at least 90
percent of females reported involvement with these same tasks.
Although women still tend to do most of the meal planning and preparing in
married and partnered homes, as women’s hours in paid work increases,
their time in food preparation decreases (Zick, 1996). In fact, the increased
availability of convenience foods and food away from home has often been
attributed to women’s increased participation in the labor force. For that
reason, we expect that changes in family resources, such as wages, house-
hold income, and family composition, will have more prominent effects on
women’s food-preparation decisions than on men’s. Gender roles have also
changed over time and differ across cultures. As such, the effects of age,
culture, and other factors are likely to differ across gender as well.
In summary, we expect that the amount of time an individual spends preparing
food each day to be a function of his or her earnings; the presence, earnings,
and labor force participation of other family members; the number of chil-
dren living in the household, and the individual’s sociodemographic charac-
teristics, such as education, ethnicity, and gender.
4
Who Has Time To Cook? How Family Resources Influence Food Preparation/ERR-40
Economic Research Service/USDA
Modeling Time Use Decisions:
Our Data and Econometric Approach
Data
We use data from the 2003-04 American Time Use Survey (ATUS), which
is administered by the Bureau of Labor Statistics and the Census Bureau.
The ATUS is a stratified, three-stage, random and nationally representative
sample of households completing their final month of interviews for the
Current Population Survey (CPS) (Bureau of Labor Statistics, 2006). To
account for the sample design, we used STATA 9.0 and sampling weights to
obtain representative parameter estimates. We also specify strata and clus-
tering variables to increase the efficiency of our estimates.
The ATUS interviews one person per household. On average, ATUS inter-
viewed about 1,725 individuals per month in 2003 and 1,100 individuals per
month in 2004. Respondents were asked about their activities on the day
before their interview, covering a 24-hour period beginning at 4 a.m. Through
conversational interviews, each respondent provides a description of the type
and duration of each activity in which he or she participated during the
previous 24 hours. Survey respondents were asked to identify their primary
activity if they engaged in two or more activities simultaneously. Except for
time spent caring for children, data on time spent in secondary activities were
not included in the 2003-04 ATUS, which may have led to an underestimate
of the total amount of time spent in any single activity. For example, someone
who cleaned the refrigerator while cooking dinner and reported cleaning as
his or her primary activity would have reported fewer minutes in food
preparation than someone who spent the same amount of time cooking, but
reported no other primary activity.
In addition to detailed activity descriptions, ATUS data also contain demo-
graphic information, such as age, gender, ethnicity, and household income
as well as information about an individual’s labor force participation and the
labor force participation and earnings of other household members. All
household members ages 15 and older are eligible for the ATUS. Some of
these respondents, such as teenage children and elderly parents living with
other family members, may not be as involved in preparing meals. If these
individuals are also more likely to be single, which we believe they are, then
including them in our sample could bias downward the effect of being single.
We therefore limit our final sample to include only individuals who identify
themselves as the male or female head of household in the CPS interview.
Our final sample includes observations from 30,058 adult respondents who
are identified as a household head in the CPS interview.
Econometric Approach
Our goal is to estimate if and how much time use decisions vary with differ-
ences in specific family and individual characteristics, such as whether or not
an individual has a partner or spouse, while holding all other individual and
family characteristics constant. For this application, we use multivariate
analysis, which allows us to determine the net effect that a single variable
has on how much time one spends in food preparation, while holding all
other household and individual characteristics constant. Other techniques,
5
Who Has Time To Cook? How Family Resources Influence Food Preparation/ERR-40
Economic Research Service/USDA
such as cross tabulations, would not allow us to look at differences in food
preparation by marital status while simultaneously controlling for the
employment status of other household members, the number of children in
that household, and one’s level of education.
Theoretically, the optimal allocation of each household member’s time in all
possible pursuits is determined simultaneously as a household decision. Due
to data limitations, however, we cannot estimate all of these separate decisions
and include their impacts on how much time an individual allocates to food
preparation, as would be ideal. Consequently, including a measure of labor
force participation directly in our model to estimate how much time one
spends preparing food will lead to biased estimates.
However, the decision to work outside the home is so important to the decision
to allocate time for food preparation that omitting this variable would also
bias our results. Working outside the home requires that a large block of one’s
time be devoted to it—typically 8 or more hours per day. As such, it will
greatly reduce the amount of time one can dedicate to other activities like
food preparation. Unfortunately, estimating these decisions simultaneously
using a two- or three-stage estimator becomes difficult because both food
preparation and hours worked outside the home are censored, or take on a
zero value, for a large portion of the sample. Among women, 36 percent of
our final sample reported no time in food preparation and 41 percent were
not in the labor force. Among men, 57 percent reported no time in food
preparation and 26 percent were not in the labor force. To circumvent this
problem, we run separate estimates of time spent preparing food by those
who work full-time (more than 35 hours per week), those who work part-
time (less than 35 per week, but employed), and those who are not
employed.
3
Note, however, that a potential sample selection bias remains
because we are splitting the sample along endogenous choice variables.
Because we expect the effect of some individual and household characteris-
tics to differ by gender and income, we also run separate estimates for
women and for low-income households. We define a household as low-
income if that household’s income relative to the poverty guideline for a
household of the same size is 1.3 or below. This income relative to poverty
ratio (IRP) is a common standard for comparing income across households
of different sizes. It is used to determine whether an individual or household
can qualify for certain food assistance and welfare programs. For example,
an IRP of 1.3 or below is one of the first qualifications a household must
meet to qualify for food stamp benefits. Researchers also use this same
cutoff to calculate the typical diet of low-income consumers when creating
the TFP (USDA, 1999). Because the ATUS reports income as a categorical,
rather than continuous, variable, we use the midpoint value from each of the
income categories and the top code value of $150,000 for the highest
income category to create the IRP values.
Our dependent variable, the amount of time spent each day in food prepara-
tion (TF), is zero for many individuals. Thus, estimating the relationship
between this dependent variable and the independent variables via ordinary
least squares would result in inconsistent parameter estimates. We therefore
use a Tobit model for our analysis. This model assumes a latent unobserv-
able variable,TF
*
, and an observable variable, TF, that is defined to equal
6
Who Has Time To Cook? How Family Resources Influence Food Preparation/ERR-40
Economic Research Service/USDA
3
See Jenkins and O’Leary (1995) for
analysis of how paid market work
should be treated in models of domestic
work. They review early literature,
some of which included paid work as a
regressor and some of which did not.
this latent variable whenever it takes on a value greater than zero and is
defined equal to zero otherwise. The econometric model estimated for the
Tobit can then be written as:
And the latent variable, , is defined as:
The subscript i refers to each individual, and the subscript g refers to his or
her gender, income (IRP at or below 1.3 or IRP above 1.3), and employment
(working full- or part-time or nonworking) grouping, which leaves a total of
12 subgroups. TF
ig
is measured as the total minutes spent in preparing food,
w
ig
is an individual’s wage rate, A
ig
is the a vector representing the presence
of other household adults, wA
ig
is a vector of their earnings, TFA
ig
is a
vector of their household time, C
ig
is the number of children living in a
household, D
ig
is a vector of individual sociodemographic characteristics,
and
ε
ig
is a normally distributed error term.
Dependent Variable—Time Spent Preparing Food
Definitions and summary statistics for the variables used in the econometric
analysis are found in table 1. The ATUS data contain six activity codes
related to food preparation and acquisition. We combine the following four
food preparation activities into one because they are all part of the main
activity of preparing a meal:
1. Preparing food and drinks, which includes cooking and in any way
getting food and drinks ready for consumption.
2. Serving food and drinks, which includes activities like setting the table.
3. Food and kitchen cleanup.
4. Storing or putting away food and drinks.
We refer to this general combination variable as “food preparation.”
Explanatory Variables
For individuals in the work force, we use total weekly earnings and the number
of hours worked at all jobs to calculate an individual’s average hourly wage
rate. However, we do not have such information for individuals who are not
in the labor force. One way to correct for any possible bias caused from omit-
ting a variable that represents an individual’s opportunity cost of time would
be to estimate the wage rate an individual would have earned if he or she were
employed. Because these estimates are typically determined by the same vari-
ables that influence time-allocation decisions, however, using predicted values
will also bias estimates. Thus, we opt to use reported wage rates for our
entire sample, which means that our estimates among unemployed individuals,
whose reported wage rate is zero, will suffer from an omitted-variable bias.
4
7
Who Has Time To Cook? How Family Resources Influence Food Preparation/ERR-40
Economic Research Service/USDA
4
We ran all of our estimates using
predicted wages and found that the
predicted values of time spent in food
preparation were extremely similar
when using either reported or pre-
dicted wage rates. Also, there were
few changes in terms of magnitude
or significance of our parameter
estimates. In using predicted wages,
the biggest changes in significance
were among variables meant to cap-
ture sociodemographic variables—
education and urbanization—which is
not surprising because these variables
are most likely positively correlated
with wage rates. Thus, our estimates
that do not include wages for unem-
ployed individuals may be downward
biased for these variables. Conversely,
any variables that are negatively corre-
lated with either the probability of
working or an opportunity cost of time
wage may have an upward bias.
8
Who Has Time To Cook? How Family Resources Influence Food Preparation/ERR-40
Economic Research Service/USDA
Table 1
Summary statistics for how much time family and individual characteristics affect time spent preparing food
Standard
Variable Definition and units Mean deviation
Dependent variable:
Food time Daily sum of minutes spent in food preparation 39.59 58.00
Separating variables:
Full-time 1 if individual works more than 35 hours per week .53 NA
Part-time 1 if individual works but less than 35 hours per week .12 NA
Nonworking 1 if individual is neither part-time nor full-time employed .35 NA
Low-income 1 if midpoint of household income category divided by poverty
guideline for family size is 1.3 or below .17 NA
Female 1 if individual is female .57 NA
Monetary and time resources:
Reported wage Individual’s reported hourly wage rate 16.53 15.79
Other earnings Midpoint of weekly household income range less individual’s
weekly contribution 486.12 571.94
Partner 1 if individual has a spouse or unmarried partner .66
Partner’s household time Maximum number of hours one’s partner has for household work.
Number of hours in week, less 8 hours for sleep each day and
usual hours worked per week 55.92 44.37
Extra adults—healthy Number of adults in household who have not identified themselves
as sick or disabled .05 .25
Extra adults—unhealthy Number of adults in household who are not in the labor force
because of disability or illness .01 .07
Extra adults’ household time Maximum number of hours other healthy household adults have for
household work 4.27 23.27
Number of children Total number of children younger than 18 living in household .82 1.13
Young child 1 if one or more children are younger than 5 .17
Sociodemographic shifters:
High school only 1 if high school or GED only .29 NA
Some college 1 if attended but did not complete a college degree .18 NA
Bachelor’s or
associate degree 1 if received a bachelor’s or associate degree .29 NA
Graduate work or
professional degree 1 if received a graduate or professional degree .12 NA
Age Age of respondent in years 48.81 15.71
Black (non-Hispanic) 1 if respondent is non-Hispanic Black .11 NA
Hispanic 1 if respondent is Hispanic .10 NA
Asian (non-Hispanic) 1 if respondent is Asian .02 NA
Other race (non-Hispanic) 1 if other ethnicity .01 NA
Foreign born 1 if respondent was born outside the United States .11 NA
Regional shifters:
Northeast 1 if respondent lives in the Northeast .20 NA
West 1 if respondent lives in West .35 NA
South 1 if respondent lives in the South .20 NA
Metropolitan 1 if respondent lives in a metropolitan area .79 NA
Other shifters:
Weekend 1 if time diary was recorded for a weekend day .51 NA
Holiday 1 if time diary was recorded for a holiday .02 NA
NA = Not applicable.
Note: Sample includes 30,058 adult respondents who identify themselves as household head (self or spouse) in Current Population Survey
interview.
Source: 2003-04 American Time Use Survey.
In addition to an individual’s own wage, other family members’ earnings
will also influence the entire household’s monetary constraints. To approxi-
mate the earnings of other household members, we use the midpoint value
of the categorical household income variable, convert it to a weekly value,
and subtract an individual’s weekly contribution.
To estimate how food preparation varies with family time resources, we
include the number of adults present in the household and their availability of
time for household chores like cooking. We create a categorical variable that
takes on a zero or one value if the individual has a partner (married or unmar-
ried) that was present in the household during the time use diary. We also
create variables to indicate the number of other adults living in the household
during the time use survey. We further classify these individuals as “healthy”
or “unhealthy.” Although these distinctions may be a bit crude, an individual
is classified as unhealthy if he or she indicated the reason for not being in the
labor force was due to ill health or disability. All other adults were classified
as healthy. We anticipate that each unhealthy adult in a household will increase
the time needed for food preparation more than other household adults.
We also anticipate that how much time an individual spends cooking
depends on the time availability of other household adults. Thus, we create
a variable to measure the maximum amount of time an individual’s partner
has for household production activities. This variable is simply the total
number of hours in a week, less 8 hours a day for sleeping, and the total
number of hours the partner or spouse works, on average. We create a
similar variable for all healthy adults in a household.
The number of children in a household should increase the time spent
preparing food. We also expect that households with young children spend
more time preparing food than those with older children. The presence of
young children may increase the opportunity cost of eating outside the
home. Individuals with children in their care may find that eating food
outside the home entails foregoing time that could have been spent reading
to children or helping with their homework. For some, it may also reduce
the enjoyment of eating outside the home. Thus, we include a dummy vari-
able to indicate whether or not a nonschool-aged child (ages 5 or younger)
lives in the household.
Many of the variables we include as individual characteristics, such as age,
gender, and education, are self-explanatory. We also include age as a quadratic
term because an individual’s caloric requirements and health tend to decrease
with age. We may therefore see them spending less time preparing meals. To
proxy for cultural influences on diet and cooking, we include whether an indi-
vidual is non-Hispanic White, non-Hispanic Black, Hispanic, Asian, or any
other ethnicity and whether that individual was born outside the United States.
To control for possible price variations across regions, we include four
regional dummy variables—Northeast, Midwest, West, and South. We
include a variable to indicate whether an individual lives in a metropolitan
area. We control for whether an individual’s time diary was recorded on a
weekend because past studies on time use have found very different patterns
between weekdays and weekends. We also include a dummy variable to
indicate if the diary day was a holiday.
9
Who Has Time To Cook? How Family Resources Influence Food Preparation/ERR-40
Economic Research Service/USDA
Findings: Who’s Cooking
and How Much?
Estimation results for women and men are reported in tables 2-4, where the
reported coefficients indicate the combined effect (in minutes) that each
explanatory variable has on both the probability that one spends any time in
food preparation and the amount of time he or she spends doing so in a
single day. As expected, the results differed greatly for men and women and
for whether they were employed or not. Using estimated coefficients and
sample means within each subgroup, we estimated the predicted amount of
time per day women and men spent preparing food, by income category and
labor force participation (tables 2-5 and figs. 1 and 2).
We found very few explanatory variables to be significantly associated with
how much time men spend preparing food, especially low-income men. Our
results for men also contradict the hypothesis that there is an inverse rela-
tionship between household earnings and time spent in food preparation. For
both full-time employed and nonworking men, those with lower household
income spend less time preparing food than do men in households with higher
incomes. Moreover, among men with higher incomes, the relationship
between time spent in paid work and time spent preparing food was not clear.
One possible reason for this lack of systematic variation among men is that
most men still generally spend very little time preparing food compared with
women. Our results suggest that men spend about a third less time preparing
10
Who Has Time To Cook? How Family Resources Influence Food Preparation/ERR-40
Economic Research Service/USDA
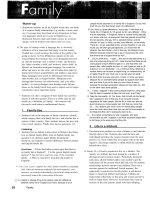
Figure 1
Time that women spend per day
preparing food, by income category
and labor force participation
Women spend less time preparing food
as time requirements of paid work
increase, an effect that is less
pronounced among low-income women
1
Minutes
2
1
Low income = Income-to-poverty ratio of
1.3 or below.
2
Estimates are calculated using the mean
value by income category and working status.
Source: Economic Research Service, USDA.
Low-income
women
All other
women
0
10
20
30
40
50
60
70
80
56
71
38
53
71
46
Working full-time
Working part-time
Nonworking
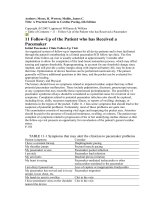
Figure 2
Time that men spend per day
preparing food, by income category
and labor force participation
Low-income men also spend less time
preparing food as time requirements of
paid work increases, but rising income
increases the time spent preparing food
1
Minutes
2
1
Low income = Income-to-poverty ratio of
1.3 or below.
2
Estimates are calculated using the mean
value by income category and working status.
Source: Economic Research Service, USDA.
Low-income
men
All other
men
Working full-time Working part-time
Nonworking
0
10
20
30
40
50
60
70
80
13
16
26
17
15
30
food than women do—between 12 and 30 minutes per day. Because our
models did not work well for men, we do not discuss the results further.
All of the results for women that we discuss here are estimated to be statisti-
cally significant in the regressions. The amount of time women allocate to
preparing food appears to conform with standard economic theory: Time
spent preparing food in the home decreases with household income. Also,
working women spend less time preparing food than nonworking women.
Our estimates suggest that nonworking women spend just over 70 minutes
per day preparing food, whereas women who work part-time spend 53-56
minutes per day and full-time working women spend 38-46 minutes per day
preparing food.
5
In support of our initial hypothesis, we find evidence that low-income
working women may be less able to substitute money for time than women
with higher income. Our results show that, among low-income women, the
time spent preparing food does not decrease significantly with their wage
rate. However, higher wage rates are significantly and negatively related to
less food preparation time among higher income women who work full-time.
An increase in weekly earnings of $100 would translate into 9 fewer minutes
spent in food preparation per day. Time allocated to food preparation does
not vary significantly with the earnings of other household members.
In all regressions, single women spend less time preparing food than their
partnered counterparts do. The effect of having a partner is among the
highest in magnitude of all parameter estimates. Figure 3 shows how the
11
Who Has Time To Cook? How Family Resources Influence Food Preparation/ERR-40
Economic Research Service/USDA
Figure 3
Time that women spend per day preparing food, by marital status,
labor force participation, and income category
Regardless of employment status, the extra time requirements associated with
having a spouse or partner are more pronounced among low-income women,
possibly because they are less able to substitute money for time
1
Minutes
2
1
Low income = Income-to-poverty ratio of 1.3 or below.
2
These estimates assume that each household has two children and that the spouse or
partner works full-time. For all other parameters, estimates are calculated using the mean value
by income category and working status.
Source: Economic Research Service, USDA.
Single
Married or partnered
Working
full-time
(more than
35 hours/
week)
Working
part-time
Nonworking
0
20
40
60
80
100
120
43
62
57
77
67
102
36
51
49
64
69
96
Working
full-time
(more than
35 hours/
week)
Working
part-time
Nonworking
Low-income women All other women
5
Although not presented here, we
estimated the amount of time spent
preparing food for men as well. The
results indicate that men spend 13-20
minutes per day preparing food. These
differences do not vary predictably
by income. Also, the differences
between working and nonworking
men are much less pronounced than
the differences between working and
nonworking women.
estimated time allocated to food preparation by married and single women
varies with labor force participation and income category. To control for
household size and time availability of the spouse or partner, we calculate
predicted minutes in food preparation for a household with two children and
a fully employed partner.
As expected, the effect of having a partner varies by household income,
likely because individuals with higher household incomes are better able to
purchase time-saving inputs. Even after controlling for the number of children,
low-income working women with partners spend about 19-20 more minutes
per day preparing food than their single counterparts do. Higher income
working women with partners, however, spend an additional 15-16 minutes
per day. Similarly, among nonworking women, the low-income ones with
partners spend about 35 more minutes per day cooking than single women,
while nonworking, partnered women with higher incomes spend about 28
more minutes cooking per day than their single counterparts do.
Neither the presence of other healthy adults in the household nor their avail-
ability of time for household chores correlates significantly with time spent
preparing food. However, among women who work part-time, having an
unhealthy adult in the household was positively correlated with more time
preparing food, regardless of income. Among low-income women who
work full-time, time spent preparing food decreases with the number of
unhealthy adults in the household. We find that the number of children in a
household is another important determinant of food preparation time for
both working and nonworking women. However, this effect was not system-
atically more pronounced among lower income women as we had expected.
Among low-income women, both part-time employed and nonworking, the
amount of time spent preparing food was significantly lower for more
educated individuals. However, education and time spent preparing food is
not significantly correlated among low-income women who work full-time.
The exact opposite is true for higher income women: The negative correla-
tion between education and food preparation is only significant among
women who work full-time. This odd result may indicate an omitted vari-
able bias resulting from splitting the sample into employment categories. If
the choice to work full-time is positively correlated with education, our esti-
mates on education may be biased downward.
Across income categories, age had a significant, positive effect on the amount
of time spent preparing food. Some of the variables used to proxy for culture
also significantly affect food preparation. For high-income households,
working Asian women spend approximately 11-20 more minutes per day
preparing food compared with non-Hispanic White women. Among lower
income women who work full-time, Hispanic and Asian women spend more
time preparing food. Among higher income women, those born outside the
United States spend more time preparing food, regardless of labor force
participation. These results may reflect differences in cultural norms or
availability of convenient foods that conform to one’s traditional diet.
12
Who Has Time To Cook? How Family Resources Influence Food Preparation/ERR-40
Economic Research Service/USDA
13
Who Has Time To Cook? How Family Resources Influence Food Preparation/ERR-40
Economic Research Service/USDA
Table 2
Estimation results: Determinants of the time low-income women spend preparing food
1
Working full-time Working part-time Not working
N=1,505 N=866 N=2,986
Variable Coefficient Z-value *** Coefficient Z-value *** Coefficient Z-value ***
Reported wage 0.09 0.36 -0.16 -1.12 ——
Other earnings 01 -1.10 0 27 0 -0.41
Partner 28.63 3.55 ** 34.06 2.26 ** 28.77 2.92 **
Partner’s household time 19 -1.79 * 25 -1.36 .01 .14
Extra adults—healthy -43.56 -1.20 25.47 .39 .41 .01
Extra adults—unhealthy -23.70 -1.42 * 73.72 2.51 ** 35.05 1.72 *
Extra adults’ household time .58 1.34 28 42 01 04
Number of kids 5.09 3.06 ** 11.18 4.21 ** 10.37 6.76 **
Young child 4.99 .98 1.74 .29 5.76 1.01
High school only .65 .12 -22.36 -2.96 ** -1.13 29
Some college -2.49 46 -24.17 -3.26 ** -0.97 19
Bachelor’s or associate degree -5.71 -1.07 -23.56 -2.48 ** -3.52 75
Graduate work or professional degree -2.23 35 -13.27 -1.14 -21.71 -3.63 **
Age 1.90 2.14 ** 1.97 1.98 ** 1.34 2.38 **
Age
2
02 -1.58 02 -1.45 01 -1.60
Black (non-Hispanic) .55 .13 .54 .09 .74 .17
Hispanic 12.68 2.04 ** -4.17 46 6.73 1.20
Asian (non-Hispanic) 25.24 1.94 ** 25.81 1.11 -1.67 12
Other race (non-Hispanic) -10.26 84 -12.99 96 -4.51 46
Foreign born 7.44 1.09 4.80 .53 20.00 3.10 **
Northeast -4.19 98 -2.93 38 -3.22 75
West -8.74 -2.28 ** -10.02 -1.87 * 1.66 .44
South -4.51 98 -6.73 -1.10 -3.73 87
Metropolitan -6.04 -1.30 -1.36 26 -5.06 -1.45
Weekend 3.54 1.06 -3.00 75 -7.59 -2.63 **
Holiday 4.45 .33 80.98 2.62 ** 7.50 .69
Left censored observations 466 208 667
Uncensored observations 1,039 658 2,319
Predicted minutes preparing food 46.38 56.11 70.59
Pseudo R
2
.08 .11 .11
**Parameter estimated to be significant at the 5 percent level.
*Parameter estimated to be significant at the 10 percent level.
†Predicted minutes are calculated from parameter estimates evaluated at the mean value for each employment, gender, and income group.
Note: The predicted excluded dummy variables are (1) less than high school education, (2) White non-Hispanic, (3) unmarried or unpartnered
status, (4) Midwest, (5) nonmetropolitan, (6) weekday, and (7) nonholiday.
1
Income-to-poverty ratio is equal to 1.3 or below.
Source: 2003-04 American Time Use Survey.
14
Who Has Time To Cook? How Family Resources Influence Food Preparation/ERR-40
Economic Research Service/USDA
Table 3
Estimation results: Determinants of the time all other women spend preparing food
1
Working full-time Working part-time Not working
N=5,844 N=1,938 N=4,070
Variable Coefficient Z-value *** Coefficient Z-value *** Coefficient Z-value ***
Reported wage -0.25 -3.26 ** -0.02 -0.36 ——
Other earnings 0 12 0 13 0.00 -0.37
Partner 21.41 6.27 ** 25.97 3.43 ** 25.55 3.37 **
Partner’s household time 13 -2.96 ** 18 -2.17 ** 02 28
Extra adults—healthy 18.52 1.12 -28.49 -1.11 13.16 .46
Extra adults—unhealthy 22.97 1.35 60.36 7.08 ** 9.17 1.10
Extra adults’ household time 22 -1.29 .33 1.23 11 38
Number of kids 5.45 6.47 ** 7.19 4.55 ** 11.32 7.18 **
Young child 6.14 2.65 ** 3.39 .87 4.57 1.15
High school only -8.25 -1.93 * 6.10 .87 .40 .09
Some college -7.50 -1.77 * 5.70 .77 .30 .06
Bachelor’s or associate degree -8.13 -1.93 * 3.78 .55 -2.11 47
Graduate work or professional degree -10.82 -2.61 ** -4.53 67 -3.23 53
Age 1.73 3.80 ** 1.19 1.72 * 2.06 3.75 **
Age
2
01 -2.52 ** 01 75 01 -2.65 **
Black (non-Hispanic) 93 36 -5.84 89 -1.32 28
Hispanic 1.22 .44 7.36 1.11 10.02 1.76 *
Asian (non-Hispanic) 11.27 2.01 ** 20.60 2.02 ** 8.61 1.08
Other race (non-Hispanic) 2.30 .40 -5.75 54 -6.77 -1.05
Foreign born 6.91 1.95 * 16.57 2.06 ** 21.23 4.16 **
Northeast 7.70 3.45 ** 3.33 .93 6.32 1.74 *
West 1.25 .74 -3.33 89 3.27 1.06
South 2.21 1.14 -1.16 31 2.52 .73
Metropolitan .09 .05 -5.64 -1.51 -6.19 -2.03 **
Weekend 10.49 7.55 ** 3.96 1.47 -12.74 -5.80 **
Holiday 21.23 1.84 * 6.63 .53 21.12 1.47
Left censored observations 1,870 464 819
Uncensored observations 3,974 1,474 3,251
Predicted minutes preparing food 38.05 53.11 71.08
Pseudo R
2
.08 .05 .07
**Parameter estimated to be significant at the 5 percent level.
*Parameter estimated to be significant at the 10 percent level.
†Predicted minutes are calculated from parameter estimates evaluated at the mean value for each income group.
Note: The predicted excluded dummy variables are (1) less than high school education, (2) White non-Hispanic, (3) couple-headed household,
and (4) Midwest.
1
Income-to-poverty ratio is above 1.3.
Source: 2003-04 American Time Use Survey.
15
Who Has Time To Cook? How Family Resources Influence Food Preparation/ERR-40
Economic Research Service/USDA
Table 4
Estimation results: Determinants of the time low-income men spend preparing food
1
Working full-time Working part-time Not working
N=1,594 N=273 N=1,270
Variable Coefficient Z-value *** Coefficient Z-value *** Coefficient Z-value ***
Reported wage 0.08 1.22 -0.25 -1.52 ——
Other earnings 0 91 .01 1.32 0.02 0.84
Partner 10.49 2.66 ** 23.49 1.92 * 6.77 .48
Partner’s household time 20 -3.90 ** 26 -1.75 * 20 -1.43
Extra adults—healthy -6.34 52 -12.61 47 -13.51 49
Extra adults—unhealthy -15.29 -1.25 -173.56 -5.79 ** -15.11 -1.34
Extra adults’ household time .08 .59 .11 .41 0 01
Number of kids .57 .73 .72 .33 6.57 2.21 **
Young child 6.71 2.09 ** 2.28 .32 -2.02 27
High school only 33 13 -3.81 77 10.45 2.23 **
Some college .12 .04 -6.14 -1.21 66 14
Bachelor’s or associate degree 3.30 1.14 -8.85 -1.73 * 15.92 1.92 *
Graduate work or professional degree 1.58 .43 -7.84 -1.55 3.99 .53
Age 21 51 .85 1.03 .81 1.35
Age
2
0 .81 01 83 01 92
Black (non-Hispanic) .13 .04 .60 .11 -2.17 52
Hispanic -2.37 84 -1.54 22 -11.12 -1.93 *
Asian (non-Hispanic) -1.74 43 12.49 .77 -23.26 -2.97 **
Other race (non-Hispanic) 1.98 .27 -4.76 52 -13.79 -1.89 *
Foreign born -1.12 39 -6.10 -1.03 17.11 1.88 *
Northeast 30 13 5.57 .91 -5.84 -1.10
West -2.21 -1.10 1.83 .36 .68 .16
South 10 04 -1.22 24 5.20 .99
Metropolitan -2.35 96 -3.82 78 3.94 1.08
Weekend 5.19 3.10 ** -7.34 -2.16 ** .40 .13
Holiday 1.93 .34 -8.38 90 -11.53 -1.29
Left censored observations 1,028 162 669
Uncensored observations 566 111 601
Predicted minutes preparing food 12.73 16.48 25.63
Pseudo R
2
.03 .03 .03
**Parameter estimated to be significant at the 5 percent level.
*Parameter estimated to be significant at the 10 percent level.
Note: The predicted excluded dummy variables are (1) less than high school education, (2) White non-Hispanic, (3) couple-headed household,
and (4) Midwest.
1
Income-to-poverty ratio is equal to 1.3 or below.
Source: 2003-04 American Time Use Survey.
16
Who Has Time To Cook? How Family Resources Influence Food Preparation/ERR-40
Economic Research Service/USDA
Table 5
Estimation results: Determinants of the time all other men spend preparing food
1
Working full-time Working part-time Not working
N=7,086 N=535 N=2,091
Variable Coefficient Z-value *** Coefficient Z-value *** Coefficient Z-value ***
Reported wage -0.02 -0.62 -0.10 -2.56 ** ——
Other earnings 0 -1.78 *0-1.40 0 1.37
Partner 9.89 5.01 ** 22.08 2.79 ** 26.10 3.21 **
Partner’s household time 17 -7.11 ** 23 -2.34 ** 36 -4.19 **
Extra adults—healthy -4.53 60 02 0 -13.54 45
Extra adults—unhealthy 1.16 .24 14.06 1.43 -23.31 -1.13
Extra adults’ household time .05 .56 .02 .05 .10 .31
Number of kids 2.00 4.16 ** 4.45 2.13 ** 5.26 2.24 **
Young child 2.94 2.43 ** -4.69 -1.11 .99 .16
High school only 1.07 .51 -5.14 97 17 04
Some college 1.45 .65 -5.09 -1.04 3.84 .79
Bachelor’s or associate degree 2.28 1.05 03 01 1.16 .25
Graduate work or professional degree 3.00 1.25 -5.37 -1.12 -2.26 45
Age .84 3.23 ** .94 1.55 .07 .11
Age
2
01 -2.79 ** 01 -1.12 0 .10
Black (non-Hispanic) -1.16 71 -5.39 -1.31 -4.79 -1.35
Hispanic -3.59 -2.27 ** -4.42 84 2.99 .34
Asian (non-Hispanic) -4.62 -1.90 * -8.51 -1.43 -13.37 -2.04 **
Other race (non-Hispanic) 5.14 1.22 5.93 .36 11.78 .93
Foreign born 2.01 1.08 .12 .02 7.46 .99
Northeast -1.01 90 -3.81 -1.08 2.74 .78
West -2.20 -2.14 ** .69 .20 2.84 .90
South 1.74 1.48 3.02 .79 -1.69 47
Metropolitan 1.20 1.18 7.35 2.55 ** 2.69 .96
Weekend 4.42 5.36 ** 1.19 .41 -3.21 -1.26
Holiday 9.12 2.01 ** -18.22 -6.65 ** 26.90 1.84 *
Left censored observations 4,072 298 1,060
Uncensored observations 3,014 237 1,031
Predicted minutes preparing food 16.82 15.33 30.45
Pseudo R
2
.03 .02 .03
**Parameter estimated to be significant at the 5 percent level.
*Parameter estimated to be significant at the 10 percent level.
†Predicted minutes are calculated from parameter estimates evaluated at the mean value for each income group.
Note: The predicted excluded dummy variables are (1) less than high school education, (2) White non-Hispanic, (3) couple-headed household,
and (4) Midwest.
1
Income-to-poverty ratio is above 1.3.
Source: 2003-04 American Time Use Survey.
Conclusions
The goal of this study was to estimate if and how time allocated to cooking
varies with both monetary and time resources. We find that how much time
one chooses to spend preparing food does appear to correlate systematically
with differences in variables meant to proxy family time resources. We find
that working women spend less time cooking than those who do not work
outside the home. Being married and having more children living in the
household are separately estimated to increase the amount of time a woman
spends in food preparation. Also, among low-income women, wages do not
significantly affect their food preparation decisions.
These results suggest that, among women, household time resources signifi-
cantly affect how much time is allocated to preparing food. In fact, we find
these effects are greater than household monetary resources: Separately,
both working full-time and being a single parent each have a greater impact
on time allocated to food preparation than an individual’s earnings or
household income.
Recent estimates of the time needed to follow TFP recipes range from
80 minutes a day to 16 hours a week. We find that many low-income
households—those with two adults or those headed by a single parent that
works less than 35 hours a week—allocate enough time for food preparation.
However, our estimates also say that low-income women who work full-time
spend just over 40 minutes per day and thus may have difficulties meeting
the plan’s implied time requirements. The food assistance they receive is
calculated according to a uniform TFP formula predicated on the assumption
of an average level of time availability. Because time spent in food prepara-
tion generally reduces the monetary cost of food and commercially prepared
food costs relatively more, the food stamp benefit level implied by a uniform
TFP is less likely to meet the needs of households that are low on both time
and money. Thus, a worthwhile endeavor would be to investigate whether a
greater number of healthful, convenient foods could be included in the TFP
market basket without requiring higher benefit levels.
17
Who Has Time To Cook? How Family Resources Influence Food Preparation/ERR-40
Economic Research Service/USDA
References
Barrett, Allison. 2006. Characteristics of Food Stamp Households: Fiscal
Year 2005, FSP-06-CHAR, U.S. Department of Agriculture, Food and
Nutrition Service, Office of Analysis, Nutrition, and Evaluation.
Becker, Gary. 1965. “A Theory of the Allocation of Time,” The Economics
Journal 75(September):493-517.
Blisard, W.N., J.N. Variyam, and J. Cromartie. 2003. Food Expenditures by
U.S. Households: Looking Ahead to 2020, AER-821, Economic Research
Service, U.S. Department of Agriculture, February.
Carlson, Andrea, Mark Lino, Shirley A. Gerrior, and P. Peter Basiotis.
2003. The Low-Cost, Moderate-Cost and Liberal Food Plans: 2003
Administrative Report, CNPP-13, Center for Nutrition Policy and Promotion,
U.S. Department of Agriculture.
Carlson, Andrea, Mark Lino, Weh-Yen Juan, Kenneth Hanson, and Peter
Basiotis. 2007. The Thrifty Food Plan, 2006 Administrative Report, CNPP-19,
Center for Nutrition Policy and Promotion, U.S. Department of Agriculture.
Davis, George C., and Wen You. 2006. “Preparing Food at Home: What is
the Labor Cost?” Selected paper presented at the American Agricultural
Economics Association Annual Meeting, Long Beach, CA, July 23-26, 2006.
Deaton, A. 1997. The Analysis of Household Surveys: A Microeconometric
Approach to Development Policy, Baltimore, MD: Johns Hopkins University
Press.
Harnack, L., M. Story, B. Martinson, D. Neumark-Sztainer, and J. Stang. 1998.
“Guess Who’s Cooking? The Role of Men in Meal Planning, Shopping and
Preparation in U.S. Families,” Journal of American Dietetic Association
98(September):995-1000.
Jenkins, S.P., and N.C. O’Leary. 1995. “Modeling Domestic Work Time”
Journal of Population Economics 8:265-79.
Polachek, Solomon W., and W. Stanley Siebert. 1993. The Economics of
Earnings, New York, NY: Cambridge University Press.
Rose, Diego. 2004. “Who Has Time to Cook? New Directions for Food and
Nutrition Policy Research on Household Meal Production,” Paper presented
at the Food and Eating Consequences of Time-Use Decisions: A Research
and Policy Conference, Washington, DC, July.
U.S. Bureau of Labor Statistics. 2006. “American Time Use Survey User’s
Guide: Understanding ATUS 2003, 2004, and 2005,” available at
/>U.S. Department of Agriculture, Center for Nutrition Policy and Promotion.
2000. Recipes and Tips for Healthy, Thrifty Meals Centers for Nutrition
Policy and Promotion, CNPP-11.
18
Who Has Time To Cook? How Family Resources Influence Food Preparation/ERR-40
Economic Research Service/USDA
U.S. Department of Agriculture, Center for Nutrition Policy and Promotion.
1999. The Thrifty Food Plan, 1999 Administrative Report, CNPP-7.
Vickery, Clair. 1977. “The Time-Poor: A New Look at Poverty,” The
Journal of Human Resources 12(1):27-48.
Zick, Cathleen D., Jane McCullough, and Ken R. Smith. 1996. “Trade-Offs
Between Purchased Services and Time in Single-Parent and Two-Parent
Families,” The Journal of Consumer Affairs 30(1):1-23.
19
Who Has Time To Cook? How Family Resources Influence Food Preparation/ERR-40
Economic Research Service/USDA