Progress toward Resuming the Issuance of Inflation-Indexed Bonds pot
Bạn đang xem bản rút gọn của tài liệu. Xem và tải ngay bản đầy đủ của tài liệu tại đây (2.24 MB, 8 trang )
WHAT’S NEW
Progress toward Resuming
the Issuance of Inflation-Indexed Bonds
Issuance of Inflation-Indexed Bonds (JGBi)
※1
, introduced in March 2004, have been
suspended since October 2008, as the Lehman Shock in the same year brought about a
significant decline of liquidity in the market through increased needs for cash of the financial
institutions as well as prolonged future deflation expectations.
In the JGB Issuance Plan for FY2012, the Ministry announced that "practical discussions
will be held with market participants on detailed product designs etc. toward resuming the
issuance of Inflation-Indexed Bonds". Since February 2012, the Working Group for
Resumption of Issuance of Inflation-Indexed Bonds has been held among the market
participants and the Ministry. After the series of discussions in the Working Group, the new
product designs for resumption have been formulated as follows.
○ New Product Designs of Inflation-Indexed Bonds
The principal will be guaranteed at maturity (deflation floor). In case where the indexation
coefficient falls below 1 at maturity, the Bonds will be redeemed at the face value. Other
features are the same as the existing JGBi
※2※3
.
※1 Inflation-Indexed Bonds are bonds whose principals fluctuate along with price of goods.
※2 The number of decimal points of indexation coefficient will remain to be 3 for the time-being. In response to the
request for smoothing the daily transitions of indexation coefficients, however, it will be expanded to 5 at the time
when a smooth shift from the current system is deemed to be possible along with the expected full operation of
the new BOJ-Net.
※3 The bidding method of the competitive price auctions for the reopened issuances will remain the same as the
current method for the time-being; bidders are supposed to tender with prices which are multiplied by the inflation
coefficients. In response to the requests that the bidding method should be compromised with the market practice
where the bidders tender with the prices without multiplying them by the inflation coefficients, however, it is
planned that a potential revision of the bidding method will be discussed soon after the expected full operation of
the new BOJ-Net.
○ Timing of Resumption
The discussions will be continued at the abovementioned Working Group, the Meeting of
JGB Market Special Participants and the Meeting of JGB Investors. The resumption of
issuance is then projected with appropriate conditions in place.
Ministry of Finance, Japan
www.mof.go.jp
Quarterly Newsletter of the Ministry of Finance, Japan
JAPANESE GOVERNMENT BONDS
April 2012
Contents
1
What’s New
2
JGB Primary
Market
3
The Auctions for
Enhanced-Liquidity
and JGB Buy-Back
4
JGB Secondary
Market
5
JGB Outstanding
6
Economic and
Financial Trends
Face Value × × Coupon Rate ×
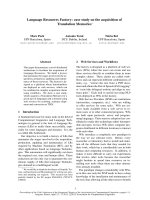
Future Product Designs
of Inflation-Indexed Bonds
1.Maturity:10years
The principal (face value) will be guaranteed
at maturity (from issue number 17)
5.Interest Payment: Biannual
(Hereinafter referred to as “CPI”)
1
2
CPI
at Interest Payment
CPI
at Issuance
6.Interest Amount:
Inflation-Adjusted Principal
3.Ref Index: Consumer Price Index
2.Features: Pre-fixed coupon rate (increments of 0.1%)
The principal fluctuates along with price of goods.
4.Deflation Floor:
Indexation Coefficient
(Composite index of all items excluding fresh foods)
Deflation Floor
(Conceptual Diagram)
①In case where the indexation coefficient is below 1, the inflation-
adjusted principal will fall below its face value.
②In case where the indexation coefficient at maturity is above 1,
the principal and the interest will be paid based on the inflation-
adjusted principal per se.
③In case where the indexation coefficient at maturity is below 1,
principal will be redeemed at its face value.
(Note) Deflation floor has no effect on interests during the maturing
p
eriod or at maturit
y
.
1
Indexation
Coefficient
②
①③
10 years
Issuance of the
Reconstruction Supporters’ Bonds
for Retail Investors
With a view to encouraging a wide range of public to fund expenditures for reconstruction from the Great East
Japan Earthquake, the Ministry started to offer the Reconstruction Bonds for Retail Investors (10-Year
Floating-Rate, 5-Year Fixed-Rate and 3-Year Fixed-Rate) since December 2011. In addition, the Ministry has
also started to offer the Reconstruction Supporters’ Bonds for Retail Investors with new product characteristics
since March 2012 (issued in April). The Reconstruction Supporters’ Bonds for Retail Investors, while based on
the basic product features of 10-Year Floating-Rate JGBs for Retail Investors, set a lower interest rate for the
first three years (0.05%, the lowest applicable rate in JGBs for Retail Investors) in order to call retail investors
who are willing to financially support reconstruction projects from the Great East Japan Earthquake.
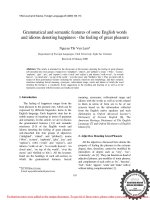
Newly issued Commemorative Coins for the Great East Japan Earthquake Reconstruction Projects will be
given to the bondholders of the Reconstruction Supporters’ Bonds for Retail Investors; a gold coin worth
10,000 yen per balance of the bond holding of 10 million yen, and a silver coin worth 1,000 yen per balance of
the bond holding of one million yen as of the interest payment date three years after the issue date of the bonds.
The Commemorative Coins for the Great East Japan Earthquake Reconstruction Projects are issued with our
wishes that the victims of the disaster would rest in peace and for the fast recoveries from the destruction in the
future. It is expected that the issuance of the coins will give momentum to the efforts toward the renaissance of
the country through recoveries based on mutual supports and solidarities of the people.
The following are the features of the Coins which will be given to the bondholders of the Reconstruction
Supporters’ Bonds for Retail Investors (issue number 801), offered in March 2012. The designs of the coins
vary depending on the issues (months of issuances). Each issue of the Reconstruction Supporters’ Bonds for
Retail Investors is associated with unique designs for the gold and silver coins, respectively.
Offering of the next issue of the bonds (issue number 802) is scheduled in June 2012.
Denomination
10,000 yen
(
Images are one and a half times actual size
)
1,000 yen
(Images are actual size)
Individual
side
Reconstruction special areas
and pigeons
Big fishing boat and ears of rice
Common
side
Solitary pine tree of a Miracle
and pigeons
Solitary pine tree of a Miracle
and pigeons
Material Pure gold Pure silver
Weight 15.6g(1/2 troy ounce) 31.1g(1 troy ounce)
Diameter 26.0mm 40.0mm
The Design (image) of the Commemorative Coins
for the Great East Japan Earthquake Reconstruction Pro
j
ects
(
First series
)
-2-
Auction Results
(Bonds)
Auction Date Type of Security
Issue
Number
Maturity Date
Nominal
Coupon
Amounts of
Competitive
Bids
(billion yen)
Amounts of
Bids
Accepted
(billion yen)
Yield at the
Lowest
Accepted
Price
Yield at the
Average
Price
Amounts of
Non-Competitive
Bids Tendered
/Accepted
(billion yen
)
Amounts of Bids
Accepted at the Non-
price-competitive
Auction
Ⅰ
(billion yen
)
Amounts of Bids
Accepted at the Non-
price-competitive
Auction
Ⅱ
(billion yen
)
1/12/2012 10-year 320 12/20/2021 1.0% 5,999.3 2,005.5 0.966% 0.965% 5.931 187.6 327.5
1/17/2012 30-year 35 9/20/2041 2.0% 2,258.3 641.7 1.918% 1.915% - 57.4 13.0
1/19/2012 5-year 102 12/20/2016 0.3% 9,938.9 2,276.8 0.333% 0.333% 2.996 219.6 322.0
1/26/2012 20-year 133 12/20/2031 1.8% 3,178.2 1,005.0 1.745% 1.744% - 93.8 3.4
1/31/2012 2-year 313 2/15/2014 0.1% 13,460.5 2,516.9 0.130% 0.128% 2.399 179.6 271.6
2/ 2/2012 10-year 320 12/20/2021 1.0% 7,439.2 2,000.1 0.964% 0.963% 4.760 194.3 328.2
2/ 9/2012 40-year 4 3/20/2051 2.2% 1,443.9 399.5 2.140% - - - 36.4
2/16/2012 5-year 102 12/20/2016 0.3% 8,924.5 2,296.0 0.297% 0.295% 1.554 201.7 102.9
2/23/2012 20-year 133 12/20/2031 1.8% 2,791.8 1,002.3 1.759% 1.755% - 96.6 0.0
2/28/2012 2-year 314 3/15/2014 0.1% 12,882.6 2,503.9 0.112% 0.111% 1.952 193.2 0.0
3/ 1/2012 10-year 321 3/20/2022 1.0% 6,505.3 1,996.6 0.974% 0.973% 8.912 193.5 230.9
3/ 6/2012 30-year 36 3/20/2042 2.0% 2,544.9 641.6 1.968% 1.964% - 57.4 86.7
3/ 8/2012 5-year 103 3/20/2017 0.3% 8,595.8 2,300.8 0.295% 0.293% 2.584 195.7 0.0
3/15/2012 20-year 134 3/20/2032 1.8% 3,256.4 999.7 1.803% 1.795% - 99.5 27.1
3/29/2012 2-year 315 4/15/2014 0.1% 14,088.5 2,508.7 0.117% 0.117% 1.230 189.1 117.2
Auction Results
(Treasury Discount Bills)
Auction Date Type of Security
Issue
Number
Maturity Date
Amounts of
Competitive Bids
(billion yen)
Amounts of
Bids Accepted
(billion yen)
Yield at the
Lowest
Accepted
Price
Yield at the
Average
Price
Amounts of Bids
Accepted at the Non-
price-competitive
Auction Ⅰ
(billion yen)
1/6/2012 3-month
248
4/9/2012
35,510.82 5,510.41 0.0995% 0.0966% 489.50
1/10/2012 6-month
249
7/10/2012
21,965.00 3,239.40 0.1020% 0.1020% 260.50
1/11/2012 3-month
250
4/16/2012
32,110.00 5,511.35 0.1002% 0.1002% 448.50
1/17/2012 1-year
251
1/21/2013
14,330.20 2,321.46 0.1045% 0.1035% 178.45
1/18/2012 3-month
252
4/23/2012
56,742.50 5,557.43 0.1002% 0.0994% 472.40
1/20/2012 Approx. 2-month
253
3/23/2012
31,651.10 2,324.46 0.0975% 0.0956% 175.45
1/25/2012 3-month
254
4/27/2012
44,926.00 5,649.07 0.1016% 0.1012% 370.78
2/1/2012 3-month
255
5/7/2012
51,965.70 5,568.16 0.1023% 0.1007% 431.63
2/7/2012 6-month
256
8/10/2012
35,143.60 3,227.01 0.1023% 0.1003% 272.80
2/8/2012 3-month
257
5/14/2012
74,912.00 5,510.05 0.1023% 0.1015% 459.80
2/10/2012 Approx. 2-month
258
4/9/2012
28,254.50 2,306.11 0.1014% 0.1007% 193.80
2/13/2012 1-year
259
2/20/2013
11,030.40 2,294.09 0.1048% 0.1038% 205.85
2/15/2012 3-month
260
5/21/2012
41,408.30 5,451.36 0.1023% 0.1015% 508.54
2/22/2012 3-month
261
5/28/2012
47,796.30 5,545.88 0.1043% 0.1035% 473.90
2/29/2012 3-month
262
6/4/2012
58,923.20 5,573.15 0.1043% 0.1039% 426.70
3/6/2012 6-month
263
9/10/2012
34,336.60 3,217.80 0.1026% 0.1026% 282.10
3/7/2012 3-month
264
6/11/2012
73,424.80 5,556.28 0.1043% 0.1027% 483.54
3/14/2012 3-month
265
6/18/2012
45,700.70 5,595.05 0.1023% 0.1023% 404.87
3/15/2012 1-year
266
3/21/2013
10,401.40 2,345.77 0.1041% 0.1031% 154.10
3/19/2012 Approx. 2-month
267
5/25/2012
26,419.40 2,296.40 0.1014% 0.1008% 203.50
3/21/2012 3-month
268
6/25/2012
46,414.70 5,499.18 0.1023% 0.1019% 490.70
3/23/2012 3-month
269
7/2/2012
39,200.30 5,517.03 0.1018% 0.1018% 512.90
Auction Calendar for Apr. – Jun. 2012
Auction Date Issue Auction Date Issue Auction Date Issue Auction Date Issue
4/ 3 (Tue) 10-year 4/24 (Tue) T-Bills(3-month) 5/17 (Thu) 5-year 6/ 7 (Thu) 30-year
4/ 4 (Wed) T-Bills(3-month) 4/24 (Tue) 20-year 5/22 (Tue) T-Bills(Approx.2-month) 6/12 (Tue) 5-year
4/ 5 (Thu) T-Bills(6-month) 4/26 (Thu) T-Bills(3-month) 5/22 (Tue)
Auction for Enhanced-liquidity
6/13 (Wed) T-Bills(Approx.2-month)
4/ 5 (Thu)
Auction for Enhanced-liquidity
4/26 (Thu) 2-year 5/24 (Thu) T-Bills(3-month) 6/14 (Thu) T-Bills(3-month)
4/ 9 (Mon) T-Bills(Approx.2-month) 5/ 8 (Tue) 10-year 5/24 (Thu) 20-year 6/14 (Thu) 20-year
4/11 (Wed) T-Bills(3-month) 5/ 9 (Wed) T-Bills(6-month) 5/29 (Tue) 2-year 6/18 (Mon) T-Bills(1-year)
4/12 (Thu) 30-year 5/10 (Thu) T-Bills(3-month) 5/31 (Thu) T-Bills(3-month) 6/21 (Thu) T-Bills(3-month)
4/17 (Tue) T-Bills(1-year) 5/10 (Thu)
Auction for Enhanced-liquidity
6/ 1 (Fr i)
Auction for Enhanced-liquidity
6/21 (Thu)
Auction for Enhanced-liquidity
4/17 (Tue) 5-year 5/15 (Tue) 40-year 6/ 5 (Tue) 10-year 6/26 (Tue) 2-year
4/18 (Wed) T-Bills(3-month) 5/16 (Wed) T-Bills(1-year) 6/ 6 (Wed) T-Bills(6-month) 6/28 (Thu) T-Bills(3-month)
4/19 (Thu)
Auction for Enhanced-liquidity
5/17 (Thu) T-Bills(3-month) 6/ 7 (Thu) T-Bills(3-month)
Total Bidding Amount of JGBs (Calculated by Duration) Top 10
(Oct. 2011 ~ Mar. 2012)
1 Mitsubishi UFJ Morgan Stanley Securities Co., Ltd. 6 Daiwa Securities Co., Ltd.
2 Nomura Securities Co., Ltd. 7 Barclays Capital Japan Limited
3 Goldman Sachs Japan Co., Ltd. 8 Deutsche Securities Inc.
4 The Bank of Tokyo-Mitsubishi UFJ, Ltd. 9 RBS Securities Japan Limited
5 Mizuho Securities Co., Ltd. 10 JPMorgan Securities Japan Co., Ltd.
2 JGB PRIMARY MARKET
Note 1: The above calendar may be changed or added in light of changes in circumstances. In such cases, it will be announced in advance.
Note 2: Each issue amount will be announced about one week prior to each auction date.
Note 3: The issue date of the Treasury Discount Bills auctioned on April 9, 2012 is April 13, 2012, and the maturity date is June 4,2012.
Note 4: The issue date of the Treasury Discount Bills auctioned on May 22, 2012 is May 25, 2012, and the maturity date is July 25,2012.
Note 5: The issue date of the Treasury Discount Bills auctioned on June 13, 2012 is June 15, 2012, and the maturity date is August 2,2012.
-3-
Issues Re-opened through the Recent Auctions for Enhanced-Liquidity
Issue Numbers
Auction Date Securities
Re-opened Amounts(billion yen. face value)
#287 #290 #291 #292 #293 #294 #295 #302 #311 #312 #61
3/27/ 2012
10-year
20-year
0.4 9.7 32.5 0.5 8.2 5.0 61.3 0.4 170.5 10.0 0.5
#101 #102 #111 #11 6 #122 #126 #128 #129 #4 #5 #7 #8 #15 #16 #17 #18 #20 #22 #26
3/22/ 2012
20-year
30-year
5.0
6.9 10.0 12.0 10.3 24.5 26.5 20.0 8.0 0.9 3.0 7.0 0.6 114.2 0.2 30.7 4.0 10.7 4.9
#290 #291 #295 #300 #308 #311 #316 #55 #57 #58 #60 #61 #68 #70 #74 #87 #88
2/21/ 2012
10-year
20-year
88.2 7.3 1.1 10.0 26.0 90.1 4.0 2.9 15.1 0.1 9.7 15.2 4.9 0.2 2.0 21.5 0.1
#125 #4 #7 #8 #9 #11 #13 #16 #17 #18 #19 #20 #21 #22 #24 #25 #26 #31 #32
2/7/ 2012
20-year
30-year
5.0 7.7 29.1 26.5
1.0 1.0 11.1 0.6 20.0 78.0 0.6 9.2 16.5 62.5 6.0 12.1 1.3 1.0 10.3
#287 #291 #300 #302 #306 #316 #55 #58 #62 #67 #76 #82 #87 #91 #94
1/23/ 2012
10-year
20-year
82.8 7.6 93.8 14.3 2.2 62.7 11.7 2.0 0.5 4.6 1.0 0.5 12.9 2.0 0.5
#125 #7 #8 #11 #13 #14 #15 #17 #18 #20 #21 #26 #32
1/6/ 2012
20-year
30-year
18.7 13.0 25.0 0.5 51.4 81.9 3.0 29.5 16.0 5.5 38.9 15.0 1.0
Note:Red shows 10-year, black shows 20-year and blue shows 30-year coupon-bearing bonds.
Target Zones of the Auction for Enhanced-Liquidity for the First Quarter of FY 2012
JGB Buy-Back Results
Remaining Years to Maturity ~1yr 1yr~5yr 5yr~10yr 10yr~20yr 20yr~
Coupon
STRIPS
Total
March 2012 - 439.3 260.3 1.0 - - 700.6
February 2012 - 35.0 135.5 - - - 170.5
January 2012 - 56.1 206.9 30.7 - - 293.7
Note:Figures include JGB Buy-back from the Bank of Japan.
3
THE AUCTIONS FOR ENHANCED-LIQUIDITY AND JGB BUY-BACK
(billion yen)
0.0
500.0
1,000.0
1,500.0
2,000.0
2,500.0
~1Y 1Y~5Y 5Y~10Y 10Y~20Y 20Y~
Jan. to Mar. 2012
Oct. to Dec. 2011
Jul. to Sep. 2011
Apr. to Jun. 2011
624.4
(
years to maturity
)
(billion
876.4
2,359.6
185.3
601.0
121.2
161.3
63.5
530.4
36.9
31.7
60.3
56.4
531.5
602.7
-4-
Note1: JL shows 20‐year JGBs. JX shows 30‐year JGBs. Outstanding amount is as of the end of March 2012.
Note2: Based on the result of the consultation to the JGB Market Special Participants which takes place at the time of each auction, 60 issues from each of the above 2 groups are selected as targeted issues
(excluding JL56,57 from ① and JX7 from ② for the auctions in June,respectively).
0
500
1,000
1,500
2,000
2,500
3,000
3,500
4,000
4,500
5,000
5,500
6,000
6,500
7,000
7,500
288
JL36
JL37
289
290
291
292
JL38
JL39
293
294
295
296
JL40
297
298
299
300
JL41
JL42
301
302
303
304
JL43
305
306
307
JL44
JL45
308
309
JL46
310
311
JL47
312
JL48
313
314
JL49
JL50
315
316
JL51
317
318
JL52
JL56
JL57
JL58
JL59
JL60
JL61
JL62
JL63
JL64
JL65
JL66
JL67
JL68
JL69
JL70
JL71
JL72
JL73
JL74
JL75
JL76
JL77
JL78
JL79
JL80
JL81
JL82
JL83
JL84
JL85
JL86
JL87
JL88
JL89
JL90
JL91
JL92
JL93
JL94
JL95
JL96
JL97
JL98
JL99
(billion yen)
Outstanding amount in the market (excluding amount issued
by the Auction for Enhanced-Liquidity)
Amount issued by the Auction for Enhanced-Liquidity
0
500
1,000
1,500
2,000
2,500
3,000
3,500
JL100
JL101
JL102
JL103
JL104
JL105
JL106
JL107
JL108
JL109
JL110
JL111
JL112
JL113
JX01
JL114
JL115
JX02
JL116
JL117
JX03
JL118
JL119
JL120
JL121
JL122
JX04
JL123
JL124
JL125
JL126
JL127
JX05
JL128
JL129
JL130
JL131
JX06
JX07
JX08
JX09
JX10
JX11
JX12
JX13
JX14
JX15
JX16
JX17
JX18
JX19
JX20
JX21
JX22
JX23
JX24
JX25
JX26
JX27
JX28
JX29
JX30
JX31
JX32
JX33
JX34
JX35
(billion yen)
Outstanding amount in the market (excluding amount issued
by the Auction for Enhanced-Liquidity)
Amount issued by the Auction for Enhanced-Liquidity
5.5
9.5
12
15.5
29.5
19.5
15.5
(Remaining maturities)
(Remaining maturities)
②Remaining maturity : approx.15‐~29‐year
①Remaining maturity : approx.5‐~15‐year
4 JGB SECONDARY MARKET
JGB Yield Curves
Source: Japan Bond Trading Co.
Yields of JGB
Long - Term Interest Rates (10Yr)
Source: Japan Bond Trading Co.
Long - Short Interest Spreads (30Yr - 10Yr)
Source: Bloomberg
Source: Bloomberg
(years to maturity)
-5-
0.0
0.5
1.0
1.5
2.0
2.5
2011/12/30
2012/3/30
40353020
25
151050
(%)
-1.0
0.0
1.0
2.0
3.0
4.0
5.0
6.0
United Kingdom Germany
United States Japan
(%)
<2008> <2009>
<2010> <2011>
<2012>
-1.0
-0.5
0.0
0.5
1.0
1.5
2.0
United Kingdom Germany
United States Japan
(%)
<2008> <2009> <2010> <2011> <2012>
0.0
0.5
1.0
1.5
2.0
2.5
3.0
(
%
)
40-year bond 10-year bond
30-year bond 5-year bond
20-year bond 2-year bond
<2008>
<2009>
<2010>
<2011>
<2012>
Break-Even Inflation Rates
Source: Japan; Japan Bond Trading Co., U.S., U.K.; Bloomberg
Short-Term Interest Rates of Treasury Discount Bills
Short-Term Interest Rates
Note: The Interest rates of FBs (13-weeks, 6-months) and TBs (6-months, 1-year) are used up till Jan. 2009.
Source: Japan Bond Trading Co.
Source: Bank of Japan, Japan Bankers Association
JGB Over-the-Counter Trading Volume (TOKYO)
Note: In February 2009, FBs (approx 2-month, 13-weeks, 6-months) and TBs (6-months, 1-year) are integrated into the Treasury Discount Bills.
Source: Japan Securities Dealers Association
-6-
0.00
0.10
0.20
0.30
0.40
0.50
0.60
0.70
0.80
0.90
Treasury Discount Bills (3-month)
Treasury Discount Bills (6-month)
Treasury Discount Bills (1-year)
(%)
2012/3/30 Recent Indicative Price
Treasury Discount Bills (3-month) 0.100% Treasury Discount Bills (6-month) 0.100%
Treasury Discount Bills (1-year) 0.100%
<2010>
<2012>
<2008> <2009> <2011>
-0.05
0.05
0.15
0.25
0.35
0.45
0.55
0.65
0.75
0.85
0.95
Call Rate (Uncollateralized Overnight)
TIBOR 3-months (Euro-Yen)
Basic Loan Rate
<2012>
<2008>
<2009> <2010> <2011>
(%)
-3.5
-3.0
-2.5
-2.0
-1.5
-1.0
-0.5
0.0
0.5
1.0
1.5
2.0
2.5
3.0
3.5
4.0
4.5
5.0
10-yr BEI (Japan) 10-yr BEI (U.K.)
10-yr BEI (U.S.A.)
(%)
<2008>
<2009>
<2010>
<2011>
<2012>
0
100
200
300
400
500
600
700
800
900
1,000
1,100
1,200
Treasury Discount Bills
Financing Bills
Treasury Bills
Medium Term Bonds
Long Term Bonds
<2008>
<2009>
<2010> <2011>
(trillion yen)
<2012>
5 JGB OUTSTANDING
Note: Outs
t
anding STRIPS means outstanding amount of principal o
f
strippable JGBs held in stripped form.
Source: Ministry of Finance
General Bonds Issuance Amount and Outstanding
Time-to-Maturity Structure of Outstanding JGB (December 2011)
Source: Ministry of Finance
Outstandin
g
STRIPS
Note 1: Issuance Amount: revenue basis, F
Y
2000-2010: actual, FY2011: fourth supplementary budget, FY2012: initial budget.
Note 2: Outstanding: nominal basis, FY2000-2010: actual, FY2011-FY2012: estimates.
Source: Ministr
y
of Finance
Breakdown by JGB Holders (December 2011,QE)
Note1 : "JGB" includes FILP Bonds, does not include
T
-Bills.
Note2 : "Banks, etc" includes Japan Post Bank, "Securities investment trust"
and "Securities Companies"
Note3 : "Life and Nonlife insurance" includes Japan Post Insurance.
Source: Bank of Japan
Holding of JGBs by Foreign Investors JGB Holding by Retail Investors
Source: Bank of Japan
Note: Outstanding "JGBs
f
or retail investors" at March-12 is calculated to
〔
aggregate
issues of ¥36.3 trillion〕-〔redemption before maturity of ¥8.5 trillion〕-〔aggregate
redemption money of ¥4.9 trillion〕.
Other figures based on Bank of Japan “Flow of Funds” statistics.
Source: Ministr
y
of Finance, Bank of Ja
p
an
(trillion yen)
-7-
708.9
421.1
636.3
594.0
545.9
675.5
541.5
531.7
526.9
499.0
457.0
392.4
367.6
142.4
127.1
124.6
135.6
136.8
119.9
110.3
104.6
89.3
86.3
143.1
165.0
159.2
0
25
50
75
100
125
150
175
00 01 02 03 04 05 06 07 08 09 10 11 12
(FY)
100
200
300
400
500
600
700
800
Outstanding (right-hand scale)
Issuance Amount (left-hand scale)
(trillion yen) (trillion yen)
16.7
20.0
19.2
23.6
25.6
26.8
40.9
38.4
34.4
31.0
50.9
49.0
43.2
36.6
35.8
37.6
33.3
32.4
30.2
31.2
30.0
34.9
34.4
37.1
41.4
37.8
43.1
47.7
47.4
47.6
53.9
44.8
43.6
3.0%
3.5%
3.3%
3.9%
4.1%
4.2%
4.9%
4.6%
4.6%
4.5%
5.3%
5.1%
5.5%
6.1%
5.7%
6.4%
7.0%
6.8%
7.0%
5.7%
4.6%
4.7%
5.0%
6.5%
6.7%
5.8%
4.9%
5.2%
5.1%
7.9%
6.4%
6.4%
6.1%
0.0%
1.0%
2.0%
3.0%
4.0%
5.0%
6.0%
7.0%
8.0%
Dec-03 Sep-04 Jun-05 Mar-06 Dec-06 Sep-07 Jun-08 Mar-09 Dec-09 Sep-10 Jun-11
0.0
10.0
20.0
30.0
40.0
50.0
60.0
(trillion yen)
1.29
1.25
1.23
2.30
5.38
4.20
2.97
3.42
2.53
2.67
1.43
4.70
0.73
2.14
8.58
7.03
57.40
9.23
7.49
28.48
72.84
30.89
22.65
13.53
14.26
32.91
111.94
37.18
9.19
57.72
32.08
7.05
9.54
10.51
45.65
0
10
20
30
40
50
60
70
80
90
100
110
120
11 12 13 14 15 16 17 18 19 20 21 22 23 24 25 26 27 28 29 30 31 32 33 34 35 36 37 38 39 40 41 47484950
(FY)
(trillion yen
)
Treasury Bills
2-yr bonds
JGBs for retail investors (3-yr-Fixed-rate)
JGBs for retail investors (5-yr-Fixed-rate)
5-yr bonds
Inflation-Indexed bonds
JGBs for retail investors (Floating-rate)
10-yr bonds
15-yr-floating-rate bonds
20-yr bonds
30-yr bonds
40-yr bonds
Average remaining years to maturity: 6 years and 11 months
0.0
100.0
200.0
300.0
400.0
Jun-09 Sep-09 Dec-09 Mar-10 Jun-10 Sep-10 Dec-10 Mar-11 Jun-11 Sep-11 Dec-11 Mar-12
STRIPS(2-year bonds) STRIPS(5-year bonds)
STRIPS(10-year bonds) STRIPS(20-year bonds)
STRIPS(30-year bonds) STRIPS(40-year bonds)
(billion yen)
3.3
4.8
6.5
8.4
10.1
12.4
14.0
15.3
17.1
20.7
22.0
23.2
24.1
25.8
26.5
26.7
26.8
27.4
27.5
27.6
27.5
27.7
27.7
27.2
27.3
27.4
27.2
25.8
25.2
24.1
23.4
22.9
12.7
12.5
12.4
13.4
14.6
15.9
18.0
20.1
21.8
24.5
25.7
26.9
28.0
29.1
31.4
32.3
33.4
33.6
35.4
36.0
36.3
35.3
35.8
36.7
36.0
35.6
35.5
35.0
34.4 34.4
34.1
33.0
31.1
30.4
29.5
28.5
2.0
18.7
0.4
0.7 1.0
4.3%
4.1%
3.9%
3.8%
4.5%
4.7%
4.9%
5.0%
5.2%
5.2%
5.3%
5.3%
5.3%
5.2%
5.2%
5.2%
5.3%
4.8%
3.4%
3.2%
4.0%
3.7%
3.9%
2.4%
2.3%
2.4%
4.2%
4.7%
4.4%
2.3%
2.6%
2.8%
3.0%
5.0%
5.1%
5.3%
0
5
10
15
20
25
30
35
40
45
Mar - 03 Mar - 04 Mar - 05 Mar - 06 Mar - 07 Mar - 08 Mar - 09 Mar - 10 Mar - 11 Mar - 12
-0.5%
0.5%
1.5%
2.5%
3.5%
4.5%
5.5%
Total JGBs held by retail investors (left)
Outstanding "JGBs for retail investors" (left)
Ratio of JGBs held by retail investors
(right)
(trillion yen)
Households
28.5
3.8%
Foreigners
50.9
6.7%
Pension Funds
28.5
3.8%
Public Pensions
69.7
9.2%
Life and Nonlife
Insurance
169.1
22.4%
Banks, etc.
312.7
41.4%
Fiscal Loan Fund
0.8
0.1%
BOJ
67.6
9.0%
Others
25.8
3.4%
General Government
(ex Public Pensions)
1.8
0.2%
Debt Management Policy Division, Financial Bureau, Ministry of Finance
3-1-1 Kasumigaseki, Chiyoda-ku, Tokyo 100-8940 Japan
Phone: 81-3-3581-4111
Web: www.mof.go.jp
○ This printed matter was prepared using the paper that satisfies the judgment criteria of the basic policy under the Law Concerning the Promotion of Procurement of
Eco-Friendly Goods and Services by the State and Other Entities (Law on Promoting Green Purchasing).
○ Indication of the recyclability : Recyclable to paper
This printed matter was prepared using only the material fit for recycling to printing papers(Rank A) according to the judgment criteria“printing”of the basic policy under the
Green Purchasing Law
FY2010
FY2007 FY2008 FY2009 FY2010
Apr Jun. Jul Sep. Oct Dec.
Real GDP(chained 2005)
1.8 -3.7 -2.1 3.1 -0.3 1.7 -0.2
Domestic Demand
(0.6) (-2.7) (-2.2) (2.4) (0.7) (1.0) (0.5)
Private Consumption
0.8 -2.0 1.2 1.5 0.3 1.0 0.4
Residential Investment
-14.5 -1.1 -21.0 2.3 -2.4 4.5 -0.7
Non-Resi. Investment
3.0 -7.7 -12.0 3.5 -0.1 0.3 4.8
Public Investment
-4.9 -6.7 11.5 -6.8 6.6 -1.6 -2.2
Net Exports
(1.2) (-1.1) (0.2) (0.8) (-1.0) (0.8) (-0.6)
Index of Industrial Production (2005 av.=100)
2.7 -12.7 -8.8 8.9 -6.8 -2.1 -2.8
Unemployment Rate
3.8 4.1 5.2 5.0 4.6 4.4 4.5
(%)
6 ECONOMIC AND FINANCIAL TRENDS
We will send a notice to you by e-mail when new information is updated on
our website. For use of this service, please visit our website and register.
(
Note: Percent changes from previous period (quarterly figures are seasonally adjusted). The figures in( )indicate the contribution to change in GDP.
Source: Cabinet Office; Ministry of Internal Affairs and Communications; Ministry of Economy, Trade and Industry
Source: Cabinet Office, Ministry of Internal Affairs and Communications,
Bank of Japan
Source: Ministry of Finance
Note: For Japan and the U.S.A., where pension systems are based on a
Modified Funded System, the figures exclude social security funds,
which are regarded as future liabilities in real terms
Source: OECD “Economic Outlook No. 90”
Sou
r
ce: OECD “Economic Outlook No. 90”
Prices
Debt Securities Investment in Japan
by Non-Residents
General Government Financial Balances (SNA Basis)
General Government Gross Debts (SNA Basis)
Economic Indicators
-8-
-14.0
-12.0
-10.0
-8.0
-6.0
-4.0
-2.0
0.0
2.0
4.0
6.0
00 01 02 03 04 05 06 07 08 09 10 11 12 13
Japan U.S.A. U.K.
Germany France Italy
Canada
(CY)
(%)
(As a percentage of GDP
)
30
50
70
90
110
130
150
170
190
210
230
00 01 02 03 04 05 06 07 08 09 10 11 12 13
Japan U.S.A. U.K
Germany France Italy
Canada
(
CY
)
(%)
(As a percentage of GDP)
-9.0
-7.0
-5.0
-3.0
-1.0
1.0
3.0
5.0
7.0
9.0
(%)
CGPI(Corporate Goods Price Index)
CPI (Nationwide, excluding fresh food, including energy prices)
GDP Deflator
Change from the previous year
0.6%
0.1%
-1.8%
<2010>
<2011>
<2007> <2008> <2009>
-6
-5
-4
-3
-2
-1
0
1
2
3
4
5
6
7
(trillion yen)
Money Market Instrument Net
Bonds and Notes Net
<2007> <2008> <2009> <2010>
<2011>