When Bonds Fall: How Risky Are Bonds if Interest Rates Rise? pptx
Bạn đang xem bản rút gọn của tài liệu. Xem và tải ngay bản đầy đủ của tài liệu tại đây (1.28 MB, 12 trang )
The information contained herein is intended for Qualied Eligible Clients as dened in CFTC Regulation 4.7. This document is not a solicitation
for investment. Such investment is only oered on the basis of information and representations made in the appropriate oering documentation.
Past performance is not necessarily indicative of future results. No representation is being made that any investor will or is likely to achieve similar
results. Futures, forward and option trading is speculative, involves substantial risk and is not suitable for all investors.
Copyright © 2012 Welton Investment Corporation® All rights reserved. 1
When Bonds Fall: How Risky Are Bonds if Interest Rates Rise?
Thirty-one years ago the yield on corporate Aaa bonds reached its 100-year peak of 15.5%. That date was in
September, 1981, and rates for corporate bonds and U.S. Treasuries have fallen ever since, with both rates
resting near 100-year lows today. This trend can’t last forever of course, and today many bond investors are
grappling with the notion of a rising interest rate environment. And because bondholders lose when rates
rise, many are now wondering, how risky are bonds if interest rates rise? We’ll examine rate and bond price
behavior over the last 90 years to look for lessons from the past.
1
Bond returns and corresponding drawdowns are calculated from published interest rates for the Moody’s Seasoned Aaa
Corporate Bond Yield (Jan. 1919 – June 2012). Source: Moody’s Corporation.
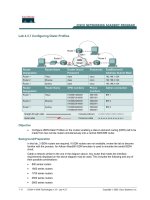
The following chart
plots eight periods
in which Aaa
corporate bond
rates rose +1.5% or
more and the
ensuing calculated
losses to
bondholders.
Despite a three-
decade streak of
generally falling
rates, it reminds us
that rates can, and
do, rise, and that
these periods can
produce sharp
losses for years,
even for investors
in the highest
quality Aaa
corporate credits.
Figure 1: Bondholder Losses When Aaa Corporate Bond
Rates Rose By +1.5% or More
1
Past performance is not necessarily indicative of future results.
(25%)
(20%)
(15%)
(10%)
(5%)
0%
5%
10%
15%
20%
1920 1930 1940 1950 1960 1970 1980 1990 2000 2010
+1.8%
+4.3%
+2.2%
+7.6%
+2.1%
+2.2%
+2.0%
+1.8%
(15%)
(24%)
(11%)
(24%)
(7%)
(14%)
(10%)
(8%)
Rate rises ≥ +1.5%
Aaa Interest RateBondholder Drawdowns
The information contained herein is intended for Qualied Eligible Clients as dened in CFTC Regulation 4.7. This document is not a solicitation
for investment. Such investment is only oered on the basis of information and representations made in the appropriate oering documentation.
Past performance is not necessarily indicative of future results. No representation is being made that any investor will or is likely to achieve similar
results. Futures, forward and option trading is speculative, involves substantial risk and is not suitable for all investors.
2 Copyright © 2012 Welton Investment Corporation® All rights reserved.
The Inverse Relationship between Interest Rates and Bond Prices
Bond coupon rates are typically set at, or close to, the prevailing market interest rates when issued. When
interest rates rise, the value of these preexisting bonds goes down, and when interest rates fall the value of
these preexisting bonds goes up. In other words, rates and bond values are inversely related – but why?
When rates rise, investors’ preexisting bonds now offer a lower coupon rate than that available in the market
for equivalent grade bonds. This imbalance exerts downward pressure on the market price for preexisting
bonds in order to compensate prospective buyers for earning below-market coupon rates. And given today’s
extraordinarily low rate environment, current bondholders are concerned they’ll be left holding depreciating
assets when rates reverse course. The biggest questions for most are how much might I lose? and for how long?
Lessons from the Past 90+ Years
Frequency and Magnitude of Bondholder Losses
As indicated by the shaded blue areas in Figure 1, since 1919 investors have experienced eight different
corporate Aaa rate increase periods of +1.5% or greater, trough-to-peak. From the corresponding drawdown
calculations, bond investors would have experienced peak losses between -7% to -24% over each of the eight
periods identified. For example, periods like the 1950s were marked by a slow and steady rate rise, with Aaa
losses reaching -15.3%. Other periods like the 1970s/early 1980s experienced sharp rate increases and produced
deep acute bondholder losses in the -24% range. And although the last 30 years is characterized as one of
generally falling rates, this descent also included four Aaa rate spikes of +1.8% or more since 1980.
Bondholder Losses from a Risk/Reward Perspective
The magnitude of the findings above may surprise some. While investors recognize the capital loss risk
associated with high yield bonds, developing market sovereign debt, or securitized debt (for example, large
losses in 2008 will stand out for many), the interest rate risk of even high quality bonds is clearly not trivial,
particularly given fixed income’s accepted place within investors’ allocation frameworks as a “safe”
investment.
And this leads us to a second way of thinking about interest rate risk, one based on relative risk/reward. To
illustrate the point, let’s first establish a risk/reward benchmark for public equities. The S&P 500 has
When Bonds Fall: How Risky Are Bonds if Interest Rates Rise?
The information contained herein is intended for Qualied Eligible Clients as dened in CFTC Regulation 4.7. This document is not a solicitation
for investment. Such investment is only oered on the basis of information and representations made in the appropriate oering documentation.
Past performance is not necessarily indicative of future results. No representation is being made that any investor will or is likely to achieve similar
results. Futures, forward and option trading is speculative, involves substantial risk and is not suitable for all investors.
Copyright © 2012 Welton Investment Corporation® All rights reserved. 3
historically returned about 10% per annum with a max drawdown of 83% during the Great Depression. In
other words, the S&P 500’s max drawdown (risk) is about 8x as large as one’s historical average annual return
expectation (reward). That’s risky, but we knew that already.
2
How would Aaa bonds compare on a similar
measure historically? This answer appears in Figure 2 below.
2
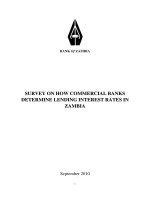
Bondholder
drawdowns that
signicantly
exceed prevailing
interest rates
reect a poor
relative risk/return
proposition – a
xed income tail
event of sorts.
The following
chart plots the
largest such
events, and shows
that drawdowns
have exceeded
interest rates by 4x
or more,
indicating that
xed income isn’t
always as “xed”
as some believe.
Figure 2: The Six Worst Risk/Return Periods for Aaa Investors
(Jan 1919 – Jun 2012)
Past performance is not necessarily indicative of future results.
(25%)
(20%)
(15%)
(10%)
(5%)
0%
5%
10%
15%
20%
1920 1930 1940 1950 1960 1970 1980 1990 2000 2010
2.2x
Max loss-to-interest rate
2.4x
4.5x
4.5x
2.0x
2.3x
Aaa Interest RateBondholder Drawdowns
See “Tail Risk: About 5x Worse Than You May Think,” Welton Visual Insight Series®. Aug 2010.
The information contained herein is intended for Qualied Eligible Clients as dened in CFTC Regulation 4.7. This document is not a solicitation
for investment. Such investment is only oered on the basis of information and representations made in the appropriate oering documentation.
Past performance is not necessarily indicative of future results. No representation is being made that any investor will or is likely to achieve similar
results. Futures, forward and option trading is speculative, involves substantial risk and is not suitable for all investors.
4 Copyright © 2012 Welton Investment Corporation® All rights reserved.
Figure 2 identifies six periods when bondholders’ peak losses would have exceeded coupon rates for six
months or more. For example, during the late 1960s investors would have experienced a -24.3% loss on their
existing bonds while initially earning only 5.4% in interest. In other words, their capital loss (i.e., their risk)
was 4.5x larger than their annual coupon payment (their reward). While the late 1950s period was equally as
skewed, the remaining four periods identified were generally less severe, topping out between 2.0 – 2.5x from
a risk/reward perspective. So compared to public equities, Aaa bonds are indeed less risky, but perhaps not
quite as safe as some investors today assume.
Duration of Past Bondholder Drawdowns
During past interest rate rises, were bondholder drawdowns acute or gradual? Were losses deep or
moderate? Figure 3 compares the length and magnitude of the four largest drawdowns from the previously
identified rate increase periods.
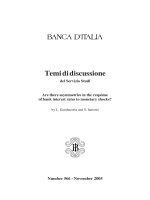
Bondholder
drawdowns
triggered by
interest rate rises
can easily exceed
-10%, sometimes
reaching in excess
of -20%.
When rates are low,
these drawdowns
tend to persist. The
longest such Aaa
drawdown would
have left investors
underwater for
over 8 years.
Figure 3: The Four Largest Aaa Drawdowns
(Jan 1919 – Jun 2012)
Past performance is not necessarily indicative of future results.
When Bonds Fall: How Risky Are Bonds if Interest Rates Rise?
The information contained herein is intended for Qualied Eligible Clients as dened in CFTC Regulation 4.7. This document is not a solicitation
for investment. Such investment is only oered on the basis of information and representations made in the appropriate oering documentation.
Past performance is not necessarily indicative of future results. No representation is being made that any investor will or is likely to achieve similar
results. Futures, forward and option trading is speculative, involves substantial risk and is not suitable for all investors.
Copyright © 2012 Welton Investment Corporation® All rights reserved. 5
Put into this context, investors quickly notice that perhaps the greatest (or at least the longest and most
enduring) pain felt by bondholders occurred during the slowest of the studied rate increase periods: 1954-
1963. Marked by an economic slowdown following World War II and the Korean War, and accompanied by a
heavy debt burden, the period from 1954 to 1960 featured very slow but steadily rising rates. The yield rose
only +1.8% peak-to-trough, but the rate increase spanned nearly 6 years with a drawdown exceeding 8 years.
Contemplating the Future
While it is impossible to predict exactly how interest rates may change in the future, there are still key lessons
worth remembering. Moreover, we now have the historical data to model the range of likely bondholder
outcomes based on past scenarios. Let’s begin.
Interest Rate Risk is Highest When Starting Yields Are Low
First, it’s important to recognize that bondholders are subject to additional interest rate risk when rates are
low – in other words, at times like today. The most notable example of this occurred between 1954-1963. As
pointed out in Figure 3, this period had one of the slowest and more moderate rate increases (just +1.8%
peak-to-trough), and yet it produced one of the deepest (-15.3%) and longest (8+ years) drawdowns for
bondholders. Why? After all, rates rose by a much greater +7.6% from 1977 to 1981. Faster rate increases
should mean worse returns, right? In most cases, yes, but a key factor is that the starting yield in 1954 was
only 2.85%, and for bondholders, the starting yield is critically important.
To understand why, it’s important to recall that bond returns consist of two primary components: (i) capital
gains/losses, and (ii) interest receipts or coupon payments. As interest rates rise, bonds experience capital
losses. Coupon payments help to buffer investors from these capital losses, but the thickness of this insulation
is measured by the initial coupon rate on the portfolio. For example, a portfolio throwing off 10% interest per
year is far better equipped to handle a +3% rate hike than a portfolio yielding only 2%. To illustrate this point,
Figure 4 dissects two past Aaa bondholder drawdowns into their interest and capital loss components.
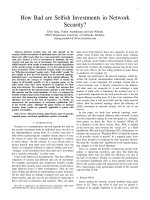
Investors will notice how the drawdown of the 1950s steadily moves along as the years go by. Despite being a
less volatile period than the late 1970s/early 1980s, the painfully slow rate rise from a miniscule initial yield
resulted in an extremely bearish environment for bonds. Conversely, although the late 1970s/early 1980s was
a more volatile environment, greater interest was available to offset capital losses and bonds recovered more
quickly as rates stabilized.
The information contained herein is intended for Qualied Eligible Clients as dened in CFTC Regulation 4.7. This document is not a solicitation
for investment. Such investment is only oered on the basis of information and representations made in the appropriate oering documentation.
Past performance is not necessarily indicative of future results. No representation is being made that any investor will or is likely to achieve similar
results. Futures, forward and option trading is speculative, involves substantial risk and is not suitable for all investors.
6 Copyright © 2012 Welton Investment Corporation® All rights reserved.
Drawdown
duration and
severity is not
determined by the
magnitude of an
interest rate spike
alone. Why? The
answer is starting
yield.
Late 1970s
investors were able
to earn their way
out of steep rate
rises (with rates
eventually peaking
at 15.5%!) thanks
to rich initial
coupon rates of
7.92% which
helped to oset
capital losses.
Mid-1950s
investors were not
so lucky, earning
an initial yield of
just 2.85% when
rates began to
climb, giving them
little capital loss
protection and
producing a
lengthy drawdown
of almost 9 years.
Figure 4: The Starting Yield Matters: Bondholder Drawdowns
Broken into Their Interest and Capital Loss Components
Past performance is not necessarily indicative of future results.
When Bonds Fall: How Risky Are Bonds if Interest Rates Rise?
The information contained herein is intended for Qualied Eligible Clients as dened in CFTC Regulation 4.7. This document is not a solicitation
for investment. Such investment is only oered on the basis of information and representations made in the appropriate oering documentation.
Past performance is not necessarily indicative of future results. No representation is being made that any investor will or is likely to achieve similar
results. Futures, forward and option trading is speculative, involves substantial risk and is not suitable for all investors.
Copyright © 2012 Welton Investment Corporation® All rights reserved. 7
So What Happens if History Repeats Itself?
Armed with (i) a historical analysis of rising interest rate periods in the U.S., (ii) an understanding of how the
initial yield impacts bond returns, and (iii) an assessment of the current low-yield environment, we asked the
question many investors are currently pondering: What would happen if rates began rising from today’s
historically-low levels?
Whether slow and steady, or sharp but short-lived, the answer is sobering – any meaningful rate increase from
today’s historically low levels would likely lead to significant losses. To estimate what those losses could look
like, we applied the slowest, fastest, and average rate increase scenarios from the past starting at today’s interest
rate levels.
3
These results appear on the following page in Figure 5.
And as the results show, any rate increases from today’s yield levels are likely to be accompanied by outsized
losses. The Slowest rate increase scenario is the most favorable of the three. It projects annual losses of just
-0.03% as coupon payments generally keep pace with capital losses. While investors avoid acute loss periods,
this scenario also forecasts almost six years of near zero returns. The Fastest rate increase scenario produces
much sharper losses, while the Average scenario (representing the average rise and length of each of the
observed historical occurrences) produces annualized losses of -7.3% over about three years.
3
Moody’s Seasoned Aaa Corporate Bond Yield as of month ending June 2012.
The information contained herein is intended for Qualied Eligible Clients as dened in CFTC Regulation 4.7. This document is not a solicitation
for investment. Such investment is only oered on the basis of information and representations made in the appropriate oering documentation.
Past performance is not necessarily indicative of future results. No representation is being made that any investor will or is likely to achieve similar
results. Futures, forward and option trading is speculative, involves substantial risk and is not suitable for all investors.
8 Copyright © 2012 Welton Investment Corporation® All rights reserved.
The following three
charts depict the
calculated
drawdown for
bondholders at
today’s current low
interest rates
according to three
historically-based
rising interest rate
scenarios: Slowest,
Fastest, and
Average.
Bondholder results
range from
generally at
(Slowest), to deep
losses over the
course of just a few
months (Fastest), to
deep losses over
three years
(Average).
Regardless of the
scenario or outlook
for rates, recall that
investors are
currently accepting
paltry returns to
bear these risks.
Figure 5: Three Possible Rate-Rise Scenarios
Based on Prior Aaa Bond Experiences
Past performance is not necessarily indicative of future results.
When Bonds Fall: How Risky Are Bonds if Interest Rates Rise?
Int. RatesDrawdown
Fastest
Rate Risk Scenario
Equivalent to rate increase of 1987
Bottom Line
Enormous losses
over a short time
period. Pace of
rise is the most
detrimental
factor.
Rate Change
Increase: +2.2%
Duration: 7 mo.
Bondholder Losses
Ann. Loss: (43.6%)
Max DDown: (23.5%)
Int. RatesDrawdown
Slowest
Rate Risk Scenario
Equivalent to rate increase of the late 1950s
Bottom Line
Minimal losses.
Coupons keep
pace with capital
losses.
Rate Change
Increase: +1.8%
Duration: 69 mo.
Bondholder Losses
Ann. Loss: (0.03%)
Max DDown: (0.36%)
Int. RatesDrawdown
Average
Rate Risk Scenario
Average of historical rate increases over last 90 years
Bottom Line
Enormous losses
spread out over
time.
Rate Change
Increase: +3.0%
Duration: 35 mo.
Bondholder Losses
Ann. Loss: (7.3%)
Max DDown: (22.6%)
(40%)
(30%)
(20%)
(10%)
0%
10%
20%
1980 1990 2000 2010
(40%)
(30%)
(20%)
(10%)
0%
10%
20%
1980 1990 2000 2010
(40%)
(30%)
(20%)
(10%)
0%
10%
20%
1980 1990 2000 2010
Jul ‘12
Jul ‘12
Jul ‘12
The information contained herein is intended for Qualied Eligible Clients as dened in CFTC Regulation 4.7. This document is not a solicitation
for investment. Such investment is only oered on the basis of information and representations made in the appropriate oering documentation.
Past performance is not necessarily indicative of future results. No representation is being made that any investor will or is likely to achieve similar
results. Futures, forward and option trading is speculative, involves substantial risk and is not suitable for all investors.
Copyright © 2012 Welton Investment Corporation® All rights reserved. 9
But What If the Future Differs from the Past?
Recognizing that the past rarely unfolds exactly the same in the future, we took this analysis a step further and
analyzed the expected impact of two additional scenarios. Specifically, what if we were to experience a
structural shift over a long time horizon, or a sharp reversal from a loss in confidence? We calculate these two
additional scenarios in Figure 6 below.
The following two
charts depict the
calculated
drawdown for
bondholders at
today’s current low
interest rates
according to two
theoretical
scenarios.
Structural is
characterized by a
gradual +6% rate-
rise over 5 years,
while Loss of
Condence depicts
a sudden +4%
increase over 1
year.
Figure 6: Two Additional Rate-Rise Scenarios:
Structural and Loss of Condence
Past performance is not necessarily indicative of future results.
Int. RatesDrawdown
Loss of Confidence
Rate Risk Scenario
Bottom Line
Sharp losses.
Lost confidence
quickly
decimates
portfolio value.
Rate Change
Increase: +4.0%
Duration: 12 mo.
Bondholder Losses
Ann. Loss: (34.8%)
Max DDown: (34.8%)
Int. RatesDrawdown
Structural
Rate Risk Scenario
Bottom Line
Unprecedented
losses (more
than 10x the
coupon rate).
Rate Change
Increase: +6.0%
Duration: 60 mo.
Bondholder Losses
Ann. Loss: (6.4%)
Max DDown: (36.2%)
(40%)
(30%)
(20%)
(10%)
0%
10%
20%
1980 1990 2000 2010
(40%)
(30%)
(20%)
(10%)
0%
10%
20%
1980 1990 2000 2010
Jul ‘12
Jul ‘12
The information contained herein is intended for Qualied Eligible Clients as dened in CFTC Regulation 4.7. This document is not a solicitation
for investment. Such investment is only oered on the basis of information and representations made in the appropriate oering documentation.
Past performance is not necessarily indicative of future results. No representation is being made that any investor will or is likely to achieve similar
results. Futures, forward and option trading is speculative, involves substantial risk and is not suitable for all investors.
10 Copyright © 2012 Welton Investment Corporation® All rights reserved.
Conclusion
Let’s conclude as we began. That is, with a simple question: How risky are bonds if interest rates rise?
And as before, one’s perception will be heavily influenced by one’s forecast for how interest rates will rise over
time. Some investors will anticipate deflation and expect subdued rates well into the near or intermediate
future. Others will point to recent activity by the world’s central banks as hope for continued rate suppression
in bond markets. Others still will note the fiscal drums which are beating ever louder. How long indeed before
investors begin requiring greater recompense for the treasury notes of increasingly indebted developed
nations?
And while all of these perspectives warrant merit, the first noteworthy conclusion from our analysis is that the
Armageddon scenario is not the only one worthy of concern – a number of normal scenarios could lead to
significant losses. Even our most gradual rate increase scenario (Slowest, in Figure 5) models an annualized
return expectation of 0% for almost six years. Of course, history reminds us that large bondholder tail events
have occurred in the past too and that today’s low yield environment leaves investors particularly exposed
when rates begin to climb. And importantly, the rewards for bearing these significant risks are rates of return
that, at-best, narrowly outpace inflation.
Of course, while the risk/reward analyses above may be new to some, investors are already painfully aware of
the yield drought that low rates have brought. And while investors are understandably disappointed by the
performance of the fixed income asset class, they should not conclude that the benefits they have come to
associate with fixed income are no longer attainable. Some of these beneficial traits can be isolated,
replicated, and diversified.
When Bonds Fall: How Risky Are Bonds if Interest Rates Rise?
These results shed additional light on the degrading risk/reward characteristics of an investment that many
believe to be the safest in their portfolio. And naturally, while any losses would only be on paper until realized,
such results would likely create a tremendous strain on investor portfolios, tying up valuable capital in products
with vastly inferior performance traits. We acknowledge that investors’ actual experience will vary across these
scenarios, as our analysis reflects nominal returns associated with a single Aaa corporate index of long duration.
As investor portfolios will naturally be diversified across risk profile, duration, structure, and issuer, such analysis
could be customized for Treasury securities or lower-rated bonds and further studied in real terms.
The information contained herein is intended for Qualied Eligible Clients as dened in CFTC Regulation 4.7. This document is not a solicitation
for investment. Such investment is only oered on the basis of information and representations made in the appropriate oering documentation.
Past performance is not necessarily indicative of future results. No representation is being made that any investor will or is likely to achieve similar
results. Futures, forward and option trading is speculative, involves substantial risk and is not suitable for all investors.
Copyright © 2012 Welton Investment Corporation® All rights reserved. 11
Income, for example, could be augmented with strategies such as direct infrastructure investments, income-
based real estate, or low beta / attractive-yield equities. Portfolio diversification, and potentially even outright
protection, might be achieved by utilizing strategies capable of harnessing rate changes and global capital
flows such as managed futures and global macro. Both have generally protected investor capital while also
delivering capital appreciation and tail risk protection during times of equity market stress.
One of the benefits of these challenging times is a general change in portfolio construction theory toward
combing investments based on their beneficial diversifying traits as opposed to their asset classification.
4
This
is a positive shift, and one that should advantage investors in reaching their goals both near and far.
4
See “Diversication: Often Discussed, but Frequently Misunderstood, “ Welton Visual Insight Series.® Jan 2011.
The information contained herein is intended for Qualied Eligible Clients as dened in CFTC Regulation 4.7. This document is not a solicitation
for investment. Such investment is only oered on the basis of information and representations made in the appropriate oering documentation.
Past performance is not necessarily indicative of future results. No representation is being made that any investor will or is likely to achieve similar
results. Futures, forward and option trading is speculative, involves substantial risk and is not suitable for all investors.
12 Copyright © 2012 Welton Investment Corporation® All rights reserved.
10/12
When Bonds Fall: How Risky Are Bonds if Interest Rates Rise?
About Visual Insight
The Welton Visual Insight Series® is an ongoing educational publication intended for institutional investors, consultants and
wealth advisors. The series strives to provide focused investment insights through a combination of impactful visuals, summary
observations, and actionable conclusions. To subscribe, register at www.welton.com/register.
About Welton®
Welton Investment Corporation® is a +20-year-old alternative investment manager serving institutions, private banks and private
wealth investors around the world. The rm’s proprietary investment research is focused exclusively on identifying and delivering
diversifying, non-correlated investment returns to measurably enhance the performance of our clients’ broader investment
portfolios. To learn more, visit www.welton.com.
Contact / Credits
Christopher Keenan Peter Tarricone Nash Dykes, CFA
Senior Managing Director Manager Senior Associate
+1 (831) 620-6607
California | New York