Liquidity and Credit Risk potx
Bạn đang xem bản rút gọn của tài liệu. Xem và tải ngay bản đầy đủ của tài liệu tại đây (290.17 KB, 32 trang )
THE JOURNAL OF FINANCE
•
VOL. LXI, NO. 5
•
OCTOBER 2006
Liquidity and Credit Risk
JAN ERICSSON and OLIVIER RENAULT
∗
ABSTRACT
We develop a structural bond valuation model to simultaneously capture liquidity and
credit risk. Our model implies that renegotiation in financial distress is influenced
by the illiquidity of the market for distressed debt. As default becomes more likely,
the components of bond yield spreads attributable to illiquidity increase. When we
consider finite maturity debt, we find decreasing and convex term structures of liq-
uidity spreads. Using bond price data spanning 15 years, we find evidence of a positive
correlation between the illiquidity and default components of yield spreads as well as
support for downward-sloping term structures of liquidity spreads.
CREDIT RISK AND LIQUIDITY RISK HAVE LONG been perceived as two of the main jus-
tifications for the existence of yield spreads above benchmark Treasury notes
or bonds (see Fisher (1959)). Since Merton (1974), a rapidly growing body of
literature has focused on credit risk.
1
However, while concern about market
liquidity issues has become increasingly marked since the autumn of 1998,
2
liquidity remains a relatively unexplored topic, in particular, liquidity for de-
faultable securities.
3
This paper develops a structural bond pricing model with liquidity and credit
risk. The purpose is to enhance our understanding of both the interaction be-
tween these two sources of risk and their relative contributions to the yield
spreads on corporate bonds. Throughout the paper, we define liquidity as the
ability to sell a security promptly and at a price close to its value in friction-
less markets, that is, we think of an illiquid market as one in which a sizeable
discount may have to be incurred to achieve immediacy.
We model credit risk in a framework that allows for debt renegotiation as in
Fan and Sundaresan (2000). Following Franc¸ois and Morellec (2004), we also
introduce uncertainty with respect to the timing and occurrence of liquidation
∗
Ericsson is from McGill University and the Swedish Institute for Financial Research; Renault
is from the Fixed Income Quantitative Research group of Citigroup Global Markets Ltd. and the
Financial Econometrics Research Centre at the University of Warwick.
1
See for example Black and Cox (1976), Kim, Ramaswamy, and Sundaresan (1993), Shimko,
Tejima, and van Deventer (1993), Nielsen, Sa
´
a-Requejo, and Santa-Clara (1993), Longstaff and
Schwartz (1995), Anderson and Sundaresan (1996), Jarrow and Turnbull (1995), Lando (1998),
Duffie and Singleton (1999), and Collin-Dufresne and Goldstein (2001).
2
Indeed, the BIS Committee on the Global Financial System underlines the need to understand
the sudden deterioration in liquidity during the 1997 to 1998 global market turmoil. See BIS (1999).
3
Some recent empirical work with reduced-form credit risk models allows for liquidity risk.
Examples include Duffie, Pedersen and Singleton (2003), Janosi, Jarrow and Yildirim (2002), and
Liu, Longstaff and Mandell (2006).
2219
2220 The Journal of Finance
conditional on entering formal bankruptcy. This permits us to investigate the
impact of illiquidity in the market for distressed debt on the renegotiation that
takes place when a firm is in distress.
It is often noted that the yield spreads that structural models generate are
too low to be consistent with observed spreads.
4
Indeed, this may stem from
inherent underestimation of default risk in these models. However, if prices of
corporate bonds reflect compensation for other sources of risk such as illiquidity,
then one would expect structural models to overprice bonds.
5
Furthermore, it is also noted that the levels of credit spreads that obtain
under most structural models are negligible for very short maturities, which is
inconsistent with empirical evidence.
6
Again, this result holds only if the main
determinant of short-term yield spreads is default risk. Yu (2002) documents the
virtual impossibility of reconciling historical credit rating transition matrices
to short-term yield spread data, without resorting to additional sources of risk.
7
Because our model implies nontrivial liquidity premia for short maturities, it
can therefore help align structural models with this stylized fact.
We make two important assumptions about liquidity. First, when the firm is
solvent, the bondholder is subjected to random liquidity shocks. Such shocks can
reflect unexpected cash constraints or a need to rebalance a portfolio for risk
management purposes. With a given probability the bondholder may have to
sell his position immediately. The realized price is assumed to be a (stochastic)
fraction of the price in a perfectly liquid market, where the fraction is modeled as
a function of the random number of traders active in the market for a particular
bond. We allow the probability of a liquidity shock to be a random variable that
is correlated with asset value, our model’s main determinant of default risk.
The supply side of the market is an endogenous function of the state of the
firm and the probability of liquidity shocks. When there is no liquidity shock,
the bondholder still has the option to sell if the price he can obtain is suffi-
ciently high. A bondholder can avoid selling at a discount by holding the bond
until maturity. However, he will sell preemptively if the proceeds from a sale
outweigh the expected value of waiting and incurring the risk of being forced
to sell at a less favorable price in the future.
We analyze the comparative statics of the model with perpetual debt and find
that when the main determinants of the default probability—that is, leverage
and asset risk—increase, the components of bond yield spreads that are driven
by illiquidity also increase.
4
See, for example, Jones, Mason, and Rosenfeld (1984) and Huang and Huang (2002).
5
This view has been pursued in recent work by Huang and Huang (2002), who measure the
amount of credit risk compensation in observed yield spreads. Specifically, they calibrate several
structural risky bond pricing models to historical data on default rates and loss given default. They
find that for high-grade debt, only a small fraction of the total spread can be explained by credit
risk. For lower quality debt a larger part of the spread can be attributed to default risk.
6
This argument is one of the motivations for the article by Duffie and Lando (2000).
7
His study is based on the reduced-form model of Jarrow, Lando, and Yu (2005), in which default
occurs at the first jump in a Cox process. Thus, the lack of jumps to default in the typical structural
model cannot alone explain the underestimation of yield spreads at short maturities.
Liquidity and Credit Risk 2221
Our model with finite-maturity debt predicts that liquidity spreads are de-
creasing functions of time to maturity. This is consistent with empirical ev-
idence on markets for government securities. Amihud and Mendelson (1991)
examine the yield differentials between U.S. Treasury notes and bills that differ
only in their liquidity, and find that term structures of liquidity premia do have
this particular shape across short maturities. Our model implies a decreasing
term structure of liquidity spreads due to the upper bound on dollar losses that
can arise due to liquidity shocks before a preemptive sale takes place.
Accordingly, our model makes predictions with regard to the shape of the
term structure of liquidity spreads as well as to its interaction with default risk.
We study these two aspects of corporate bond yield spreads for two separate
panels of U.S. corporate bond data that span a period of 15 years. Controlling
for credit risk, we examine the impact of two proxies for liquidity risk, namely,
a measure of liquidity risk in Treasury markets and a measure of bond age. A
comparison of parameter estimates across subsamples constructed along credit
ratings documents a positive correlation between default risk and the size of
the illiquidity spread. Second, we find support for a downward-sloping term
structure of the liquidity spread in one of our two data sets. Hence, our data
lend support to two of the most salient implications of our theoretical model.
We also analyze the turbulent period surrounding Russia’s default on its
domestic ruble-denominated bonds. These findings are qualitatively consistent
with our results for the full 15-year sample, and their economic significance is
much higher.
The structure of this paper is as follows. Section I presents a model of per-
petual debt and describes our framework for financial distress and illiquidity.
Section II examines comparative statics for the different components of yield
spreads. The case of finite maturity bonds is discussed in Section III, which
also describes the model’s implied term structures for liquidity premia. Sec-
tion IV reports on our empirical tests of the model’s predictions and Section V
concludes.
I. The Model
We now describe our framework for the valuation of risky debt and the in-
teraction between a firm’s claimants in financial distress. As a starting point,
we take the model of Fan and Sundaresan (2000) (FS), which provides a rich
framework for the analysis of creditor–shareholder bargaining.
We use debt-equity swaps as a model for out-of-court renegotiation. In a debt-
equity swap, bondholders receive new equity in lieu of their existing bonds. Such
a workout is motivated by a desire to avoid formal bankruptcy and both the
liquidation costs and costs associated with the illiquidity of distressed corporate
debt.
In court-supervised proceedings (Chapter 11 of the U.S. Bankruptcy Code),
on the other hand, the bonds are assumed to trade until distress is resolved.
Resolution of distress can either entail liquidation (Chapter 7) or full recovery
after successful renegotiation. We model the outcome of renegotiation in formal
2222 The Journal of Finance
bankruptcy as strategic debt service,
8
whereby bondholders in renegotiation
accept a reduced coupon flow in order to avoid liquidation and thereby maintain
the firm in operation.
We assume that a firm is financed by equity and one issue of debt. Initially,
we focus on perpetual debt with a promised annual dollar coupon of C. The
risk-free interest rate r is assumed to be constant and we rule out asset sales
to finance dividends or coupon payments. We also assume that agents are risk
neutral so all discounting takes place at the risk-free rate. The firm’s asset
value is assumed to obey a geometric Brownian motion,
dV
t
= (μ − β)V
t
dt + σV
t
dW
v
t
, (1)
where μ represents the drift rate of the assets, σ denotes volatility, and W
v
t
is a
Brownian motion. The parameter β denotes the cash flow rate, which implies
that βV
t
dt is the amount of cash available at time t to pay dividends and service
debt. If this value is not sufficient, shareholders may choose to contribute new
capital.
When V
t
reaches the lower boundary V
S
, the firm defaults. In our frame-
work, this decision is made optimally by the shareholders.
9
In the absence of
a workout, the firm enters into Chapter 11. If court-supervised renegotiations
fail, the firm realizes proportional liquidation costs αV
t
. While absolute prior-
ity is respected in liquidation, it may be violated during bargaining in formal
reorganization.
We assume that when V
t
= V
S
, shareholders and bondholders can avoid for-
mal bankruptcy altogether by negotiating a debt–equity swap. The terms of
this deal are determined as the solution to a Nash bargaining game in which
the following linear sharing rule is adopted:
E
w
(V
S
) = θv(V
S
), B
w
(V
S
) = (1 − θ)v(V
S
), (2)
where E and B denote equity and debt values, respectively, a superscript w
indexes values that result from a workout, θ ∈ [0, 1], and v(V
t
) is the levered
firm value.
10
We assume that the two parties have respective bargaining powers
of η and (1 − η), where η ∈ [0, 1].
According to the FS model, the outside option of bondholders forces the firm
to be liquidated immediately. However, in reality, bondholders can seldom press
for immediate liquidation. In Chapter 11, negotiations can go on for years under
automatic stay.
11
During this period, the firm’s bonds still trade and market
8
See Anderson andSundaresan (1996), Mella-Barral and Perraudin(1997), Fan and Sundaresan
(2000), and Franc¸ois and Morellec (2004) for a more detailed discussion of this vehicle for modeling
renegotiation.
9
The ex post optimal default threshold needs to be determined numerically in our setting.
10
The levered firm value equals the asset value less expected liquidation costs. For simplicity,
we do not consider corporate taxes.
11
Automatic stay describes an injunction issued automatically upon the filing of a petition under
any chapter of the Bankruptcy Code by or against the debtor. This injunction prohibits collection
actions against the debtor, providing him relief so that a reorganization plan can be structured
without disruption.
Liquidity and Credit Risk 2223
liquidity is still a factor for creditors. To capture this feature of financial dis-
tress, we introduce uncertainty with respect to the timing and occurrence of
liquidation. Following Franc¸ois and Morellec (2004) (FM), we do this by assum-
ing that liquidation only takes place if the firm’s asset value remains below the
default threshold longer than a court-imposed observation period. Should the
firm’s value recover within this period, it will exit from Chapter 11.
12
The key implications of this assumption for our model of illiquidity are that
Chapter 11 takes time and that bondholders cannot avoid exposing themselves
to the risk of having to sell their holdings while the firm is in distress by forcing
immediate liquidation. As a result, the position of bondholders at the bargaining
table will also depend on both the expected duration in Chapter 11 and the risk
of having to sell distressed debt at a discount. In order to quantify the impact
of liquidity risk on out-of-court debt renegotiation, we require a detailed model
of the outside option. We begin by discussing the model of formal bankruptcy
in the absence of illiquidity.
Let T
L
be the liquidation date, where liquidation occurs when the firm’s value
remains below V
S
longer than d years. When the firm is in Chapter 11, we follow
FM and assume that debt is serviced strategically. This flow is denoted by s(V
t
).
If the time in default exceeds d years, the firm is liquidated, creditors recover
(1 − α)V
T
L
, and shareholders’ claims are worthless. Thus, the values of debt and
equity conditional on entering formal bankruptcy (indexed by a superscript b)
can be written as
B
b
L
(V
S
) = E
t
T
L
t
e
−r(u−t)
C · I
{V
u
>V
S
}
+ s(V
u
) · I
{V
u
≤V
S
}
du
+ E
t
e
−r(T
L
−t)
(1 − α)V
T
L
(3)
and
E
b
L
(V
S
) = E
t
T
L
t
e
−r(u−t)
(βV
u
−C) · I
{V
u
>V
S
}
+ (βV
u
− s(V
u
)) · I
{V
u
≤V
S
}
du
,
(4)
where the subscript L indicates that the debt is perfectly liquid and I
{·}
is an
indicator function.
Now suppose that in a workout to preempt Chapter 11, bondholders are
offered new securities in lieu of their existing bonds. In equilibrium, the ad-
ditional value of a successful workout is (1 − θ
∗
(V
S
))v(V
S
) − B
b
L
(V
S
) for bond-
holders, and θ
∗
(V
S
)v(V
S
) − E
b
L
(V
S
) for shareholders. The Nash solution to the
bargaining game is
θ
∗
(V
S
) = arg max
θv(V
S
) − E
b
L
(V
S
)
η
·
(1 − θ)v(V
S
) − B
b
L
(V
S
)
1−η
. (5)
12
The main impact of this assumption on security values in Franc¸ois and Morellec (2004) is that
the value of the firm over which claimants bargain depends on the length of time that the firm is
expected to spend in Chapter 11 and the probabilities of liquidation and recovery, respectively.
2224 The Journal of Finance
Note that the scope for informal debt renegotiation hinges on the costs that
can be avoided by not entering into formal reorganization. So far, this encom-
passes only the deadweight costs of liquidation in Chapter 7, reflected in the
values of B
b
L
(V
S
) and E
b
L
(V
S
). When we introduce illiquidity, the associated costs
are also part of the bargaining surplus, directly through the outside option of
bondholders and indirectly through the equity value. Note that bargaining in
Chapter 11 does not help mitigate the costs of illiquidity due to the continued
trading of the bonds throughout the proceedings.
13
We assume that the equity
issued to creditors in a workout is perfectly liquid, allowing for full avoidance
of illiquidity costs.
14
We now describe our model of illiquidity and then return
to a discussion of its impact on debt renegotiation.
A. Illiquidity
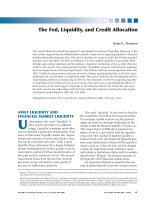
Figure 1 summarizes the sequence of events that occur given that the firm
has not been liquidated, that is, t < T
L
.
15
First, at equally spaced time intervals
(t years apart), the bondholder learns whether he is forced to sell his bond
due to a liquidity shock.
16
Such shocks may occur as a result of unexpected
cash shortages, the need to rebalance a portfolio in order to maintain a hedging
or diversification strategy, or a change in capital requirements. We denote the
annualized instantaneous probability of being forced to sell by λ
t
and assume
that
dλ
t
= κ(ζ − λ
t
) dt +
λ
t
φ dW
λ
t
, (6)
where dW
λ
t
dW
v
t
= ρ dt. The parameter ζ can be viewed as the long-term mean
of λ
t
, κ is the speed of mean reversion, and φ is a volatility parameter. By
allowing for a nonzero correlation coefficient between firm value and the like-
lihood of liquidity shocks, we can incorporate the influence of the overall state
of the economy on both a firm’s credit quality and investor vulnerability. For
13
Hence, the agreed reduction in debt service flow under Chapter 11 will not be affected by the
continuing illiquidity during the proceedings.
14
Note that this particular choice of reorganization vehicle is not crucial. The key assumption
is that bondholders receive new and less illiquid securities than their current holdings. Thus, we
could accommodate exchange offers in which bondholders receive a mix of new bonds and an equity
component.
15
The Longstaff (1995) model lies close in spirit to ours. He measures the value of liquidity for a
security as the value of the option to sell it at the most favorable price over a given window of time.
Although our results are not directly comparable because he derives upper bounds for liquidity
discounts for a given sales-restriction period, his definition of liquidity approximates our own.
To date, Tychon and Vannetelbosch (2005) is, to our knowledge, the only paper that models
the liquidity of corporate bonds endogenously. They use a strategic bargaining setup in which
transactions take place because investors have different views about bankruptcy costs. Although
some of their predictions are similar to ours, their definition of liquidity risk differs significantly.
Notably, as their liquidity premia are linked to the heterogeneity of investors’ perceptions about
the costliness of financial distress, their model predicts that liquidity spreads in Treasury debt
markets should be zero.
16
Note that we do not model the bondholder’s equilibrium holdings of cash versus bonds. We
model a single bondholder with unit holdings of the bond.
Liquidity and Credit Risk 2225
Emerges if
value recovers
before end of
exclusivity
period.
v
t
v
t+1
=V
S
v
t+1
>V
S
Liquidity shock: forced sale.
δ*
Best offer exceeds
reservation price (
δ*).
Bond is kept.
Bond is sold.
Firm does not
succeed in
workout and
enters into Ch.
11, during which
time bonds
trade and
liquidity shocks
are still possible.
Firm is
liquidated if it
does not
recover in
time.
Firm successfully
completes
workout.
The firm’s asset
value evolves.
No shock.
Events repeat.
Distress threshold: when
the asset value is above
this level, the firm is
healthy; when it is below,
it will attempt financial
restructuring.
Figure 1. The sequence of events.
instance, if ρ<0, then during recessions firm values would tend to decrease
while liquidity shocks would become more likely.
17
Given that the bondholder is forced to sell, the discount rate that the bond-
holder faces is modeled as follows. The price offered by any one particular trader
is assumed to be a random fraction
˜
δ
t
of the perfectly liquid price B
L
. We assume
that this fraction is uniformly distributed on [0, 1]. The bondholder obtains N
offers and retains the best one, where N is assumed to be Poisson with param-
eter γ . Hence, γ measures the expected number of offers. One may also think
of γ as the number of active traders in the market for a particular type of bond.
While this choice of distribution and support for the individual discounts is
admittedly stylized, we retain it for simplicity. The bondholder’s expected best
fraction of the liquid price he will be offered is
18
¯
δ ≡ E[
˜
δ
t
] =
∞
n=0
e
−γ
γ
n
n!
·
n
n + 1
. (7)
17
Fund managers are often subject to constraints on the credit rating of bonds they hold in their
portfolio. Thus, as the credit quality of a bond declines, the manager will become more likely to sell
it, consistent with a negative ρ.
18
Details of the calculations can be found in Appendix A.
2226 The Journal of Finance
Note that as γ tends to infinity,
¯
δ tends to one as an ever greater number
of dealers compete for the same security and the price converges to the purely
liquid price.
The motivation for the randomness of
˜
δ
t
, that is, the implicit assumption that
different prices for the same security can be realized at any one time, is the same
as for the occurrence of liquidity shocks: Some agents trade for hedging or cash
flow reasons and may, therefore, accept to buy at a higher (or sell at a lower)
price than other traders.
19
This setup is consistent with the structure of the U.S. corporate bond market,
an over-the-counter market that is dominated by a limited number of dealers,
as information asymmetries can readily lead to several prices being quoted in
a given market at the same time.
20
The expected value of the bond given a forced sale is
E
t
[
˜
δ
t
B
L
(V
t
) |forced sale] = B
L
(V
t
)E[
˜
δ
t
] = B
L
(V
t
)
¯
δ, (8)
where E
t
[·] denotes the conditional expectation with respect to the information
available at date t, after the possible realization of a liquidity shock but before
the arrival of bids from bond dealers.
21
If the bondholder is not forced to sell,
he still has the option to sell, should the best offer made to him be acceptable.
If he decides to sell, he receives a payment of
˜
δ
t
B
L
(V
t
),
and if he decides not to sell, the holding value is
e
−rt
E
t
[B
I
(V
t+t
)]. (9)
Hence, just prior to t (i.e., at t −, at which point the value of the firm is known
but the potential liquidity shock and the number of offers are not), the expected
value of the illiquid bond if the firm is solvent is
E
t−
[B
I
(V
t
)] = E
t−
π
t
·
¯
δ
t
B
L
(V
t
) + (1 − π
t
) max
˜
δ
t
B
L
(V
t
), e
−rt
E
t
[B
I
(V
t+t
)]
,
(10)
where π
t
= 1 − exp{−
t
t−t
λ
s
ds} denotes the probability of a liquidity shock.
We denote by δ
∗
t
the reservation price fraction above which the bondholder will
decide to sell at time t and below which he will keep his position until the next
period unless he faces a liquidity shock. This notation allows us to rewrite
19
We assume here that the demand side of the market is unaffected by events that impact bond
value. However, it is possible to extend our framework to allow for offer distributions that are
dependent on the risk return characteristics of a bond. Risk-averse bond dealers would demand
steeper discounts as the credit quality of the bond declines. Results for such a specification are
qualitatively similar to those we obtain in this much simpler setting.
20
See for example Schultz (1998) and Chakravarty and Sarkar (1999).
21
The distribution of offers is assumed constant over time so that E
t
[
˜
δ
t
] = E[
˜
δ
t
] =
¯
δ. An alter-
native way to introduce a correlation between asset values and market liquidity would be to adopt
a specification for γ similar to the one we choose for λ
t
in (6).
Liquidity and Credit Risk 2227
E
t−
max
˜
δ
t
B
L
V
t
, e
−rt
E
t
B
I
V
t+t
,
as
E
t−
˜
δ
t
B
L
(V
t
)I
˜
δ
t
>δ
∗
t
+ e
−rt
E
t
[B
I
(V
t+t
)]I
˜
δ
t
≤δ
∗
t
= B
L
(V
t
)E
t−
˜
δ
t
I
˜
δ
t
>δ
∗
t
+ P
˜
δ
t
≤ δ
∗
t
e
−rt
E
t
[B
I
(V
t+t
)].
(11)
The critical value for the offered price fraction
˜
δ
t
, above which the bondholder
will decide to sell, is
δ
∗
t
=
e
−rt
E
t
[B
I
(V
t+t
)]
B
L
(V
t
)
. (12)
This level equates the value of selling voluntarily with the value of waiting
for another period t.
B. Illiquidity and Workouts
We now revisit the renegotiation process of a firm in distress when the debt
of the firm trades in imperfectly liquid markets. Suppose the firm defaults at
V
t
= V
S
, and subsequently a successful workout takes place. Then, the values
of the firm’s securities are
E
w
I
(V
S
) = θ
∗
I
(V
S
)v(V
S
)
B
w
I
(V
S
) =
1 − θ
∗
I
(V
S
)
v(V
S
),
(13)
where subscript I indicates that the values derive from an illiquid market. The
sharing rule, θ
∗
I
(V
S
), is now the outcome of the modified bargaining problem
θ
∗
I
(V
S
) = arg max
θv(V
S
) − E
w
I
(V
S
)
η
·
(1 − θ)v(V
S
) − B
w
I
(V
S
)
1−η
. (14)
Equation (14) makes it clear that the outside options of both parties depend on
the impact of illiquidity on bond prices.
Unfortunately, we are unable to derive closed-form solutions for bond prices
in the above setting. In order to compute security values, we rely on the Least
Squares Monte Carlo (LSM) simulation technique suggested by Longstaff and
Schwartz (2001). This methodology allows us to deal with the inherent path
dependence of our model of financial distress, the two correlated sources of
uncertainty, and the “early exercise” feature of the bondholder’s selling decision.
A detailed description of the solution method is available in Appendix B.
C. Decomposing the Yield Spread
In order to quantify the influence of illiquidity on bond valuation, we fo-
cus on yield spreads, the difference in corporate bond yields and those of oth-
erwise identical perfectly liquid risk-free securities. Consider s
I
= y
w
I
− r, the
yield spread on an illiquid bond when a workout is a possible vehicle for reor-
ganization given financial distress. Let y
w
L
be the yield on a bond with the same
2228 The Journal of Finance
promised cash flows in a perfectly liquid market. Note that the actual payoffs
may not be identical across all states of the world since in a workout, bargain-
ing is influenced by illiquidity. To measure the extent to which this interaction
influences bond values, we also compute y
L
, the yield on a hypothetical liquid
bond with cash flows that are identical to the illiquid bond, both when the firm
is solvent and when it is in distress. The spread on the illiquid bond can now
be decomposed into three components
s
I
= s
1
+ s
2
+ s
3
=
y
w
I
− y
L
+
y
L
− y
w
L
+
y
w
L
−r
.
(15)
The first component, s
1
, isolates the effect of liquidity shocks and the resulting
trades on bond prices, in that it represents the difference in yield between two
securities with the same cash flows (save illiquidity costs). However, illiquidity
influences bargaining in distress. Accordingly, the second component, s
2
, mea-
sures the difference in yield between two hypothetical liquid securities whose
cash flows differ only by the difference between sharing rules in workouts due
to the illiquidity of bonds in formal bankruptcy. Hence, s
1
can be considered a
“pure” liquidity spread, and s
2
a measure of the interaction between liquidity
and credit risk. Finally, s
3
measures the default risk of the firm in a perfectly
liquid setting.
II. Comparative Statics
Table I summarizes the numerically estimated comparative statics. As we
show in Section III, the actual levels of yield spreads and their components for
very long-term debt may differ significantly from those for realistic maturities.
Hence, we first concentrate on the qualitative implications of the model before
providing its extension to finite maturity debt. One key parameter is the bar-
gaining power of shareholders, which influences how bond values respond to
changes in many of the other parameters. Rather than treating this parame-
ter in isolation, we consider two sets of comparative statics, one for situations
characterized by high shareholder bargaining power (η = 0.75, Panel A) and
one for high bondholder bargaining power given distress (η = 0.25, Panel B).
The long-run mean of the instantaneous liquidity shock probability, ζ , is dis-
tinctly positively correlated with the nondefault components of the spreads.
Both the pure illiquidity spread, s
1
, and the workout spread, s
2
, increase, re-
gardless of the relative bargaining powers of bondholders and shareholders.
Since the default component of the yield spreads remains unaffected, the total
spread increases in ζ .
The impact of the mean number of dealers, γ , is also clear: It decreases both
s
1
and s
2
. Interestingly, both ζ and γ influence the default policy of the firm.
The higher the liquidity shock probabilities and the lower the number of active
dealers, the earlier the shareholders will want to default. This will tend to
decrease the liquidity spread and increase the workout spread. However, this
effect is not strong enough to fully counter the direct effect on the illiquidity
Liquidity and Credit Risk 2229
Table I
Comparative Statics of the Yield Spread Components
This table reports numerically estimated comparative statics for the perpetual debt version of the
model. A “>0” or “ <0” indicates a positive or negative relationship, respectively, “0” indicates no
relationship, and a weak inequality sign indicates that the relationship is quantitatively weak.
Note that although only one parameter is changed at a time, the default threshold is recomputed
for each valuation. The benchmark parameter values employed are ζ = 0.10, γ = 7, φ = 0.05, ρ =
−0.5, C = 4, σ = 0.20, r = 0.05, β = 0.03, α = 0.25, and d = 2. The yield spread s
I
= s
1
+ s
2
+ s
3
is
decomposed as follows: s
1
= ( y
w
I
− y
L
), s
2
= ( y
L
− y
w
L
), and s
3
= ( y
w
L
− r), where y
w
I
is the yield on
the illiquid bond when workouts are possible, y
L
is the yield on a hypothetical liquid bond with
identical cash flows to the illiquid bond in all states of the world, and y
w
L
is the yield on a liquid
bond with the same promised cash flows as the illiquid bond.
Pure
Total Yield Default Total Nondef. Liquidity Workout
Spreads Component Component Component Component
(s
1
+ s
2
+ s
3
)(s
3
)(s
1
+ s
3
)(s
1
)(s
2
)
Panel A: High Shareholder Bargaining Power (η = 0.75)
Long-run mean of ζ>00>0 >0 >0
liquidity shock prob.
Mean number of dealers γ<00<0 <0 <0
Correlation coefficient ρ 00<0 <0 <0
Leverage C >0 >0 >0 <0 >0
Asset risk σ>0 >0 >0 >0 ≥0
Cash flow rate β>0 >0 >0 >0 <0
Liquidation costs α>0 >0 <0 <0 >0
Ch. 11 duration d >0 >0 >0 <0 >0
Panel B: High Bondholder Bargaining Power (η = 0.25)
Long-run mean of ζ>00>0 >0 >0
liquidity shock prob.
Mean number of dealers γ<00<0 <0 <0
Correlation coefficient ρ 00<0 <0 <0
Leverage C >0 >0 >0 <0 >0
Asset risk σ>0 >0 >0 >0 ≥0
Cash flow rate β>0 >0 >0 >0 ≥0
Liquidation costs α>0 >0 >0 >0 ≥0
Ch. 11 duration d >0 >0 >0 ≥0 >0
spread by the increased likelihood of a shock (higher ζ) or by a bigger discount
conditional on selling (lower γ ).
The effect of leverage, as measured by the annual coupon amount C, is more
subtle. The higher the leverage, the higher the default threshold. This tends to
increase the default spread s
3
. A higher default probability implies that a work-
out with an ensuing debt–equity swap becomes more likely. As the expected
lifetime of the bond decreases, it decreases the liquidity spread component s
1
,
due to a reduction in the risk of being exposed to liquidity shocks while solvent.
However, in the absence of a workout, s
1
would not decrease. If shareholders
2230 The Journal of Finance
have bargaining power in a workout, they can extract concessions from bond-
holders that are equivalent to a fraction of the illiquidity costs that would be
incurred in Chapter 11. Thus, the spread component s
2
increases. Overall, the
effect of an increase in the workout spread dominates and s
1
+ s
2
increases in
leverage under both bargaining power scenarios.
The effect of asset risk is similar to that of leverage save for one major dif-
ference. Although an increase in asset risk makes a workout more likely, thus
increasing s
2
, it also increases the optionality of equity. With a higher level of
risk, shareholders may be willing to keep the firm alive longer to benefit from
the possible future upside. As a result, the default threshold is lower for a given
level of leverage.
22
Thus, the liquidity spread s
1
, which decreases with leverage,
actually increases. In aggregate, therefore, s
1
+ s
2
increases in asset risk both
for high and low shareholder bargaining power.
With respect to cash flow rate β, the higher the β the lower the growth rate
of the firm and the higher the risk of distress. This tends to have a negative
effect on the liquidity component s
1
. However, any increase in β also decreases
V
S
(shareholders receive more dividends and are willing to keep the firm afloat
longer), which in turn offsets the increase in distress probability. In short, the
effect of β on s
1
is positive, and on s
2
is negative, and the overall effect is an
increase in s
1
+ s
2
.
An increase in liquidation costs, α, increases the default threshold and thus
the probability of entering into a workout.
23
When the bargaining power of
shareholders is high, there is a stronger incentive for shareholders to default
earlier. In this scenario, an increase in α yields a faster decrease in s
1
. The
workout component, s
2
, also increases when the bargaining power is high, but
remains unaffected in the opposite scenario. The overall effect turns out to be
a net increase in s
1
+ s
2
, except for an increase in α from high levels when η is
high.
The exclusivity period in Chapter 11, d, increases the illiquidity costs to be
shared in out-of-court bargaining and thus the spread component s
2
. In turn,
it gives shareholders an incentive to default earlier, and hence s
1
decreases in
d. The net effect is an increase in (s
1
+ s
2
), particularly when η is high. Thus, d
increases yield spreads through both the nondefault and default components.
Surprisingly, the effect of the correlation between the asset value and the
probability of a liquidity shock on the spread components proves to be relatively
weak. When the bargaining power of shareholders is elevated, the workout
spread is inversely related to ρ. Intuitively, when a workout occurs in times of
frequent liquidity shocks, the impact of illiquidity on the workout is greater.
When shareholders have low levels of bargaining power, the effect is the same
but less pronounced. The relationship between ρ and s
1
, the pure liquidity
spread, is ambiguous, and weaker still. Note that the comparative statics for
the other parameters rely on neither the size nor the sign of the correlation
coefficient.
22
See also, for example, Leland (1994), Fan and Sundaresan (2000).
23
See also Fan and Sundaresan (2000) and Franc¸ois and Morellec (2004).
Liquidity and Credit Risk 2231
In summary, variables that are positively related to the default component
of the spread also tend to increase the sum of the pure liquidity spread, s
1
, and
the workout spread, s
2
. The only exception is an accrual in already high liqui-
dation costs when shareholders enjoy high levels of bargaining power. While
the liquidity component may decrease at the onset of distress, the increase in
spread due to the influence of the illiquidity of distressed debt on bargaining
in a workout does tend to more than compensate for it.
III. Term Structures of Liquidity Premia
The assumption of infinite debt maturity is obviously restrictive if we wish to
gauge the quantitative output of our model. To allow us to relax this assumption
without making the problem intractable, we rely on a debt structure proposed
by Leland and Toft (1996). We assume that the firm continuously issues new
bonds with principal p, coupon c, and maturity T, at which point the principal
is also repaid. The rate of issuance of new debt is p =
P
T
, where P is the total par
value of debt outstanding. The main value of this assumption for our analysis
is that the firm has bonds outstanding whose maturities range from 0 to T,
and this allows us to determine the full-term structure of bond yield spreads.
In addition, this assumption implies that the total debt service (C +
P
T
) of the
firm is time independent, which, in turn, implies that the endogenous default
threshold does not depend on time either.
24
As before, we solve the valuation problem by LSM, as described in Appendix
B. Appendix C reviews the necessary results from Franc¸ois and Morellec (2004)
and Leland and Toft (1996).
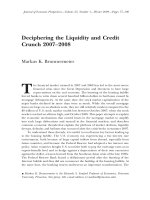
Figures 2 to 5 provide a visual summary of the results. As a benchmark, in
Figure 2 we begin by plotting our model’s liquidity spreads as a function of
time to maturity in the absence of default risk. Consistent with the results of
Amihud and Mendelson (1991), a decreasing and convex shape is obtained for
the term structure of liquidity spreads.
25
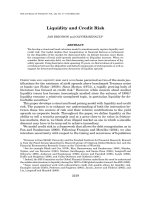
Figure 3 plots the illiquidity spread as a function of the maturity of the bond
for different levels of γ , the mean number of active dealers. This graph clearly
shows how taking the maturity of the bond into account is crucial for comput-
ing a liquidity spread. Moreover, we see that the spreads can be substantial,
especially for short-term bonds. Indeed, the decreasing and convex shape of the
term structure of liquidity spreads that emerges in this figure can help recon-
cile structural models with the nontrivial short-term spreads we observe in the
marketplace.
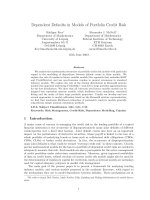
Figure 4 plots term structures of liquidity spreads for various levels of the
annualized intensity of a liquidity shock, ζ . Again, we find that short-term
spreads can be substantial and that the term structure is downward sloping.
24
Given that we need to compute the ex post optimal default policy numerically, solving the
problem of the bondholder (taking into account the path-dependent nature of our model of distress
together with bargaining and the correlated dynamics of two state variables) would be virtually
impossible if the default policy were a general function of time.
25
Note, however, that their study only considers the short end of the term structure.
2232 The Journal of Finance
0 5 10 15 20 25 30
0
10
20
30
40
50
60
70
80
Years to maturity
Basis points
ζ=5%
ζ=10%
Figure 2. The illiquidity spread and the annualized probability of a liquidity shock—
no default risk. The y-axis measures the yield spread in basis points and the x-axis the time
to maturity in years for individual bonds. Parameter values: r = 0.05, t = 1/12, γ = 7, φ = 0.05,
and κ = 0.5. Notation: r is the risk free rate, t is the time step, γ is the mean number of active
dealers, φ is the volatility parameter of the instantaneous liquidity shock probabilities λ
t
, and κ is
the mean reversion speed of λ
t
. Long-run mean probabilities of a liquidity shock: ζ = 0.05 (solid
line) and ζ = 0.1 (dashed line) with λ
0
= ζ .
Figure 5 plots the proportions of the total yield spread that are attributable to
default risk and liquidity risk. In particular, the figure emphasizes the impor-
tance of illiquidity on short-term spreads: For bonds with less than 2 years to
maturity, illiquidity comprises the main component of the spread. For long-term
bonds, the illiquidity component stabilizes (for this particular set of parame-
ters) at about 8% of the total spread.
IV. Empirical Analysis
In this section we ask how corporate bond data compare to our model’s pre-
dictions. First, we investigate whether liquidity spreads and credit spreads are
related in the data. Second, we wish to test whether the slope of the term struc-
ture of liquidity spreads is negative. While full structural estimation of our
model lies beyond the scope of this paper, we test the model’s implications by
regressing bond yield spreads on two sets of variables, one that controls for
Liquidity and Credit Risk 2233
0 5 10 15 20 25 30
0
50
100
150
200
250
300
γ=2
γ=6
γ=10
γ=14
γ=18
Basis points
Years to maturity
Figure 3. The illiquidity spread and the mean number of active dealers—with de-
fault risk. The y-axis measures the yield spread in basis points and the x-axis the time to
maturity in years for individual bonds. The maturity of newly issued debt is 30 years. Param-
eter values: r = 0.05, β = 0.03, d = 2, t = 1/12, C = 4, P = 80, σ = 0.20, α = 0.25, η = 0.5, φ =
0.05, ζ = 0.1, ρ =−0.5, andκ = 0.5. Notation: r is the risk free rate, t is the time step, γ is the
mean number of active dealers, φ is the volatility parameter of the instantaneous liquidity shock
probabilities λ
t
, ρ is the instantaneous correlation between asset value v
t
and λ
t
, and κ is the
mean reversion speed of λ
t
.Wesetλ
0
equal to ζ , the long-run mean instantaneous probability of a
liquidity shock.
credit risk, and one that proxies for liquidity risk. We then compare parameter
estimates across subsamples defined along credit ratings and bond maturities.
We estimate the following panel regression with fixed effects for the bond
spread y
it
of issue i at time t:
y
it
= α
i
+ β
1
VIX
t
+ β
2
SPRET
t
+ β
4
SLOPE
t
+ β
5
r
it
+ β
6
DEFPREM
t
+β
7
OTR
it
+ β
8
TLIQ
t
+ ε
it
,
where ε
it
= ρε
i,t−1
+ η
it
.
(16)
We assume that the disturbances η
it
are independently identically dis-
tributed.
26
26
See Baltagi and Wu (1999) for a detailed description of this panel model.
2234 The Journal of Finance
0 5 10 15 20 25 30
0
50
100
150
200
250
Years to maturity
Basis points
ζ= 0.1%
ζ= 5%
ζ= 10%
ζ= 15%
ζ= 20%
Figure 4. The illiquidity spread and the annualized probability of a liquidity shock—
with default risk. The y-axis measures the yield spread in basis points and the x-axis the time
to maturity in years for individual bonds. The maturity of newly issued debt is 30 years. Param-
eter values: r = 0.05, β = 0.03, d = 2, t = 1/12, C = 4, P = 80, σ = 0.20, α = 0.25, η = 0.5, γ =
7, φ = 0.05, ρ =−0.5, and κ = 0.5. The maturity of newly issued debt is 30 years. Notation: r is
the risk free rate, t is the time step, γ is the mean number of active dealers, φ is the volatility
parameter of the instantaneous liquidity shock probabilities λ
t
, ρ is the instantaneous correlation
between asset value v
t
and λ
t
, and κ is the mean reversion speed of λ
t
.Wesetλ
0
equal to ζ, the
long-run mean instantaneous probability of a liquidity shock.
In equation (16), VIX is a proxy for overall equity market volatility, SPRET is
the market return, SLOPE is the difference between long and short government
yields, r
it
is the risk-free rate with the same maturity as the corporate bond,
OTR is a dummy for younger bonds, and TLIQ is a proxy for Treasury market
liquidity. Note that this specification allows for autocorrelation in the panel
data for which we find strong evidence.
27
We run this regression on two panels
that we construct from separate data sources, namely, monthly observations
from Datastream and NAIC transactions data. The first panel consists of 522
zero-coupon bond issues that yield a total of 35,198 monthly price observations.
The data span the period 1986 to 1996. The NAIC data complete the first panel
by covering the period 1996 to 2001 with 37,861 transaction prices for bonds
27
A test developed by Wooldridge (2001) was used.
Liquidity and Credit Risk 2235
0 5 10 15 20 25 30
0
0.1
0.2
0.3
0.4
0.5
0.6
0.7
0.8
0.9
1
Years to maturity
Liquidity risk
Default risk
Figure 5. The relative size of the default and nondefault components. The figure shows the
following ratios:
s
1
+s
2
s
1
+s
2
+s
3
(liquidity risk) and
s
3
s
1
+s
2
+s
3
(default risk). The component s
1
measures
the impact on the value of possible liquidity shocks while the firm is solvent, s
2
measures the impact
of illiquidity on bargaining given in distress, and s
3
measures the default component of the yield
spread. The x-axis represents the time to maturity in years for individual bonds. The maturity of
newly issued debt is 30 years. Parameter values: r = 0.05, β = 0.03, d = 2, t = 1/12, C = 4, P =
80, σ = 0.20, α = 0.25, η = 0.5, γ = 7, ζ = 0.10, φ = 0.05, ρ =−0.5, and κ =0.5. Notation: r is the
risk free rate, t is the time step, γ is the mean number of active dealers, φ is the volatility
parameter of the instantaneous liquidity shock probabilities λ
t
, ρ is the instantaneous correlation
between asset value v
t
and λ
t
, and κ is the mean reversion speed of λ
t
.Wesetλ
0
equal to ζ, the
long-run mean instantaneous probability of a liquidity shock.
traded by U.S. insurance companies. Table II furnishes descriptive statistics
for the two samples.
28
Note that the second sample demonstrates a much more
even coverage of credit rating categories than the first, which is concentrated in
very high-quality issues. As a result, the level and variation of yield spreads are
higher in the NAIC data. A priori, we expect the NAIC database to offer a more
promising study of the relationship between credit quality and the illiquidity
components of bond spreads.
28
We have excluded bonds with less than 1 year to maturity because of the extreme sensitivities
of short bond spreads to small changes in price and thus to noise in the data. We also exclude all
bonds with option features and sinking funds.
2236 The Journal of Finance
Table II
Descriptive Statistics of Bond Issues
The spread y
it
is expressed in basis points, the maturity and age of the bonds in years, and the
credit rating is based on a numerical scale ranging from 1 to 23, where 1 represents an S&P rating
of AAA and 23 is the rating of a defaulted bond.
y
it
(%) Maturity Age Credit Rating
Panel A: Datastream Zero-Coupon Monthly Data from January 1986 to December 1996
Mean 0.40 12.4 5.3 1.3
Median 0.31 11.9 5.2 1.0
Maximum 10.17 29.7 16.3 8.0
Minimum 0.01 1.0 0.0 1.0
SD 0.41 7.0 3.0 0.7
Skewness 8.02 0.3 0.6 3.2
Kurtosis 117.65 2.1 3.3 16.1
Panel B: NAIC Transaction Data from January 1996 to December 2001
Mean 2.13 12.1 3.4 8.8
Median 1.27 8.6 2.8 9.0
Maximum 37.70 100.1 19.6 23.0
Minimum 0.20 1.0 0.0 1.0
SD 3.63 10.6 2.8 4.2
Skewness 5.9 3.6 1.1 1.5
Kurtosis 43.2 25.9 4.4 6.2
We calculate spreads as the difference between the risky bond yield and the
risk-free rate obtained by the Nelson and Siegel (1987) procedure. Appendix D
contains a more detailed description of the construction of spreads.
Table III provides an overview of the expected relationships between our
liquidity and nonliquidity proxies and bond yield spreads. Again, we utilize
Table III
Expected Signs of Regression Variables
To proxy market volatility we use the Chicago Board Options Exchange VIX index, which is a
weighted average of the implied volatilities of eight options with 30 days to maturity. We use
the monthly S&P 500 return (SPRET) as a proxy for changes in firms’ asset values. We use the
difference between Moody’s Baa and Aaa-rated bond yield indices (DEFPREM) as an additional
proxy for the probability of financial distress in the economy. To proxy for market liquidity, we
employ TLIQ, the yield differential between the previous long bond and the most recently issued
30-year bond. To proxy for individual issue liquidity, we use a dummy (OTR) that indicates whether
the bond was issued in the last 2 months. A “+”ora“−” indicates an expected positive coefficient
estimate for that variable. Two signs separated by a slash (e.g. +/++) indicate the differences in
the expectations according to the line heading (e.g., High/low rating).
VIX SPRET SLOPE r
it
DEFPREM OTR TLIQ
All +− −− + −+
High/low rating +/++ −/−− −/−− −/−− +/++ −/−− +/++
Short/long maturity +− −/−− − + −−/−++/+
Liquidity and Credit Risk 2237
five variables in order to capture variations in the bond yield spreads that are
not attributable to liquidity risk. Specifically, we include measures of stock
market return and volatility, two Treasury term structure variables, and a
metric for the aggregate default risk in the economy. We then add a proxy for
the liquidity of each individual issue, and a proxy for the liquidity of the fixed
income markets as a whole.
A. Results
The issues we wish to examine are whether there is a relationship between
the illiquidity and credit risk components of spreads, and whether the term
structure of liquidity spreads is decreasing. We address these questions by com-
paring parameter estimates for our liquidity proxies in subsamples defined by
credit ratings and maturities. Bonds with a maturity that exceeds the average
maturity of 12 years are placed in a subsample of “long” bonds. We present the
regression results in Table IV for the zero-coupon bonds and in Table V for the
NAIC data.
For the zero-coupon data set, the high rating category contains AAA bonds
and the low category contains the remaining bonds.
29
For the regression
that consists of all yield spread observations, we note that almost all the
nonliquidity-related coefficient estimates are signed consistent with our ex-
pectations and with the implications of structural credit risk models.
30
Stock
market volatility is significantly and positively associated with the level of yield
spreads, except for AAA bonds, whose spreads are unlikely to be driven mainly
by default risk. Structural models of default risk derive high equity volatilities
from high leverage.
We obtain a significant negative relationship between S&P 500 returns and
yield spreads. A positive return is likely to be associated with a decrease in
leverage and consequently, in the default probability and spread. This finding
is robust across all subsamples except for long maturity bonds, for which the
parameter estimates are still negative but insignificant.
The level of the risk-free interest rate is always negatively related to the
spread levels, in line with Duffee (1999). The relationship is more marked for
firms with a low credit rating and for bonds with a short maturity. The SLOPE
variable behaves similarly.
Not surprisingly, the aggregate market default premium, as measured by the
spread between Moody’s Baa and Aaa yield indices, is positively related to the
level of individual bond spreads. Again, the impact is larger for issues with a
lower credit rating.
29
The ratings in the second category range from AA+ to BBB+.
30
Note that the reported R
2
measure the explained variation in yield spreads not captured by
the fixed effects. Take for example the first regression in Table IV. The reported R-square is 6.39%.
If this regression had been run instead as a standard pooled OLS regression with issuer dummies,
the R-square would be more aligned with those reported in previous studies such as Campbell and
Taksler (2003), in the range of 30% to 40%.
2238 The Journal of Finance
Table IV
Differential Impact of Liquidity Proxies in Rating and Maturity Subsamples
The results are based on the following panel regression during the period between January 1986 and December 1996:
y
it
= α
i
+ β
1
VIX
t
+ β
2
SPRET
t
+ β
4
SLOPE
t
+ β
5
r
it
+ β
6
DEFPREM
t
+ β
7
OTR
it
+ β
8
TLIQ
t
+ ε
it
where ε
it
= ρε
i,t−1
+ η
it
,
where VIX denotes the implied volatility index, SPRET is the monthly S&P 500 return, SLOPE is the difference between the 10- and 2-year Treasury yields, r
it
is the Treasury rate that corresponds to the maturity of the particular bond, DEFPREM is the difference between Moody’s Baa- and Aaa-rated corporate bond
yield indices. OTR is a dummy that indicates whether a given bond is on-the-run, assumed to mean less than 2 months of age. TLIQ denotes the basis point
difference in yield between the most recently issued 30-year Treasury bond and the yield on the next-most recent bond. Due to the presence of serial correlation
in the time series for individual bond spreads, we include an autocorrelated error structure. The first line reports the coefficient estimates and the row below
the t-statistics. A superscript
∗
or
∗∗
indicates significance at the 95% and 99% confidence levels, respectively. Long bonds are defined as those with a maturity
exceeding 12 years. The high rating category contains all AAA-rated bonds and the lower category all the others.
VIX SPRET SLOPE r
it
DEFPREM OTR TLIQ N R
2
All 0.00078
∗∗
−0.00059
∗∗
−0.01644
∗∗
−0.03964
∗∗
0.25139
∗∗
−0.10313
∗∗
35,476/522 6.39%
3.85 −3.94 −4.15 −18.36 23.33 −9.56
0.00074
∗∗
−0.00050
∗∗
−0.01649
∗∗
−0.03724
∗∗
0.25541
∗∗
0.12422
∗∗
6.34%
3.64 −3.33 −4.15 −16.99 23.48 5.56
Low rating 0.00321
∗∗
−0.00198
∗∗
−0.04740
∗
−0.12717
∗∗
0.56290
∗∗
−0.32733
∗∗
5,073/77 2.64%
3.86 −2.78 −2.14 −12.16 10.90 −2.79
0.00361
∗∗
−0.00158
∗
−0.04411
∗
−0.12208
∗∗
0.56578
∗∗
0.20652
∗
2.39%
3.92 −2.17 −1.97 −11.32 10.94 2.05
High rating −0.00061
∗∗
−0.00043
∗∗
−0.00702
∗
−0.01839
∗∗
0.13792
∗∗
−0.08533
∗∗
30,399/448 4.56%
−4.18 −4.18 −2.50 −11.91 18.18 −13.06
−0.00064
∗∗
−0.00039
∗∗
−0.00754
∗∗
−0.01703
∗∗
0.13868
∗∗
0.06031
∗∗
4.65%
−4.38 −3.81 −2.67 −10.90 17.95 3.87
Short maturity 0.00227
∗∗
−0.00096
∗∗
−0.01663
∗
−0.05881
∗∗
0.30373
∗∗
−0.14290
∗∗
17,828/356 5.34%
6.52 −3.69 −2.36 −17.03 15.50 −5.76
0.00225
∗∗
−0.00087
∗∗
−0.01706
∗
−0.05676
∗∗
0.30498
∗∗
0.09286 5.41%
6.45 −3.30 −2.41 −16.14 15.43 1.41
Long maturity −0.00100
∗∗
−0.00017 −0.02687
∗∗
−0.01426
∗∗
0.17176
∗∗
−0.08639
∗∗
17,516/297 12.8%
−4.95 −1.13 −7.11 −5.90 16.67 −9.57
−0.00105
∗∗
−0.00008 −0.02746
∗∗
−0.01147
∗∗
0.17705
∗∗
0.13821
∗∗
12.29%
−5.17 −0.51 −7.22 −4.67 16.99 6.20
Liquidity and Credit Risk 2239
Table V
Differential Impact of Liquidity Proxies in Rating and Maturity Subsamples
NAIC Transaction Data 1996–2001
The results are based on the following panel regression:
y
it
= α
i
+ β
1
VIX
t
+ β
2
SPRET
t
+ β
4
SLOPE
t
+ β
5
r
it
+ β
6
DEFPREM
t
+ β
7
OTR
it
+ β
8
TLIQ
t
+ ε
it
where ε
it
= ρε
i,t−1
+ η
it
,
where VIX denotes the implied volatility index, SPRET denotes the monthly S&P 500 return, SLOPE denotes the difference between the 10- and
2-year Treasury yields, r
it
is the Treasury rate that corresponds to the maturity of the particular bond, and DEFPREM is the difference between
Moody’s Baa- and Aaa-rated corporate bond yield indices. OTR is a dummy that indicates whether a given bond is on-the-run, and is assumed to
mean less than 2 months of age. TLIQ denotes the basis point difference in yield between the most recently issued 30-year Treasury bond and the
yield on the next most recent. Due to the presence of serial correlation in the time series for individual bond spreads, we include an autocorrelated
error structure following Baltagi and Wu (1999). The first line reports the coefficient estimates and the row below the t-statistics. A superscript
∗
or
∗∗
indicates significance at the 95% and 99% confidence levels, respectively. Long bonds are defined as those with a maturity exceeding 12 years. The
last column (N) indicates the size of the panel as the total number of observations and as the number of cross-sectional units.
VIX SPRET SLOPE r
it
DEFPREM OTR TLIQ R
2
N
All 0.063
∗∗
0.035
∗
−0.189
∗∗
−0.466
∗∗
1.410
∗∗
3.50% 35,983/1592
16.93 2.35 −4.81 −20.74 10.44
0.062
∗∗
0.035
∗
−0.191
∗∗
−0.465
∗∗
1.384
∗∗
−0.281
∗∗
3.57%
16.64 2.32 −4.88 −20.66 10.23 −2.74
0.066
∗∗
0.031
∗
−0.202
∗∗
−0.470
∗∗
1.553
∗∗
−1.196 3.53%
17.20 2.04 −4.95 −20.64 9.33 −1.93
0.077
∗∗
0.040
∗∗
−0.050 −0.476
∗∗
2.149
∗∗
3.44%
21.27 2.62 −1.34 −20.90 4.25
AAA to AA−−0.020 −0.021 −0.405
∗∗
−0.494
∗∗
0.345 −0.104 0.69% 2,737/124
rating −1.53 −0.47 −3.57 −4.76 0.78 −0.38
−0.018 −0.026 −0.454
∗∗
−0.449
∗∗
1.137
∗
−4.378
∗
0.87%
−1.33 −0.56 −3.89 −4.29 2.04 −2.31
−0.016 −0.024 −0.392
∗∗
−0.515
∗∗
−2.031 0.68%
−1.19 −0.53 −3.47 −5.21 −1.35
(continued)
2240 The Journal of Finance
Table V—Continued
VIX SPRET SLOPE r
it
DEFPREM OTR TLIQ R
2
N
A+ to BBB− 0.030
∗∗
0.019 −0.383
∗∗
−0.504
∗∗
0.702
∗∗
−0.304
∗∗
2.60% 25,390/1,143
rating 7.06 1.15 −9.13 −16.27 4.66 −2.95
0.033
∗∗
0.017 −0.401
∗∗
−0.497
∗∗
1.006
∗∗
−1.657
∗∗
2.61%
7.76 1.03 −9.24 −15.87 5.38 −2.51
0.037
∗∗
0.020 −0.322
∗∗
−0.537
∗∗
0.446 2.58%
8.55 1.20 −7.88 −17.59 0.84
BB+ to B− 0.159
∗∗
0.063 0.161 −0.681
∗∗
2.733
∗∗
−0.820
∗
10.93% 5,849/235
rating 13.84 1.50 1.29 −13.02 6.64 −2.11
0.165
∗∗
0.058 0.183 −0.688
∗∗
2.620
∗∗
0.613 10.59%
14.03 1.37 1.41 −12.98 5.40 0.32
0.195
∗∗
0.079 0.462
∗∗
−0.632
∗∗
5.861
∗∗
10.27%
18.81 1.89 3.88 −12.12 3.61
CCC+ to D 0.169
∗∗
−0.046 1.70739
∗∗
−1.122 3.981
∗∗
0.172 12.20% 1,629/89
rating 6.27 −0.44 6.11 −0.10 4.03 0.19
0.179
∗∗
−0.038 1.955
∗∗
−1.173
∗∗
1.902 12.607
∗∗
12.58%
6.45 −0.36 6.77 −9.30 1.63 2.91
0.201
∗∗
−0.024 2.139
∗∗
−1.134
∗∗
16.340
∗∗
12.64%
8.28 −0.23 8.01 −9.14 4.43
Liquidity and Credit Risk 2241
The signs of the OTR dummy and TLIQ are consistent with our interpre-
tation that they proxy for liquidity. On average, a recently issued bond in the
full sample can expect to trade at around 10 basis points less than if it were
more seasoned. A greater illiquidity premium in Treasury markets translates
to higher yield spreads in the corporate bond market. However, this effect is
weaker since a 10 basis point-increase in TLIQ tends to increase yield spreads
by little more than one basis point. The OTR parameter estimates are signifi-
cant in all regressions, and the TLIQ estimates are significant in all cases but
one.
The parameter estimate for the OTR dummy is more than three times larger
in the subsample of bonds with a low credit rating relative to the subsample
of AAA bonds. This suggests that off-the-run credit-risky bonds have to re-
ward their holders with an additional yield, which can be in excess of three
times higher than the corresponding extra yield for high credit quality bonds.
Similarly, the impact of TLIQ is larger in the low rating sample by a similar
magnitude. Both of these findings support our model’s finding of a positive
relationship between credit and liquidity risk.
We now turn to a discussion of the results for the NAIC transaction data.
We run the same panel regression for the full sample and for the subsamples,
again defined by credit rating and maturity. In the full sample, the results for
the default risk proxies are similar to those for the zero-coupon bond data, with
the exception of the market return. Surprisingly, the coefficient estimate for the
S&P 500 return is positive and significant.
31
The other variables enter with the
expected signs.
The OTR dummy enters with a negative sign and is statistically significant.
The coefficient estimate is greater than in the zero-coupon bond sample; on
average, a newly issued bond trades at almost 30 basis points less than an
older one, after controlling for default risk. However, the average credit quality
in this sample is much lower. When we consider the more comparable subsample
of bonds with S&P ratings between AAA and AA−, we find that the coefficient
estimate is close to 10 basis points, which, in turn, is remarkably close to the
estimate for the zero-coupon bonds. In the next rating category (A+ to BBB−),
the coefficient estimate roughly trebles. For BB+ to B− ratings, the estimate
increases further, to the extent that younger bonds have spreads that are lower,
on average, by over 80 basis points. In the CCC+ to D category, the coefficient
is positive but insignificant.
The results for the TLIQ variable are somewhat more difficult to interpret.
For the standard regression in the full sample, the coefficient is negative and
marginally significant. When we look across the subsamples, the coefficient
estimate is negative for the two highest rating categories. As credit quality
declines, the coefficient estimate becomes positive and is largest for the poor-
est quality bonds. One explanation for this variable’s surprising negativity for
31
This result is consistent with the findings of Campbell and Taksler (2003). They find that
although equities performed strongly during the late 1990s, yields on corporate bonds relative to
Treasuries increased. They attribute this difference in performance to an increase in idiosyncratic
volatility.
2242 The Journal of Finance
high-quality bonds may be that it is correlated with DEFPREM, the market
default premium (the sample correlation coefficient is 0.54 between 1996 and
2001, while it is only 0.17 between 1986 and 1996). If we drop DEFPREM in
the regression, the TLIQ variable behaves as for the zero-coupon bond data.
For the entire sample, TLIQ is positive, and significant and, with the excep-
tion of one rating category, it is uniformly increasing in the default risk of the
bonds.
In addition, we perform a case study of the turbulent market conditions preva-
lent in the late summer and autumn of 1998 that surrounded Russia’s default
on its bonds. We consider the first of the above regression models for corpo-
rate bond spreads during three periods. Specifically, we study first the period
from January 1, 1998 to August 14, 1998—the Friday preceding the Monday on
which the Russian government defaulted on its debt. Second, we examine the
crisis period, which we define as August 17, 1988 to November 20, 1988. We
then consider a post-crisis period from the November 23, 1998 to October 29
of the following year. Table VI reports the results for the regressions for each
of the three periods for different rating categories. Note that the much smaller
sample sizes here cause us to lose power. As a result, we do not obtain statistical
significance for the illiquidity proxy (OTR). However, it is still interesting to
consider the behavior of the coefficient estimate, which is consistently negative
as in the full sample regressions for the zero-coupon and NAIC data sets. For all
bonds, it roughly trebles during the crisis period and then drops to a level about
50% higher than the pre-crisis level. For investment grade bonds, the pattern
is the same but with a less dramatic increase during the crisis period than for
the speculative grade subsample (the coefficient estimate jumps to −100 and
−158 basis points, respectively).
Overall, the results for the two data sets and for the Russian default case
study suggest a clear, positive correlation between the default and liquidity
components of bond yield spreads. This is consistent with our model when
shareholders have bargaining power in a workout. It is interesting to note
that the link between the two spread components is apparent in both data sets,
notwithstanding their differences in coverage of credit quality and time.
Turning to the shape of the term structure of liquidity spreads, we find in the
first data set (see Table IV) that the impact of the OTR dummy differs across
bond maturities. Short-term bonds benefit three times more from being on the
run than long bonds, suggesting that the liquidity component of yield spreads
diminishes with maturity.
32
The difference between the parameter estimates
32
The cut-off for long and short maturity bonds was taken to be approximately the median
maturity. To see whether this choice is critical to our results, we rerun regressions for maturity
segments ranging from 0–2, 2–4 and so on up to 28–30 years. The coefficient estimates for the OTR
variable indicate that newly issued bonds with less than 2 years to maturity on average have yield
spreads lower by about 60 basis points than their seasoned counterparts. This yield differential
decreases smoothly for the next three maturity segments to reach approximately 10 basis points.
For bonds longer than 8 years, the yield differential oscillates between 5 to 15 basis points. No clear
pattern for the TLIQ coefficients emerges.
Liquidity and Credit Risk 2243
Table VI
The Russian Default/LTCM
The results are based on the following regression:
y
it
= α
i
+ β
1
VIX
t
+ β
2
SPRET
t
+ β
4
SLOPE
t
+ β
5
r
it
+ β
6
DEFPREM
t
+β
7
OTR
it
+ β
8
TLIQ
t
+ ε
it
,
where ε
it
= ρε
i,t−1
+ η
it
.
where VIX denotes the implied volatility index, SPRET is the monthly S&P 500 return, SLOPE is the
difference between the 10- and 2-year Treasury yields, r
it
is the Treasury rate that corresponds to the
maturity of the particular bond and DEFPREM the difference between Moody’s Baa- and Aaa-rated
corporate bond yield indices. OTR is a dummy that indicates whether a given bond is on-the-run,
and is assumed to mean less than 2 months of age. We include an autocorrelated error structure
following Baltagi and Wu (1999). The first line reports the coefficient estimates and the row below
the t-statistics. A superscript
∗
or
∗∗
indicates significance at the 95% and 99% confidence levels,
respectively. Long bonds are defined as those with a maturity exceeding 12 years.
VIX SPRET SLOPE r
it
DEFPREM OTR
Panel A: All
Run-up (January 1 1998– −0.044 −0.095 1.531 −2.329
∗∗
7.785 −0.320
August 14 1998) −1.30 −0.97 1.28 −3.79 1.66 −1.11
Crisis period (August 17 1998– −0.008 −0.073 0.668 −1.392
∗∗
−1.669 −1.191
∗
November 20 1998) −0.35 −0.94 0.72 −3.31 −0.91 −2.24
Post crisis (November 23 1998– 0.004 −0.053 1.713 −1.207
∗∗
0.150 −0.495
∗
October 29 1999) 0.22 −1.26 1.44 −6.63 0.13 −1.98
Panel B: Investment Grade
Run-up (January 1 1998– −8.196 −0.160 1.952 −2.321
∗∗
10.126 −0.376
August 14 1998) −2.16
∗
−1.45 1.47 −3.40 1.93 −1.20
Crisis period (August 17 1998– 0.577 −0.085 0.675 −1.255
∗∗
−1.273 −0.999
November 20 1998) 0.22 −1.00 0.66 −2.73 −0.63 −1.77
Post crisis (November 23 1998– −0.038 −0.007 2.450 −1.169
∗∗
1.119 −0.427
October 29 1999) −0.02 −0.15 1.84 −5.82 0.87 −1.59
Panel C: BB+ To D
Run-up (January 1 1998– 9.146 0.161 0.094 −2.174 −0.807 −0.187
August 14 1998) 1.21 0.75 0.03 −1.58 −0.08 −0.27
Crisis period (August 17 1998– −4.864 −0.048 0.335 −1.598 −2.727 −1.582
November 20 1998) −0.70 −0.27 0.13 −1.22 −0.72 −0.81
Post crisis (November 23 1998– 2.416 −0.200 −0.857 −1.099
∗∗
−2.836 −0.366
October 29 1999) 0.59 −2.15 −0.33 −2.73 −1.11 −0.64
for TLIQ is not statistically significant. A similar analysis on the NAIC trans-
actions data (not reported here) reveals no discernible pattern across maturity
subgroups.
V. Concluding Remarks
We develop a model to illustrate the impact of liquidity risk on the yield
spreads of corporate bonds. The model has a number of interesting features.