Nghiên cứu ứng dụng mô hình khu vực đánh giá phát tán và ảnh hưởng phóng xạ hạt nhân tới lãnh thổ việt nam từ các nguồn xuyên biên giới TA
Bạn đang xem bản rút gọn của tài liệu. Xem và tải ngay bản đầy đủ của tài liệu tại đây (649.25 KB, 35 trang )
MINISTRY OF EDUCATION
AND TRAINING
MINISTRY OF SCIENCE AND
TECHNOLOGY
VIETNAM ATOMIC ENERGY INSTITUTE
RESEARCH AND APPLICATION OF THE REGIONAL MODEL
(FLEXPART-WRF) IN ASSESSING THE ATMOSPHERIC
DISPERSION AND EFFECTS OF RADIOACTIVE FALLOUTS ON
THE VIETNAMESE TERRITORY
Major: Nuclear and Atomic Physics
Code: 9 44 01 06
SUMARY OF DOCTORAL DISSERTATION OF PHHYSICS
Hanoi - 2022
The name of the postgraduate training institution:
Nuclear training center, Vietnam Atomic Energy Institute 140
Nguyen Tuan, Thanh Xuan, Hanoi
Supervisor:
1 Dr
Vietnam Atomic Energy Institute
2 Dr
Institute of Geophysics, Vietnam Academy of Science and
Technology
Introduction
1 Motivation
Forecasting and calculating the trajectory and impact on the environment of
the radioactive plume from nuclear incidents are absolutely necessary To
improve the efficiency of forecasting and the calculation of near-range
radioactive emissions require more detailed and comprehensive studies of
regional influences on atmospheric dispersion such as:
- Initial conditions (resolution, meteorological data, source terms );
- Microphysics factors of the process of radionuclide dispersion in the
atmosphere;
- Sensitivity and reliability of physical-mathematical models for radionuclide
dispersion in the atmosphere;
For the above-mentioned reasons, the research topic entitled: “Research and
application of the regional model (FLEXPART-WRF) in assessing the
atmospheric dispersion and effects of radioactive fallouts on the Vietnamese
territory” was chosen
2 Dissertation objectives
The purpose of the dissertation is to find out the radioactive dispersion
assessment model suitable for the conditions of Vietnam, which is expressed by four
specific objectives:
- Study the appropriate mathematical model for the regional radioactive
emission assessment;
- Study the regional meteorological model and the factors that affect the
accuracy of meteorological conditions in the area ;
- Verifying the calculation of radioactive dispersion in the atmosphere
through the accident of the Fukushima Daiichi nuclear power plant;
1
- Applying the selected model to assess the impact on the Northern area of
Vietnam in case of a nuclear incident occurs from the Fangchenggang/China
nuclear power plants
3 Work performed in the dissertation
With the above-mentioned general objectives, the dissertation needs to
address the following issues:
- Studying and selecting the simulation model, evaluate the radioactive
dispersion in the atmosphere (FLEXPART-WRF);
- Studying the influence of regional factors such as topography, vegetation,
regional meteorological field, and microphysical parameters in the atmosphere,
which affect the accuracy and reliability of the model;
- Evaluating the reliability of the model through the simulation results of
radiation emission from the Fukushima incident with the results from Futaba and
Nahara monitoring stations using the Taylor diagram
- Applying suitable configurations to simulate the incident of the
Fangchengang nuclear power plant in March 2020 affecting Vietnam, including
the impact on the environment and the population in the Northern area of
Vietnam
4 Scientific impact of the dissertation
4 1 Scientific impact
- The application of the area model (Flexpart-WRF) to evaluate and simulate
the short-range radioactive dispersion in the atmosphere is appropriate and gives
results that have a high correlation with real monitoring results;
- Select the microphysics configuration including topography, vegetation,
regional meteorological field, microphysical parameters in the atmosphere (from
48 trials in the dissertation) for the regional meteorological model WRF and
short-range radiation emission assessment simulation code (Flexpart-WRF);
- Assess the impact on the environment and citizens in the Northern area of
Vietnam in the case of a cross-border nuclear incident
2
4 2 Major results
- Perform 48 tests (24 microphysics configurations with 02 source terms) to
evaluate the sensitivity and correlation of the regional model in the simulation
and assessment of radioactive material dispersion in the atmosphere
- Select a number of configuration sets to apply to the simulation problem for
the North Vietnam region
- Calculation results of the level of impact on Vietnam from the hypothetical
nuclear accident at Fangchenggang NPP
5 The practical application of the dissertation
The contents of the dissertation are the basis for applying calculation and
simulation tools to the reality of command support to the Head of the Ministry
of National Defense and The National Committee for Search and Rescue
(VINASARCOM) in response to transboundary nuclear incidents
6 Dissertation layout
The dissertation consists of 136 pages, 12 tables, 73 figures, 04 published
papers, 69 references, and 8 pages of appendices and is distributed as follows:
Introduction: 03 pages, introducing the motivation, purposes, objectives, and
scope of research, scientific and practical significance of the dissertation; Chapter
1: Assessment of the risk of impacts from transboundary nuclear incidents and the
literature review of research and assessment of radioactive dispersion in the
atmosphere (28 pages); Chapter 2: Research Methodology (32 pages); Chapter 3:
Results and discussion (48 pages); Conclusions and recommendations (02 pages);
List of published papers during dissertation, references, and appendices
3
CHAPTER 1 LITERATURE REVIEW OF RISK ASSESSMENT OF
THE TRANSBORDER NUCLEAR INCIDENTS
1 1 Evaluating the effect risk from transnational NPP accidents
The site and layout of nuclear power facilities must fulfill extremely high
safety standards while also meeting economic, technological, social, and
environmental concerns, with a focus on reducing consequences According to
experts, China's nuclear power program is being implemented too rapidly in
terms of both quantity and variety of technology, but it is essentially replicating
established technologies Meanwhile, the risk management system for nuclear
safety and security remains restricted, possibly generating substantial operational
hazards When incidents occur, nuclear power facilities have a wide-ranging
detrimental impact, including in Vietnam, as follows:
- In the case of a nuclear accident at the Fangchenggang Nuclear Power Plant,
the areas of Fangcheng, Qinzhou, Beihai, and Guangxi within a 30km radius of
the incident would be exposed to radiation, affecting nearby regions and
territories as follows: If the incident occurs in winter, with the Northeast region's
topographical characteristics being the midlands and low hills, with many arcs
extending to the north and in Tam Dao/Vinh Phuc, combined with the Northeast
monsoon, the entire Northeast region, and the Red River Delta will be affected
by radioactive fallout within 10 to 12 hours In the period of 02 - 03 days, it may
affect most of the North of Vietnam; If the incident occurs in the summer: the
wind direction will turn to the north, so it will affect most of Guangxi and part
of Ha Giang, Cao Bang/Vietnam
Water sources: Due to the features of ocean currents, radioactive compounds
may follow coastal currents within 24 hours, producing radioactive pollution in
the Beihai region, the Leizhou peninsula, the northern portion of Hainan island,
and all coastal provinces in North and Central Vietnam
4
- In the event of a nuclear accident at the Changjiang and Yangjiang nuclear
power plants, Hainan and Yangjiang islands/Guangdong province will be
immediately exposed to radiation, affecting nearby territories In winter,
monsoon and ocean currents in the northeast-southwest direction will bring
radioactive dust to the North Sea, Leizhou peninsula, north, and northwest of
Hainan island/China, as well as the Hoang Sa archipelago and the central
provinces of Vietnam; in summer, winds and ocean currents in the Northwest
and Southwest - Northeast directions will bring radioactive dust to infect the
Beihai area, Leizhou peninsula, Northwest of Hainan island/China, and the
Northern coastal provinces of Vietnam
- When a nuclear disaster (nuclear reactor explosion) happens, the amount of
damage is several times larger, destroying human life and the environment
within a 30km radius and leaving environmental impacts
1 2 Studies on atmospheric radioactive dispersion
Lessons from the Fukushima nuclear power plant accident in March 2011
highlight the critical importance of environmental radiation monitoring,
simulation, calculation, and assessment of radioactive material emissions from
nuclear power plants in the preparation and response to radiation and nuclear
incidents Many research groups and organizations throughout the globe have
undertaken extensive study in the area of modeling and assessment of radioactive
material dispersion in the atmosphere as a result of nuclear plant mishaps
1 2 1 Literature review
Prior to the Fukushima nuclear plant accident, researches were conducted to
assess the dispersion ability and compute the movement trajectory of particles
(aerosols) in the atmosphere Fast et al [1] utilized the findings of a WRF model
that simulated circulation fields in central Mexico in 2006 In 2011, Foy et al used
the FLEXPART-WRF model to investigate the movement and transformation of
5
aerosol particles (exhaust gases) in metropolitan Mexico[2] Zarauz and Pasken
(2010) utilized the WRF model to simulate meteorological fields for the
computation of the CALPUFF and HYSPLIT gas emission models to analyze
pollution dispersion in the atmosphere Angevine et al (2013) investigated the
transport of contaminants in the California region using the Lagrangian
FLEXPART particle dispersion model (2015) utilized the FLEXPART-WRF
model to simulate NOx dispersion in the atmosphere over Ranchi, India's
complicated terrain [6]
a) Study on the radioactive emission from the Fukushima nuclear plant incident
on a local-scale
In 2012, Katata et colleagues utilized the GEARN software's Lagrange particle
dispersion model to simulate radioactive particles I-131 and Cs-137 in a 190 km2
region around the Fukushima Daiichi nuclear power plant [7] Srinivas et al (2012)
[8] published a simulation of regional-scale air dispersion of radioactive substances
from the Fukushima Dai-ichi nuclear power plant accident Furthermore,
Korsakissok et al conducted research on "studying and evaluating the sensitivity of
localized air dispersion and surface deposition from the Fukushima nuclear accident"
[61] Christoudias et al (2014) employed the EMAC (atmospheric circulation
model) model with a resolution of 50 km to estimate the worldwide risk of
radioactive leaks into the atmosphere from future radioactive incidents [9]
b) Study the radioactive emission on a regional-scale
Terada et al constructed various regional-scale analytical models with the goal
of analyzing the source terms, dispersion processes, and dosage distribution of
certain radioactive chemicals (I-131 and Cs-137) [43], the authors utilized the
GEARN software's Lagrange particle dispersion model to compute radioactive air
dispersion and re-evaluate the source and emission parameters of I-131 and Cs137 from the 2011 Fukushima nuclear plant accident H Huang et al from the
People's the Public Security University of China in China also performed regional
research, the results of which were published in the journal Atmos Chem Phys
6
in 2014 The researchers evaluated the dry and wet deposition of two isotopes, I131 and Cs-137, using the Eulerian dispersion model in the WRF-Chem program
[62]
c) Researching the process of radioactive dispersion on the global-scale
Many research groups around the world have conducted global-scale radioactive
dispersion studies, and the research of Roland Draxler et al (2015) in many
countries around the world has used many different global analytical models to
assess the extent of radiation effects after the Fukushima nuclear power plant
accident [14] Wai, K M , and Peter, K N (2015) evaluated the possibility of
the influence of radioactive Cs-137 emitted from accidents (similar to the
Fukushima accident) at nuclear power plants in southern China with different
four-season meteorological conditions using the Lagrange particle dispersion
model in HYSPLIT4 software [10] Rakesh et al (2015) utilized the
FLEXPART-WRF model to simulate radioactive material dispersion in the air
at a fictional nuclear power facility in southern France[11] Shekhar et al (2020)
conducted research and developed the "Online Nuclear Emergency Response
System" (ONERS) It is a "Decision Support System" (DSS) designed to handle
nuclear incident-related situations at Indian Nuclear Power Plant locations
1 2 2 Domestic research
From the 1980s to the 1990s, the Nuclear Research Institute (NRI) VINATOM studied the propagation of radioactive materials from nuclear power
plants With the scientific advice of Professor Pham Duy Hien and the participation
of many experts, however, the new studies only focus on understanding the
methodology and simulating the emission from the NPP to the area according to
the wind directions of the year
The Nuclear Research Institute (NRI) - VINATOM researched the transmission of
radioactive elements from nuclear power plants from the 1980s through the 1990s
The latest research, however, with the scientific assistance of Professor Pham Duy
Hien and the cooperation of many specialists, solely concentrates on
7
comprehending the technique and modeling the emission from the NPP to the
region according to the wind directions of the year
Prof Pham Duy Hien, Dr Nguyen Hao Quang, and Dr Pham Kim Long used the
Lagrange long-range particle dispersion model in 2011 to examine the spread of
radioactive substances such as Cs-137 and I-131 from the Fukushima disaster to
the Western Pacific and Southeast Asia; From 2011 to 2015, Dr Nguyen Tuan
Khai conducted studies on "Researching and assessing the environmental impact
of radiation emitted from nuclear power plants According to the study findings,
the match between the FLEXPART model and the monitoring data is good
However, there is still a difference between the estimated concentration levels and
the actual ones
1 3 Meteorological variables influence the dispersion process in the
atmosphere
Vietnam is in Southeast Asia and has borders with East Asia, the Western Pacific
Ocean, and South Asia The whole region above ranges in latitude from 10°S to
50°N and longitude from 70°E to 150°E It encompasses tropical, subtropical,
and temperate climates The troposphere is the layer where most transport and
dispersion occurs for most air pollution processes in general and radioactive
dispersal in particular The troposphere is the atmosphere's most active layer
This layer is responsible for 80% of the air mass and almost all of the water vapor
in the atmosphere Clouds, rain, and thunderstorms are all unique to this location
These are the variables that have a direct impact on the radiation beam as it
travels through the atmosphere
1 4 Atmospheric dispersion model
Commonly used dispersion models include the Gaussian particle beam
model, the Gaussian particle bubble model, the Lagrangian seed dispersal model,
the Eulerian dispersion model, and computational fluid dynamics (CFD)
modeling The current variety of atmospheric dispersion models available spans
from basic to complicated The unique needs of radiation risk assessment and
8
emergency response must be identified to understand how dispersion models
may be successfully implemented
Figure 1 1 Model types: a) Mean orbital model; b) Eulerian box model; c) Gaussian
particle bubble model; d) Lagrangian particle dispersion model
Table 1 1 Syndissertation of dispersion models in the atmosphere
Recommended
< 1 km
1-10 km
10-100 km
100-1 000
km
-
Gaussian
Puff
Eulerian
Complex terrain
CFD
Lagrangian
Lagrangian
Eulerian
Long-range dispersal
-
Gaussian
Gaussian
Eulerian
Free dispersal
-
Lagrangian
Lagrangian
Lagrangian
Urban area
CFD
CFD
Eulerian
Eulerian
Direct risk assessment
9
Chapter 2 MATERIALS AND METHODS
2 1 WRF meteorological model
WRF is a modeling system used for forecasting and analytical purposes on a
regional to global scale WRF offers many parameters for boundary layer
processes, convection, microphysics, radiation, surface processes, and other
possibilities The forecast scale of the model is quite broad, spanning from
meters to hundreds of kilometers, and includes numerical forecasting (NWP)
research
and
techniques,
data
assimilation
and
physical
element
parameterization, modeling, and modeling Dynamic downscaling climate
simulations, air quality research and evaluation, coupled ocean-atmospheric
models, and ideal simulations (such as boundary layer vortex, convection,
pressure waves, etc ) Because of the benefits listed above, the WRF model is
utilized in atmospheric research and operational forecasting in the United States
and other regions of the globe
Figure 2 1 The detailed terrain with high resolution [26]
Area models (RCMs) are very significant in atmospheric research (Figure
2 1) In addition to the impact of large-scale processes, regional factors such as
mountain topography, land-ocean interactions, soil characteristics, meteorological
processes, and so on, as well as small-scale phenomena such as convection drives
- phenomena that are not simulated in detail in global models [26] The regional
model uses global model boundary conditions to detail data for the locality using
different mathematical programs known as dynamic downscaling procedures [26]
10
2 1 1 Main parameters of WRF model
a Microphysics parameterization
Microphysical processes include those that deal with water vapor, clouds, and
precipitation, and diagrams of this sort may be found in the WRF model as Kessler
diagrams, Purdue Lin diagrams, WSM 3, 4, 5, 6, Eta GCP diagrams, and Thompson
diagrams The diagrams above primarily investigate the mechanisms of water vapor,
cloud formation (liquid or condensed particles), and the creation and fall of liquid
precipitation, snow, or dew However, each scheme has its complexity and damping
factors, so evaluate whether the plans cope with ice and mixed phases The
combination of ice crystals and liquid water causes mixed-phase processing, which
aids in creating hail
b Convection parameterization
The WRF model's convective parameterization methods include Kain-Fritsch
diagrams, Betts-Miller-Janjic, and Grell-Devenyi These graphs investigate the
consequences of shallow or deep convection Their objective is to portray rising
and decreasing vertical currents inside the cloud and offsetting movements outside
the cloud These graphics are made up of separate columns and show heat and
humidity profiles and surface precipitation Some graphics may show different
cloud and precipitation field trends It is feasible to supply new trends of movement
and momentum conveyance in the future
c Land surface model
LSMs employ atmospheric information from soil layer maps, emissions from
radiation schemes, and forced precipitation from microphysical processes and
patterns Convection maps provide heat and moisture fluxes over ground points
and sea ice and interior information such as soil condition variables and ground
characteristics These fluxes give low-level boundary conditions for vertical
transport as implemented in the PBL planetary boundary layer diagram (or vertical
diffusion diagram if the PBL diagram does not run, as in the scaled vortices) It
11
should be noted that the WRF model presently does not account for the interplay
of large-scale vortices with surface fluxes
Ground models vary in their sophistication when dealing with moisture and
heat fluxes in different soil strata, and they may also adjust the effect of the plant,
roots, canopy, and snow cover predictions Although these models cannot
anticipate factor trends, they may update surface state variables such as soil surface
temperature, soil temperature profile, soil moisture profile, snow cover, and
canopy characteristics In the LSM, however, there is no horizontal contact
between neighboring points
d Planetary boundary layer
The planetary boundary layer (PBL) manages sub-grid size vertical fluxes by
transporting vortices, not just the boundary layer and out of the atmosphere
Surface fluxes from ground-to-ground and surface plots are presented The PBL
diagram defines flux profiles inside the disturbance boundary layer and the
stability layer, providing temperature, air humidity (including clouds), and lateral
movement trends across the atmospheric column These diagrams are entirely onedimensional, with a clear separation between sub-grid size vortices and solved
vortices assumed in both
e Parameterization of atmospheric radiation emission
Radiation diagrams show how the atmosphere is heated by radiation flow
divergence, long-wave radiation falling to the surface, and short-wave radiation
heating the earth's surface Infrared and thermal radiation absorbed and released by
gases and surfaces are examples of longwave emission The surface emissivity
determines the longwave radiation flux rising from the surface, which is
consequently affected by the kind of soil utilized and the soil temperature Shortwave
radiation covers wavelengths in the optical spectrum that are released by the Sun and
then absorbed, reflected, and dispersed by the Earth The quantity reflected by the
surface albedo results in an upward flux Furthermore, the distribution of CO 2, O3
clouds, and water vapor in the atmosphere all have an impact on emissions
12
2 1 2 Initial meteorological data
Currently, the development of dynamic weather models and particle dispersion
models allows for high-accuracy simulation of radioactive atmospheric
dispersion Global meteorological information has been calibrated into regional
models, which is a key step in the simulation process Using an assimilation
mechanism, the European Regional Center for Short-Term Forecasts (ECMWF)
delivers high-resolution global forecasts twice a day at 00 UTC and 12 UTC
Data from 4D-Var with 91 pressure levels [58] The ECMWF has produced new
ERA5 reanalysis data with a horizontal resolution of 31 km and 137 pressure
levels Furthermore, land surface and ocean surface data are supplied, as well as
precipitation, 2 m temperature, and atmospheric radiation [58]
2 2 FLEXPART-WRF
FLEXPART-WRF is a program that combines using input data and the entire
calculation domain with the coordinate system from the WRF model (increasing
the resolution for the dispersion simulation problem), selecting different wind
data (time-average wind, instantaneous wind); calculating and processing the
planetary boundary layer and certain surface parameters, including PBL height,
surface heat flux, friction velocity, dry and wet deposition, based on data
obtained from the real world, small, medium, and local scale to improve accuracy
in calculation and simulation results; especially the parallel computing ability for
many times higher computational efficiency than the FLEXPART versions
Figure 2 2 Schematic diagram of simulation processes for WRF-ARW and
FLEXPART-WRF atmospheric modeling
13
2 2 1 Meteorological parameters for regional-scale dispersion simulation
Table 1 describes the WRF model, which offers geographical and temporal
meteorological information as inputs to the FLEXPART-WRF model
Table 1 WRF parameters used for the FLEXPART-WRF
ZNW
Number of
Dimensions
1D
The sigma value of the full level
ZNU
1D
The sigma value of the half level
PB
3D
Base pressure value
P
3D
Perturbation of pressure
PHB
3D
Base value of gravity
PH
3D
Perturbationof gravity
T
3D
Temperature
QVAPOR
3D
Specific humidity
TKE
3D
Turbulent kinetic energy
XLAT
2D
Latitude
XLONG
2D
Longitude
MAPFAC
2D
Map factor
PSFC
2D
Surface pressure
Parameters
Description
2 2 2 Parameterization schemes
Based on previously published research from across the globe as the foundation for
choosing parameterization approaches for the microphysics process
- There are two short-wave and two long-wave radiation schemes: RRTMG scheme;
Rapid Radiative Transfer Model (RRTM) scheme
- Three planetary boundary class diagrams: the YSU scheme, the Mellor-YamadaJanjic (Eta) TKE scheme, and the MYNN 2 5 level TKE system
14
- Kessler scheme; WRF Single-Moment (WSM) 3-class basic ice scheme; WSM 6class graupel scheme: new scheme in WRF; Thompson Diagram are utilized
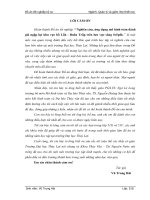
2 2 3 Source term
Release Rate of Cs-137, Bq h^-1
Within the context of the dissertation, the PhD student investigated current research
and assessment of radioactive emissions from the Fukushima nuclear power plant
event, often drawing on the findings of Katata (2015) [42] study and evaluation of
emission source terms Figure 2 3 depicts Katata's calculation of the source term Cs137 Furthermore, Teranda et al (2019) [43] re-evaluated the Cs-137 emission source
term from the Fukushima Nuclear Power Plant from March 12 to March 31, 2011
Teranda determined the source term Cs-137, which is shown in Figure 2 4
KATATA
1015
1014
1013
1012
1011
0
50
100
150
200
250
300
350
400
450
500
Time,h
Figure 2 3 Source term of Cs-137 as calculated by Katata in 2015
Figure 2 4 Source term of Cs-137 as calculated by Teranda in 2019
2 2 4 Configuration of FLEXPART-WRF
Step 1: Configure the WRF model, which includes the following steps: The
computational domain is chosen (the number of grids, the resolution, etc ) Set the
15
time, pick the parameters in the output file's findings, and select the
parameterization diagrams of the microphysical process for the WRF model
Step 2: Configure the software FLEXPART-WRF, using the following declaration
operations conducted in a file: Following the execution of the WRF model, the
calculation domains must be specified using the running results as input to the
Flexpart-Wrf software; specify simulation settings such as simulation start and
finish times, data output time, and output unit, including computing the individual
concentration of each radionuclide or the ratio between radionuclides; Adjust the
OUTGRIB data file appropriate to the specifications of the simulated region and
the resolution of the input meteorological data to set up the computed coordinate
grid in the simulation Configure radioisotope parameters
2 3 Evaluate the sensitivity and correlation coefficient of the model
2 3 1 Taylor diagram
The dissertation employed the statistical assessment approach between the
estimated values from the simulation results and the real monitoring data to check and
evaluate the dependability of the findings acquired from the models technique for
comparing model results on the time chart and concentration map Through the Pearson
correlation coefficient and standard deviation, the Taylor diagram gives statistical
information regarding the fit between the observed value and the model's outputs
The connection is shown by a Taylor diagram Mathematical diagrams explain a
statistical connection between two fields: the "test" field (typically representing the
field simulated by a model) and the "reference" field (representing the actual
observed data) (Figure 2 5)
Figure 2 5 Taylor diagram and the relationship between the coefficients in the
Taylor diagram
16
2 3 2 Radiation monitoring data
The records of Japan's Futaba and Naraha monitoring stations were utilized
in the dissertation after the nuclear accident at the Fukushima Daiichi nuclear
power plant The monitoring data is obtained from the publication of H Tsuruta
et al [46]
Figure 2 6 Location of Futaba, Naraha monitoring stations and Fukushima NPP
17
Chapter 3
RESULTS AND DISCUSSION
3 1 Simulation results of radiation dispersion from the Fukushima NPP accident
To evaluate the sensitivity of microphysical parameters in the FLEXPART-WRF
to simulate high-resolution meteorological fields and reproduce the timedependence and spatial radiation distribution at the Fukushima nuclear plant site
in March 2011, the simulation results from FLEXPART-WRF were compared
and verified with monitoring results at 02 monitoring stations namely Futaba and
Naraha/Japan The test results are shown on a Taylor chart
3 1 1 Configuration
Figure 3 1 depicts the domain of the Flexpart-WRF model, with the outside
domain at a resolution of 5km and the inner domain at a resolution of 1km Data
for boundary and baseline conditions are derived from ERA5 reanalysis data
with 0 25 degree resolution, which is updated hourly The WRF model was ran
with 51 air vertical levels and 04 soil layers; Table 2 shows the microphysics
setting The simulation runs from 21:00 UTC on March 11, 2011 to 01:00 UTC
on March 26, 2011 Teranda et al computed 02 source terms of the radioactive
isotope Cs-137 based on the analytical report of Katata et al , (2015) (2019)
Figure 3 1 The domain of the WRF model for the Fukushima NPP location
18
3 1 2 Meteorological assessment
The ERA5 reanalyzed meteorological data, with an initial (raw) resolution of
about 31 km, could not reproduce meteorological variables over the complex
topography of the Japan region The WRF model can scale the dynamics down
to a finer grid resolution (05 km and 01 km in this study) Figure 3 2 Simulation
of position elevation (color) and wind field (bark) at 850 Mb on March 15, 2011,
at 12:00 UTC using the WRF model in test (a), compared to reanalyzed data
ERA5(b) for the first test
(a)
(b)
Figure 3 2 Simulation of topographic elevation (color) and wind field (barb) at
850 mb, March 15, 2011 at the Fukushima NPP location
Figure 3 3 Simulated rainfall accumulated from the WRF model in test-1, from
09:00 to 15:00 on 15 March 2011
The amount and intensity of rain in this case (Figure 3 3) give similar results to
the simulation results from the study of G Katata et al
19
3 1 3 Evaluating the sensitivity of radioactive dispersion simulation results with
microphysics diagrams
The Futaba monitoring station is located around 3 2 kilometers from the
Fukushima nuclear power plant, which has also been significantly damaged by
earthquakes, tsunamis, and radiation impacts Due to grid resolution limitations, the
neighborhood of the plant is typically not taken into consideration in other studies that
use the global radioactive dispersion model We calculated the radiation influence on
Futaba and other neighboring stations using a high resolution of 01 km in this
investigation (Naraha station) The results of estimating the concentration of
radioactive Cs-137 in the atmosphere in hourly time at Futaba and Naraha stations
using Katata's emission source term are given in Figure 3 4; similar findings are
provided in Figure 3 5 using Teranda's source term Tsuruta et al provided the
monitoring data used in these figures (2011)
(a)
(b)
Figure 3 4 Comparison of simulation results with observed values at Futaba
(a) and Nahara (b) stations using Katata’s source terms
20
(a)
(b)
Figure 3 5 Comparison of simulation results with observed values at Futaba
(a) and Nahara (b) stations using Teranda’s source terms
Figures 3 4 and 3 5 depict the temporal distribution of radioactive Cs-137 surface
fallout in Futaba, Naraha In general, 48 experiments accurately mimicked places
where Cs-137 was deposited The simulation findings match the actual data,
particularly from March 12 to March 14 and March 16, 2011 at the Futaba monitoring
station and March 15, 2019 to March 16, 2011 at the Naraha station Cs-137
concentrations at the Futaba station on March 12, 2019 and March 19, 2011 were well
replicated in all experiments The FLEXPART-WRF software successfully replicated
Cs-137 radiation concentration values at the Naraha monitoring station on March 15,
March 16, and March 19, 2011
For monitoring values of radioactive concentrations less than 102Bq/m3, there is a
large error between simulated and observed values; corresponding to periods of
radioactive emissions from the incident into the environment are low, such as day 14,
17 or 19, the model gives significantly lower emissions (Figure 3 4 (b) Nahara station)
21
reliability and reliability The sensitivity in the simulation related to different
microphysical factors and the frequency of the emission source has been shown more
clearly when comparing the results with the Futaba and Nahara monitoring stations
This can be seen in the simulation results on March 13-14, 2011 and March 19-21,
2011 in Figure 3 4(a) (Futaba station) and March 17,18 and 20, 20111 shown in Figure
3 4(b) (Nahara station) The simulated and observed values at the station on March 15,
March 17-18 vary significantly, presumably because the rain simulation technique is
not near to the reality of the WRF model (at the same time) There was a lot of rain in
the region where the monitoring stations were situated
In addition to assessing the deposition of radioactive Cs-137 over time, the
spatial distribution of Cs-137 radioactive dispersion is calculated The results
from the test-4
(Figure 3 6) show radioactive Cs-137 concentrations in
radioactive plume at 100 m altitude over three different days with (a): time from
00 UTC 12 to 00 UTC 13/03/2011, (b): time from 00 UTC 15 to 00 UTC
16/03/2011 and ( c): time from 00 UTC 19 to 00 UTC 20/03/2011 Unit: Bq/m3
(
(
(
Figure 3 6 Spatial distribution at local-scale of Cs-137 activity
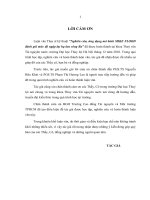
3 1 4 Uncertainty evaluation
The sensitivity of the simulation findings for various physical variables of the
WRF model is shown in Figure 3 7 when compared to the actual observed values
at Futaba (a) and Nahara (b) stations To compare and assess the findings
between simulation and observation, tests with a standardized standard deviation
(σ) of more than 5 will not be presented in the graph (a1) and (b1) use Katata's
source term; (a2) and (b2) use Teranda's source term
22
(
(b1)
(a2)
(b2)
Figure 3 7 Taylor diagram compares 24 simulated results of radiation
concentration with the observed value of the radioactive concentration of Cs-137
at Futaba (a) and Nahara (b) stations
Through the results shown in Figure 3 7, it can be seen that the use of different
emission source terms in modeling the dispersion process gives dissimilar
results Therefore, there is a need for further studies on re-evaluating the
emission source term in future studies There is no consensus on which
configuration is best when evaluated across 2 stations, for example, test-5 is poor
at Futaba station but good at Naraha station
23