STUDY ON EMPLOYEE SATISFACTION ABOUT SALARY, BONUS AND REMUNERATION POLICIES AT DONG THANH TECHNOLOGY CO , LTD
Bạn đang xem bản rút gọn của tài liệu. Xem và tải ngay bản đầy đủ của tài liệu tại đây (201.55 KB, 31 trang )
DUY TAN UNIVERSITY
INTERNATIONAL SCHOOL
PSU DIVISION
------------------
UNDERGRADUATE THESIS
STUDY ON EMPLOYEE SATISFACTION ABOUT SALARY,
BONUS AND REMUNERATION POLICIES AT DONG
THANH TECHNOLOGY CO., LTD
MAJOR
: BUSINESS ADMINISTRATION
MENTOR
: LE THI KHANH LY
STUDENT
: HOANG THI NGOC TRANG
CLASS
: K24PSU-QTH4
ID NUMBER : 24202808170
Danang, May 2022
TABLE OF CONTENTS
4
CHAPTER 1: INTRODUCTION
1.1 REASONS FOR CHOOSING A RESEARCH TOPIC
Firstly, the issue of salary, bonus and personnel treatment is
certainly not strange to those who have been participating in the
labor market. This is one of the important elements of Human
Resource Management.
According to research, the salary, bonus and remuneration
policy is one of the top reasons why employees choose to work or
quit.
Second, the study of employee satisfaction helps managers plan
good employee retention and development policies, make employees
more satisfied and limit the phenomenon of "brain drain".
Therefore, in order to assess employee satisfaction about salary,
bonus and remuneration, I boldly choose the topic "Study on
employee satisfaction about salary, bonus and remuneration policies
at the Company." Dong Thanh Technology Co., Ltd”
1.2 RESEARCH OBJECTIVES
Systematize old theories and models related to the topic. From
there, build a new research model, examine the level of satisfaction
5
as well as determine the factors that affect the employee's satisfaction
with the salary and bonus policy.
Proposing a number of solutions to improve employee
satisfaction and efficiency in human resource management of Dong
Thanh Technology Co., Ltd.
1.3 SUBJECT AND SCOPE OF RESEARCH
•
Research subjects
- Subject of research: Satisfaction with salary, bonus and
remuneration policies at Dong Thanh Technology Co., Ltd.
- Survey subjects: employees at Dong Thanh Technology Co.,
Ltd.
•
Research period: The topic was studied during the internship
period from February 14, 2022 to May 20, 2022.
•
Research space: Dong Thanh Technology Co., Ltd.
1.4 RESEARCH METHODS
6
•
Qualitative research
•
Quantitative research
1.5 SIGNIFICANCE OF THE STUDY
Thesis consists of 5 chapters
Chapter 1: Introduction
Chapter 2: Research overview
Chapter 3: Research Methods
Chapter 4: Research results
Chapter 5: Conclusion and solutions.
7
CHAPTER 2 : RESEARCH OVERVIEW
2.1 THEORETICAL BASIS OF SATISFACTION WITH THE
POLICY OF SALARY, BONUS AND REMUNERATION OF
PERSONNEL
2.1.1 Theory of employee satisfaction
2.1.2 Theory of salary, bonus and remuneration policies for
personnel
2.2MODEL OF PREVIOUS RESEARCH
2.2.1 Research by Nguyen Thi Hong (2015)
5 factors affecting the level of employees' satisfaction is:
salary; bonus; allowances, subsidize and welfare; compensation
through work and compensation through work environment.
2.2.2 Research by Vu Thuy Duong and Hoang Van Hai (2011)
Pointed out 6 factors: salary; bonus; stock; allowance;
subsidize; welfare affect employee satisfaction.
2.2.3 Research by Nguyen Khac Hoan (2010)
8
Pointed out 5 factors affecting employee's work motivation:
Compensation through work environment; salary bonus and welfare;
work arrangement; training and advancement opportunities and
career prospects.
2.2.4 Research by Nguyen Thi Thuy Quynh (2012)
Pointed out 7 factors: nature of work; promotion training;
leader; colleague; salary, bonus; welfare; compensation through work
environment affects employee satisfaction.
2.3 SUMMARY OF RESEARCH MODELS
2.4 PROPOSED RESEARCH MODEL
9
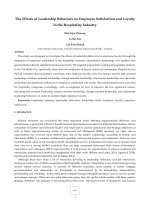
H1
Salary
H2
Bonus
H3
Employee satisfaction on Salary, bonus & remuneration
Allowances, subsidies and welfare
H4
Training and advancement opportunities
H5
Compensation through work environment
Figure 2.5: Research model proposes employee satisfaction about
salary, bonus and remuneration policies.
2.4.1 Salary
H1: Salary has a positive effect on employee satisfaction in
terms of salary, bonus and remuneration policies.
2.4.2 Bonus
H2: Bonus has a positive effect on employee satisfaction in
terms of salary, bonus and remuneration policies.
10
2.4.3 Allowances, subsidies & welfare
H3: Allowances, subsidies & welfare has a positive effect on
employee satisfaction in terms of salary, bonus and remuneration
policies.
2.4.4 Training and advancement opportunities
H4: Training and advancement opportunities has a positive
effect on employee satisfaction in terms of salary, bonus and
remuneration policies.
2.4.5 Compensation through work environment
H5: Compensation through work environment has a positive
effect on employee satisfaction in terms of salary, bonus and
remuneration policies.
2.4.6 Employee satisfaction on salary, bonus and remuneration
policies
11
CHAPTER 3: RESEARCH METHODS
3.1 COMPANY OVERVIEW
3.1.1 Overview of the formation and development of the
company
3.1.1.1 General introduction
•
Company name: Dong Thanh Technology Co., Ltd
•
Charter capital: 10,000,000,000 VNĐ
•
Field of activity: Installation of industrial mechanical, electrical
and refrigeration systems
•
Business registration certificate: Business code: 4103003187.
First registered on April 8, 2019. Register for the 3rd change on
12/25/2020.
3.1.1.2 Vision, mission
3.1.1.3 Core values
3.1.1.4 The process of formation and development
3.1.2 Organizational structure and functions of each department
12
3.1.3 Results of the company's production and business activities
3.1.4 Labor situation of the company
3.1.5 Salary, bonus and remuneration policy of the company
3.1.5.1 Salary policy
3.1.5.2 Bonus policy
3.1.5.3 Remuneration policy
3.2 CONSTRUCTION AND MEASUREMENT OF THE
PROPOSED RESEARCH VARIABLES
3.2.1 Salary
Table 3.5: Scale for the factor variable “Salary”
Encod
e
S1
S2
S3
S4
Salary
Source
Salaries are commensurate with
work results
The company pays salarys on time
The company has a reasonable
salary increase regime
Pham Thi Thanh
(2015)
Convenient payment method
Nguyen Thi Hong
(2015)
13
3.2.2 Bonus
Encod
e
Table 3.6: Scale for the factor variable “Bonus”
Bonus
Source
B1
The reward policy is fair, clear and
satisfactory
B2
There are many forms of rewards
B3
B4
Vu Ngoc Sang
(2014)
Nguyen Thi Hong
(2015)
The reward level is worthy of the
contribution
The bonus at the company is very
attractive
Pham Thi Thanh
(2015)
3.2.3 Allowances, subsidies and welfare
Table 3.7: Scale for the factor variable “Allowances, subsidies and
Encod
e
W1
W2
W3
W4
W5
W6
welfare”
Allowances, subsidies and welfare
The company has different levels of
allowances, various allowances and
benefits in accordance with job
characteristics
Fully implement insurance policies.
The company's various and attractive
allowances, subsidies and welfare
programs
Cool and free parking space
Organizing annual trips for employees
Welfare shows the company's thoughtful
attention to employees
Source
Pham Thi
Thanh
(2015)
Nguyen Thi
Hong
(2015)
Vu Ngoc
Sang
(2014)
14
3.2.4 Training and advancement opportunities
Table 3.8: Scale for the factor variable “Training and advancement
opportunities”
Encod
Training and advancement
e
opportunities
P1
The company always creates conditions
for learning to improve knowledge and
working skills
There are many opportunities for
P2
promotion
P3
Clear promotion policy
3.2.5 Compensation through work environment
Source
Phạm Thị
Thanh (2015)
Table 3.9: Scale for the factor variable “Compensation through
Encod
e
CTE1
CTE2
CTE3
CTE4
work environment”
Compensation through work environment
Source
The number of tasks assigned in a day is
reasonable
Provide adequate equipment to serve the
work
The company regularly organizes cultural,
artistic and sports movements to
encourage employees to participate
Pham Thi
Thanh
(2015)
Feeling comfortable and safe at your
workplace
Vu Ngoc
Sang
(2014)
3.2.6 Employee satisfaction on salary, bonus and remuneration
policies
Table 3.10 Scale for the factor variable “Employee satisfaction on
Encod
e
salary, bonus and remuneration policies”
Employee satisfaction with
Source
remuneration policy
15
SA1
Satisfied with the salary and bonus
policy
Satisfied with the policy of
SA2
allowances, allowances and benefits
Satisfied with the training and
SA3
promotion policy
Satisfied
with
the
working
SA4
environment
3.3 QUALITY RESEARCH
Pham Thi
Thanh (2015)
Vu Ngoc Sang
(2014)
3.3.1 Objectives of qualitative research
3.3.2 Design of qualitative research
3.4 QUANLITIVE RESEARCH
3.4.1 Objectives of qualitative research
3.4.2 Quantitative study design
3.4.3 Information collection process
3.4.4 Sample size
We estimate that the total number of ballots distributed is 170
and collected 170 votes, after screening the number of votes used for
analysis is 160.
3.5 QUESTIONNAIRE
The survey questionnaire includes all 25 questions including 2
main parts:
(1) Survey part ( Likert scale)
(2) Personal information
16
3.6 SOME METHODS OF DATA ANALYSIS
3.6.1 Descriptive statistics
3.6.2 Testing of Cronbach's Alpha scale
3.6.3 Factor exploratory analysis
3.6.4 Build regression equation
3.6.5 Test the research hypothesis
3.6.6 Check the correlation phenomenon of residuals
CHAPTER 4: RESEARCH RESULTS
4.1 QUALITATIVE RESEARCH RESULTS
All observed variables are agreed 6/6 from the discussion group.
4.2 SAMPLE DESCRIPTION
4.2.1 Gender
4.2.2 Age
4.2.3 Education level
4.2.4 Income
4.2.5 Test the relationship between gender and education level
4.2.6 Test the relationship between gender and age
4.3 TESTING THE RELIABILITY OF THE RANGE WITH
CRONBACH’S ALPHA
4.3.1 Cronbach's Alpha test for independent variables
4.3.1.1 Cronbach's Alpha test for the factor “Salary”
Table 4.11: Cronbach's Alpha Test of the Salary Factor
17
Reliability Statistics
Cronbach's Alpha
N of Items
.884
4
Item-Total Statistics
Scale Mean
Scale
Corrected
Cronbach's
if Item
Variance if
Item-Total
Alpha if Item
Deleted
Item Deleted
Correlation
Deleted
S1
9.66
9.256
.704
.867
S2
9.91
7.539
.872
.799
S3
9.79
10.194
.564
.913
S4
9.92
7.547
.872
.799
4.3.1.2 Cronbach's Alpha test for the factor "Bonus"
Table 4.12: Cronbach's Alpha Test of Bonus factor
Reliability Statistics
Cronbach's Alpha
N of Items
.832
4
Item-Total Statistics
Scale Mean
Scale
Corrected Item-
Cronbach's
if Item
Variance if
Total
Alpha if Item
Deleted
Item Deleted
Correlation
Deleted
B1
10.88
6.810
.646
.796
B2
10.31
5.572
.693
.779
B3
10.91
6.563
.667
.786
B4
10.86
6.648
.657
.790
18
4.3.1.3 Cronbach's Alpha test for the factor “Allowances, subsidies
and welfare”
Table 4.13: Cronbach's Alpha test of the factor Allowances,
subsidies and welfare
Reliability Statistics
Cronbach's Alpha
N of Items
.891
6
Item-Total Statistics
Scale Mean
Scale
Corrected Item-
Cronbach's
if Item
Variance if
Total
Alpha if Item
Deleted
Item Deleted
Correlation
Deleted
W1
18.84
15.856
.750
.866
W2
19.23
17.433
.699
.874
W3
18.84
15.554
.765
.863
W4
19.28
17.194
.710
.873
W5
18.79
16.530
.707
.873
W6
19.24
18.031
.642
.883
4.3.1.4 Cronbach's Alpha test for the factor “Training and
advancement opportunities”
Table 4.14: Cronbach's Alpha test of the factor Training and
advancement opportunities
19
Reliability Statistics
Cronbach's Alpha
N of Items
.886
3
Item-Total Statistics
Scale Mean
Scale
Corrected
Cronbach's
if Item
Variance if
Item-Total
Alpha if Item
Deleted
Item Deleted
Correlation
Deleted
P1
7.61
3.597
.871
.754
P2
7.91
4.546
.608
.975
P3
7.50
3.396
.878
.745
4.3.1.5 Cronbach's Alpha test for the factor "Compensation through
work environment"
Table 4.15: Cronbach's Alpha test of the Compensation through
work environment
Reliability Statistics
Cronbach's Alpha
N of Items
.850
4
Item-Total Statistics
Scale Mean
Scale
Corrected
Cronbach's
if Item
Variance if
Item-Total
Alpha if Item
Deleted
Item Deleted Correlation
Deleted
CTE1
11.20
6.840
.723
.794
CTE2
11.19
7.436
.681
.813
CTE3
10.88
7.091
.721
.795
20
CTE4
10.58
7.340
.633
.833
4.3.2 Cronbach's Alpha test for the dependent variable
"Employee satisfaction"
Table 4.16: Test Cronbach's Alpha factor Employee satisfaction.
Reliability Statistics
Cronbach's Alpha
N of Items
.934
4
Item-Total Statistics
Scale Mean
Scale
Corrected
Cronbach's
if Item
Variance if
Item-Total
Alpha if Item
Deleted
Item Deleted Correlation
Deleted
SA1
10.21
4.395
.832
.918
SA2
10.41
4.043
.863
.908
SA3
10.70
4.174
.845
.914
SA4
10.92
4.251
.839
.915
4.3.3 Summary after checking the reliability of Cronbach's Alpha
4.4 EFA FACTOR DISCOVERY ANALYSIS
4.4.1 Factor analysis (EFA) for the independent variable
4.4.1.1 Testing the suitability of the EFA model (Kaiser-Meyer-Olkin)
4.4.1.2 Test of correlation between observed variables (Bartlett's
test)
21
Table 4.17: KMO-EFA coefficient of employee satisfaction
component
KMO and Bartlett's Test
Kaiser-Meyer-Olkin Measure of Sampling Adequacy.
.875
Approx. Chi-Square
Bartlett's Test of Sphericity
3001.278
df
210
Sig.
.000
4.4.1.3 Test of extracted variance of factors (% Cumulative
variance)
4.4.1.4 Test of Factor loading
4.4.2 Factor Analysis (EFA) for the dependent variable
“Employee satisfaction”
4.4.2.1 Integration test of EFA (Kaiser-Meyer-Olkin) factor analysis
model
4.3.2.2 Test the correlation between observed variables (Bartlett's
Test)
Table 4.20: KMO-EFA coefficient of employee satisfaction factor
KMO and Bartlett's Test
Kaiser-Meyer-Olkin Measure of Sampling Adequacy.
Bartlett's Test of
Sphericity
Approx. Chi-Square
.842
539.090
df
Sig.
6
.000
4.4.2.3 Test of extracted variance of factors (% Cumulative
variance)
Table 4.21: Total variance extracted of employee satisfaction factor
22
nent
Compo
Total Variance Explained
Total
1
3.341
83.534
83.534
2
.296
7.412
90.946
3
.199
4.985
95.931
4
.163
4.069
100.000
% of
Cumulati Total
Variance
ve %
% of
Cumulati
Variance
ve %
83.534
83.534
3.341
Extraction Method: Principal Component Analysis.
4.4.2.4 Test of Factor loading
Table 4.22: Factor loading EFA of the factor Employee satisfaction
Component Matrixa
Component
1
SA2
.926
SA3
.914
SA4
.910
SA1
.905
Extraction Method: Principal Component Analysis.
a. 1 components extracted.
4.5 MULTI-VARIABLE LINEAR REGRESSION ANALYSIS
4.5.1 Check the correlation matrix between the factors
Table 4.23: Test results of correlation coefficient r
Correlations
SA
S
B
W
P
CTE
23
Pearson
1
.744**
.746**
.745**
.779**
.744**
.000
.000
.000
.000
.000
160
160
160
160
160
1
**
**
**
.465**
Correlatio
SA
n
Sig. (2tailed)
N
Pearson
160
.744
**
.402
.487
.437
Correlatio
S
n
Sig. (2-
.000
.000
.000
.000
.000
tailed)
N
Pearson
160
160
160
160
160
160
.746**
.402**
1
.592**
.545**
.444**
.000
.000
.000
.000
.000
160
160
160
160
160
160
.745**
.487**
.592**
1
.542**
.478**
.000
.000
.000
.000
.000
160
160
160
160
160
160
**
**
**
**
1
.581**
Correlatio
B
n
Sig. (2tailed)
N
Pearson
Correlatio
W
n
Sig. (2tailed)
N
P
Pearson
Correlatio
n
.779
.437
.545
.542
24
Sig. (2-
.000
.000
.000
.000
.000
160
160
160
160
160
160
.744**
.465**
.444**
.478**
.581**
1
.000
.000
.000
.000
.000
160
160
160
160
160
tailed)
N
Pearson
Correlatio
CT
E
n
Sig. (2tailed)
N
160
**. Correlation is significant at the 0.01 level (2-tailed).
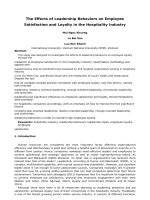
4.5.2 Testing of model fit (Adjusted R Square, ANOVA)
4.5.2.1 Model Interpretation Level (Adjusted R Square)
Table 4.24: R Square analysis of the fit of the regression equation
Model Summaryb
Std.
Adjuste
R
Error of
DurbinModel
R
dR
Square
the
Watson
Square
Estimate
1
.975a
0.951
0.949 0.15258
1.92
a. Predictors: (Constant), CTE, B, S, W, P
b. Dependent Variable: SA
25
From the table above, we can see that adjusted R2 = 0.951
(test, Sig = 0.000 ≤ 0.05). 95.1% change in SA_employee
satisfaction is explained by 5 independent variables
4.5.2.2 Model fit: Analysis of variance ANOVA
Table 4.25: ANOVA analysis of the fit of the regression equation
ANOVAa
Model
Sum of
df
Mean
Squares
Regression
1
Sig.
Square
69.286
5
13.857
3.585
154
.023
72.871
159
Residual
Total
F
595.211
.000b
a. Dependent Variable: SA
b. Predictors: (Constant), CTE, B, S, W, P
99% confidence (Sig ≤ 0.01). Show that the theoretical model
is consistent with reality. The independent variables have a linear
correlation with the dependent variable in the model
4.5.4 Testing of regression coefficients and multicollinearity
(Multiple Collinearity)
Table 4.27: Regression coefficient of employee satisfaction factors
Coefficientsa
Model
Unstandardized
Coefficients
B
Std.
Error
Standa
rdized
Coeffi
cients
Beta
t
Sig.
Collinearity
Statistics
Tolera
nce
VIF