Báo cáo khoa học: New insights into structure–function relationships of oxalyl CoA decarboxylase fromEscherichia coli pptx
Bạn đang xem bản rút gọn của tài liệu. Xem và tải ngay bản đầy đủ của tài liệu tại đây (967.55 KB, 13 trang )
New insights into structure–function relationships of
oxalyl CoA decarboxylase from Escherichia coli
Tobias Werther
1,
*, Agnes Zimmer
1,
, Georg Wille
2
, Ralph Golbik
1
, Manfred S. Weiss
3
and
Stephan Ko
¨
nig
1
1 Department of Enzymology, Institute of Biochemistry & Biotechnology, Faculty for Biological Sciences, Martin Luther University
Halle-Wittenberg, Halle, Germany
2 Institute of Biophysics, Johann Wolfgang Goethe University Frankfurt am Main, Germany
3 Macromolecular Crystallography (BESSY-MX), Electron Storage Ring BESSY II, Helmholtz Zentrum Berlin fu
¨
r Materialien und Energie,
Albert Einstein Straße 15, Berlin, Germany
Keywords
ADP activation; crystal structure; oxalate
degradation; thiamine diphosphate; X-ray
scattering
Correspondence
S. Ko
¨
nig, Institute of Biochemistry &
Biotechnology, Martin Luther University
Halle-Wittenberg, Kurt Mothes Straße 3,
06120 Halle (Saale), Germany
Fax: +49 345 5527014
Tel: +49 345 5524829
E-mail: stephan.koenig@biochemtech.
uni-halle.de
Website: chemtech.
uni-halle.de/enzymologie/
Present address
*Humboldt University Berlin, Institute of
Biology, Research Group Structural Biology
& Biochemistry, Germany
Research Group Macromolecular
Interactions, Division of Structural Biology,
Helmholtz Centre for Infections Research,
Braunschweig, Germany
Database
Structural data for holo-EcODC
(ThDP-EcODC) in the absence of additional
ligands and in complex with either ADP or
acetyl CoA have been submitted to the
Protein Data Bank under the accession
numbers 2q27, 2q28 and 2q29, respectively.
(Received 28 January 2010, revised 26
March 2010, accepted 8 April 2010)
doi:10.1111/j.1742-4658.2010.07673.x
The gene yfdU from Escherichia coli encodes a putative oxalyl coenzyme A
decarboxylase, a thiamine diphosphate-dependent enzyme that is potentially
involved in the degradation of oxalate. The enzyme has been purified to
homogeneity. The kinetic constants for conversion of the substrate oxalyl
coenzyme A by the enzyme in the absence and presence of the inhibitor
coenzyme A, as well as in the absence and presence of the activator adenosine
5¢-diphosphate, were determined using a novel continuous optical assay. The
effects of these ligands on the solution and crystal structure of the enzyme
were studied using small-angle X-ray scattering and X-ray crystal diffraction.
Analyses of the obtained crystal structures of the enzyme in complex with the
cofactor thiamine diphosphate, the activator adenosine 5¢-diphosphate and
the inhibitor acetyl coenzyme A, as well as the corresponding solution scat-
tering patterns, allow comparison of the oligomer structures of the enzyme
complexes under various experimental conditions, and provide insights into
the architecture of substrate and effector binding sites.
Structured digital abstract
l
MINT-7717846: EcODC (uniprotkb:P0AFI0) and EcODC (uniprotkb:P0AFI0) bind
(
MI:0407)byX-ray scattering (MI:0826)
l
MINT-7717834: EcODC (uniprotkb:P0AFI0) and EcODC (uniprotkb:P0AFI0) bind
(
MI:0407)byX-ray crystallography (MI:0114)
Abbreviations
EcODC, oxalyl CoA decarboxylase from Escherichia coli; OfODC, oxalyl CoA decarboxylase from Oxalobacter formigenes; PADP,
3¢-phosphoadenosine 5¢-diphosphate; ThDP, thiamine diphosphate.
2628 FEBS Journal 277 (2010) 2628–2640 Journal compilation ª 2010 FEBS. No claim to original US government works
Introduction
Oxalic acid is toxic for many organisms. However,
some bacteria (e.g. Oxalobacter formigenes) are able to
tolerate oxalate and even use it as an exclusive energy
source [1]. Oxalyl CoA represents an activated form of
oxalate and is decarboxylated by the thiamine diphos-
phate (ThDP)-dependent enzyme oxalyl CoA decar-
boxylase (ODC, EC 4.1.1.8) [2]. Baetz & Allison [2]
published the first biochemical analysis of OfODC,
indicating that it is a homotetramer in solution.
Recently, Berthold et al. [3,4] determined the crystal
structure and postulated a catalytic mechanism on the
basis of this structure. The monomer has three
domains and its topology is typical of ThDP enzymes
[5]. Interestingly, in addition to the cofactors ThDP
and Mg
2+
, one molecule of ADP was bound per
monomer distant from the CoA binding site. Further-
more, kinetic experiments revealed that ADP signifi-
cantly activates OfODC, whereas ATP was only a
weak activator [3]. Although the mechanism of activa-
tion by ADP remains to be elucidated, the authors
postulated its physiological relevance. To date, more
than 50 oxalotrophic bacteria that are capable of using
oxalate as a carbon and energy source have been iden-
tified [6]. The Swiss-Prot ⁄ TREMBL database includes
28 highly homologous sequence entries encoding puta-
tive ODCs. Only a few of these have been isolated and
characterized, such as those from Oxalobacter formig-
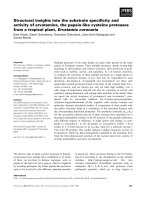
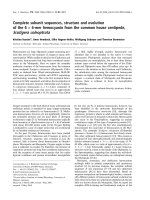
enes [2–4] and Pseudomonas oxalaticus [7]. Figure 1
shows the high degree of similarity of the deduced
amino acid sequences of the enzymes from Escherichia
coli and O. formigenes. Although no oxalotrophic
metabolism has yet been reported for E. coli, its
genome contains open reading frames that encode a
putative formyl CoA transferase (yfdW) and an ODC
Fig. 1. Sequence alignment of EcODC and OfODC. Secondary structure elements are included (arrows, b sheets, spirals, a helices). Ligand
binding sites are indicated in green for the cofactor ThDP, in blue for the activator ADP, and in orange for the substrate (here PADP). Differ-
ent amino acid residues at the substrate binding site are indicated by red boxes.
T. Werther et al. Studies on oxalyl CoA decarboxylase of E. coli
FEBS Journal 277 (2010) 2628–2640 Journal compilation ª 2010 FEBS. No claim to original US government works 2629
(yfdU, 564 amino acids, 60.581 Da). Thus, it was inter-
esting to clarify whether these enzymes do indeed fulfil
their predicted function, and how the properties of the
enzymes differ from those of the homologous enzymes
from O. formigenes. Although the crystal structure and
kinetic properties of formyl CoA transferase from
E. coli were recently determined [8,9], knowledge on
EcODC is lacking.
Here, we present the first results of functional and
structural studies on purified EcODC in the presence
of activators and inhibitors using various methods,
such as steady-state kinetic measurements, small-angle
X-ray solution scattering (SAXS) and protein crystal
structure analysis.
Results
Expression and purification
EcODC was expressed in E. coli strain BL21, and puri-
fied by homogenization, streptomycin sulfate and
ammonium sulfate precipitation steps, dialysis, anion-
exchange chromatography, and size-exclusion chroma-
tography. Approximately 150 mg of homogeneous,
ThDP-free apoenzyme was obtained from 1 L of cell
culture.
Crystal structure of EcODC complexes
Overall structure
Holo-EcODC (ThDP-EcODC) was crystallized in the
absence of additional ligands (PDB ID 2q27) and in
complex with either ADP (2q28) or acetyl CoA (2q29).
The ortho-rhombic crystals obtained all belong to
space group C222
1
(Table 1). The enzyme tetramer is a
dimer of dimers, and displays twofold symmetry. The
interface area between the monomers of a functional
dimer is significantly larger than the interface between
dimers. For most of the polypeptide chains, the elec-
tron density is well defined, excluding residues 1–4 and
551–564 (555–564 for the ADP complex) in both
chains. Residue Y478 at the active site assumes a rare
conformation that falls in a disallowed region of the
Ramachandran plot (data not shown). However, the
electron density of the side chain of Y478 is well
defined. The same is true for the corresponding residue
Y483 in the crystal structure of OfODC.
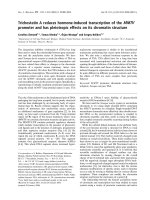
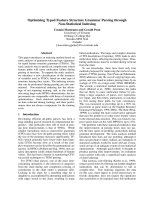
No significant differences were found between the
overall structures of all three EcODC complexes
(Fig. 2, rmsd 0.18 A
˚
for 1043 superimposed Ca atom
pairs of 2q27 and 2q28, rmsd 0.14 A
˚
for 1023 super-
imposed Ca atom pairs of 2q27 and 2q29, and rmsd
0.16 A
˚
for 993 superimposed Ca atom pairs of 2q28
and 2q29), indicating that binding of the activator
ADP or the inhibitor acetyl CoA does not induce
significant conformation changes within the dimers.
However, four additional amino acid residues at the
C-terminus were pinpointed in the presence of the acti-
vator ADP that are not defined in the absence of this
ligand.
The EcODC monomer displays the typical binding
fold of ThDP enzymes, comprising three domains of
the a ⁄ b type, designated as the PYR domain (residues
1–190), the R domain (residues 191–368) and the PP
domain (residues 369–564) [5] (Fig. 2A). The overall
structure of the monomer is highly similar to that of
OfODC (rmsd 0.62 A
˚
for 488 superimposed Ca atom
pairs). The locations of the cofactor ThDP and the
activator ADP are clearly defined in the electron density
map. In contrast, electron density of the S-acetyl
pantetheine moiety of the inhibitor acetyl CoA is not
detectable. Thus, only the 3¢-phosphoadenosine 5¢-
diphosphate (PADP) moiety of acetyl CoA was
included in the model.
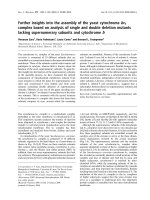
Active site
Two molecules of the cofactor ThDP are bound in
the canonical V conformation at the interface between
the PYR domain and the PP domain of two subunits
of the functional dimer. The main chain oxygen of
G421 and the side-chain carboxyl oxygen of E54
interact with the amino pyrimidine moiety of ThDP
(Fig. 3); these are highly conserved interactions in
ThDP enzymes [10]. The diphosphate moiety is stabi-
lized by interactions with residues Y372, A396, N397
and T398 of the PP domain, as well as by interactions
with the octahedrally coordinated magnesium ion.
Based on the architecture of the active site, a func-
tional role may only be suggested for residue E54. Its
direct interaction with the N1¢ nitrogen atom of
ThDP enables cofactor activation (ylid formation).
This kind of interaction is found in all crystal struc-
tures of ThDP enzymes except glyoxylate carboligase
[11]. Some other moieties may be involved in cataly-
sis, for instance the preserved water molecule interact-
ing with residues I32, Y118 and E119 can act as a
general base for deprotonation of intermediates, as
proposed by Berthold et al. [3,4] for OfODC. The
tyrosine residues 118 and 478 (the latter in an uncom-
mon side-chain conformation) stabilize the oxalyl moi-
ety of the substrate as demonstrated for the
corresponding OfODC structure [4]. However, the
electron density of the S-acetyl-pantetheine moiety of
acetyl CoA was very poor in the corresponding
ThDP–acetyl CoA–EcODC complex.
Studies on oxalyl CoA decarboxylase of E. coli T. Werther et al.
2630 FEBS Journal 277 (2010) 2628–2640 Journal compilation ª 2010 FEBS. No claim to original US government works
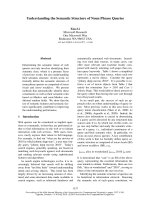
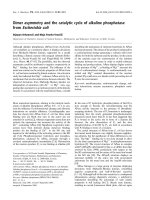
ADP binding site
ADP binds to EcODC at a Rossmann fold in a cleft
between the PYR domain and the PP domain. As for
ThDP, ADP molecules are found in all four subunits of
the tetramer, but, in contrast to ThDP, the binding
domains are recruited from one subunit only. The main
chain nitrogens of residues I322 and I303 interact with
nitrogen atoms of the adenine ring and the c-carboxyl
group of the side chain of residue D302, the d and x
nitrogen atoms of the guanodino group of R158 interact
with the hydroxyl groups of ribose, and the main chain
nitrogens of K220 and R280 interact with the 5¢-diphos-
phate moiety (Fig. 4A). The side chains of I322 and
I303 form a hydrophobic pocket surrounding the planar
adenosine ring system. As mentioned above, the overall
crystal structures of the EcODC complexes are almost
identical. However, the mean B factor for the protein
atoms of 2q27 (approximately 37 A
˚
2
) is almost twice
that of crystal structures with additional ligands (2q28
and 2q29, both approximately 19 A
˚
2
, see Table 1). This
freezing effect of the ligand ADP is particularly pro-
nounced for the C-terminal part of the subunits. Hence,
four additional residues are included in the model 2q28
compared to 2q27. Thus, binding of the activator ADP
stabilizes the C-terminus. As in other ThDP enzymes,
this part of the structure runs across the active site and
may support catalysis by exclusion of solvent.
Table 1. Data collection and refinement statistics for three EcODC complexes (numbers in parentheses correspond to the highest-resolution
shell).
ThDP–EcODC ThDP–ADP–EcODC ThDP–acetyl CoA–EcODC
Data collection
Beamline X12 X12 BW7A
Wavelength (A
˚
) 0.93001 0.93001 0.9785
Crystal–detector distance (mm) 220 175 130
Rotation range per image (degrees) 0.5 0.5 0.3
Total rotation range (degrees) 200 180 180
Space group C222
1
C222
1
C222
1
Detector MARCCD-225 MARCCD-225 MARCCD-165
Cell dimensions (A
˚
) 132.11 · 145.44 · 147.98 132.27 · 143.62 · 147.58 132.57 · 145.53 · 147.19
Resolution (A
˚
) 99.0–2.12 (2.16–2.12) 99.0–1.74 (1.77–1.74) 99.0–1.82 (1.85–1.82)
Number of observed reflections (unique) 565 267 (80 614) 1 023 314 (143 107) 915 365 (126 889)
R
merge
(%) 10.7 (73.9) 10.4 (86.8) 5.2 (25.7)
I ⁄ r (I ) 16.8 (2.3) 18.8 (2.3) 35.5 (7.7)
Completeness (%) 99.8 (99.9) 99.9 (100) 99.9 (100)
Redundancy 7.0 7.2 7.2
Mosaicity (degrees) 1.19 0.65 0.49
B factor (Wilson plot, A
˚
2
)37 20 20
Refinement
Resolution (A
˚
) 18.3–2.12 (2.17–2.12) 20.6–1.74 (1.78–1.74) 42.3–1.82 (1.87–1.82)
Total number of atoms 8798 9344 9037
Number of atoms (protein) 8153 8280 8191
Number of atoms (water) 515 907 707
R
free
(%) 23.7 19.6 19.4
R
work
(%) 19.3 17.7 17.5
Average B factors (A
˚
2
)
Protein 36.55 19.17 19.07
ThDP 30.29 18.83 15.28
Ligand 14.79 (ADP) 24.51 (PADP)
Water 39.48 29.12 26.12
rmsd
Bond lengths (A
˚
) 0.023 0.012 0.014
Bond angles (°) 1.9 1.4 1.4
Ramachandran plot
Favoured (%) 90.3 90.3 90.3
Allowed (%) 9.5 9.5 9.5
Disallowed Y478 Y478 Y478
PDB deposit ID 2q27 2q28 2q29
T. Werther et al. Studies on oxalyl CoA decarboxylase of E. coli
FEBS Journal 277 (2010) 2628–2640 Journal compilation ª 2010 FEBS. No claim to original US government works 2631
Substrate binding site
Due to the wide-stretched chemical structure of the
substrate oxalyl coenzyme A, the substrate binding
pocket must be considerably larger than the actual
active site. For the crystal structure of the ThDP–
EcODC complex with the substrate analogue ace-
tyl CoA, additional electron density was found in the
cleft between the R domain and the PP domain of one
subunit, which was assigned to the PADP moiety of
the substrate analogous inhibitor acetyl CoA (Fig. 4B).
Unfortunately, no continuous electron density was
found for the S-acetyl pantetheine part of acetyl CoA,
and consequently the model for the inhibitor remains
incomplete. The nitrogen atom of the amino group of
the adenosine ring of PADP interacts with residue
N404. The oxygen of the a phosphate of ribose
diphosphate is stabilized by interactions with the x
nitrogen of the guanidino group of residue R403 and
the c carbonyl oxygen of residue N404. The 3¢-phos-
phate is stabilized by interaction of two of its oxygens
with the side-chain oxygen and nitrogen of residues
S265 and N355, respectively. The PADP moiety in the
structure of the ThDP–acetyl CoA–EcODC complex
superimposes neatly with the corresponding parts of
oxalyl CoA in the OfODC structure [4]. Differences
are observable only in the number of hydrogen bonds
A
B
Fig. 2. Stereo view of the crystal structure
of EcODC. (A) Schematic representation of
the EcODC monomer. Yellow arrows indi-
cate b sheets, and cylinders indicate helices
(green, PYR domain; blue, R domain; pink,
PP domain). To illustrate the binding sites
for the substrate (PADP in this model),
activator (ADP) and cofactor (ThDP), the
image represents a superposition of three
complexes, ThDP–EcODC (2q27),
ThDP–ADP–EcODC (2q28) and ThDP–
acetyl CoA–EcODC (2q29), and ligands are
shown as sticks. The N- and C-termini are
also indicated. (B) Views of the tetramer
assembly of EcODC. Functional dimers are
presented as traces of Ca atoms (grey lines)
with ligands overlaid (ThDP, ADP and PADP,
shown as spheres), and as schematic
secondary structures (a helices indicated as
brown cylinders, b sheets indicated as
yellow arrows).
Fig. 3. Stereo view of the active site of EcODC. Only amino acid
residues (different colours indicating different subunits) and a water
molecule (blue sphere) adjacent to the thiamine moiety of the
cofactor are shown. Black dashed lines indicate hydrogen bonds. The
C-terminal region is coloured according to the observed B factors
(blue, low; red, high).
Studies on oxalyl CoA decarboxylase of E. coli T. Werther et al.
2632 FEBS Journal 277 (2010) 2628–2640 Journal compilation ª 2010 FEBS. No claim to original US government works
(Fig. 4B). Two additional interactions occur in EcODC
between PADP and residues S265 and N404, respec-
tively.
Small-angle X-ray solution scattering
SAXS studies were performed to characterize the influ-
ence of various effectors on the solution structure of
the enzyme, and to compare the three crystal structure
complexes with the corresponding complexes in solu-
tion. Thus conditions close to those for crystallization
were used for SAXS measurements (for details, see
Experimental procedures). Information on the quater-
nary structure of the catalytically competent EcODC
species in solution was obtained from the enzyme
concentration dependence of scattering of the ThDP–
EcODC complex (0.9–22 mgÆmL
)1
, Fig. 5A). By
extrapolating the resulting dependence of the scattering
parameters R
G
and I
(0)
to infinite dilution, a R
G
value
of approximately 3.9 nm was obtained, which is a typi-
cal value for the tetrameric state of ThDP-dependent
enzymes. The same is true for the molecular mass cal-
culated from I
(0)
of EcODC using BSA as a molecular
mass standard. Given the calculated monomer masses
of 60.6 kDa, the empirically obtained value of
230 kDa represents a tetramer. The decrease of scatter-
ing parameters at high enzyme concentration is indica-
tive of repulsive interactions between macromolecules
[12,13]. This behaviour was independent of the ligand
present (ThDP, ADP or CoA) and was also found for
other ThDP-dependent enzymes [14,15].
As shown in the crystal structures of EcODC com-
plexes presented here the cofactors are bound non-
covalently in the interface between two subunits of one
dimer. Two dimers with four bound ThDP molecules
form the catalytically active tetrameric structure
A
B
Fig. 4. Stereo views of the binding sites of
EcODC for ADP (A) and PADP (B). The
2F
0
) F
c
electron density of the ligands is
contoured at 2.5 r. Hydrogen bonds are
shown as black dashed lines, and the water
molecule is shown as a blue sphere.
T. Werther et al. Studies on oxalyl CoA decarboxylase of E. coli
FEBS Journal 277 (2010) 2628–2640 Journal compilation ª 2010 FEBS. No claim to original US government works 2633
(Fig. 2B). In the case of ThDP enzymes, the oligomeric
state does not only depend on enzyme concentration
[14], but also on the pH value. Figure 5B illustrates
the influence of pH on the oligomer structure of
EcODC. In the optimum range of catalytic activity,
pH 5.5–7.0, the scattering parameters indicate a tetra-
meric state of the enzyme (R
G
3.9–4 nm, molecular
mass 200–220 kDa). However, above pH 7.5, the R
G
values start to decrease, indicating oligomer dissocia-
tion. The value of 3.3 nm at pH 9.3 corresponds to the
monomeric state (Fig. 2A). The presence of the cofac-
tor ThDP or the activator ADP cannot completely
prevent oligomer dissociation, but stabilizes the tetra-
meric state against increasing pH. Even at pH 9.1, R
G
values of 3.7 nm and molecular masses of 150–
160 kDa were obtained for ThDP–EcODC and ADP–
EcODC solutions. These values are typical for dimers.
As stated above, the crystal structures of the three
complexes do not differ significantly in their overall
structure. In order to determine whether the same is
true for the structure of the complexes in aqueous
solutions, crystal and solution structures were com-
pared. Superposition of structures can be performed
on the basis of 3D models or using experimental
SAXS data and scattering patterns calculated from
crystal structure models. In the first case, structure
models are calculated ab initio from SAXS scattering
patterns (Fig. 5D). However, the resulting solution
structure models are not unique because of extrapola-
tion from 1D experimental data to 3D models with
low spatial resolution (maximum 2.5 nm). Therefore,
we prefer data comparison in reciprocal space. Using
the program crysol [16] from the ATSAS program
suite for small-angle scattering data analysis from
biological macromolecules, theoretical scattering pat-
terns can be calculated from the crystal structure mod-
els and overlaid on experimental scattering patterns.
The degree of similarity can be evaluated from the
resulting v values [16]. The best fits to crystal struc-
tures were obtained for ADP–EcODC and ThDP–
A
B
C
D
Fig. 5. Small-angle X-ray solution scattering
of EcODC. (A) Dependence of the scattering
parameter R
G
on the concentration of
EcODC in the presence of 10 m
M
ThDP ⁄ MgSO
4
(open circles). The line is
shown for better visualization only. (B) pH
dependence of the scattering parameter R
G
of apo-EcODC (open circles), apo-EcODC in
the presence of 10 m
M ThDP ⁄ MgSO
4
(triangles), and apo-EcODC in the presence
of 10 m
M ADP (squares), respectively. Lines
are shown for better visualization only.
(C) Superposition of experimental scattering
patterns of EcODC solutions (open grey
circles) and theoretical patterns calculated
from the crystal structure model 2q27 (black
solid lines). Left, 2.9 mg EcODCÆmL
)1
,
10 m
M ThDP, pH 6.9 (v = 1.195); right,
4.6 mg EcODCÆmL
)1
(apo-enzyme), pH 9.3
(v = 3.032). (D) Superposition of structure
models of the ADP-EcODC complex in
crystal and solution. The crystal structure of
2q28 is shown in ribbon and line style in
deepsalmon, the solution structure model of
ADP-ThDP-EcODC calculated from
experimental scattering patterns using the
program
DAMMIN [29] is shown as aquamarin
spheres. The structures on the left hand
side are rotated 90° around the y axis
(middle) and z axis (right hand side).
Studies on oxalyl CoA decarboxylase of E. coli T. Werther et al.
2634 FEBS Journal 277 (2010) 2628–2640 Journal compilation ª 2010 FEBS. No claim to original US government works
EcODC solutions at 3 mg EcODCÆmL
)1
and pH 6.9
(Fig. 5C). When the corresponding scattering patterns
were superimposed on the calculated patterns of the
three crystal structure models 2q27, 2q28 and 2q29, no
significant differences were obtained at a spatial resolu-
tion of 2.5 nm (v values of 1.192, 1.492, 1.264 and
1.195, 1.377, 1.382, respectively). The high degree of
accordance is also obvious from superposition of the
solution and crystal structure models (Fig. 5D).
Using dimers and tetramers of the crystal structure
model 2q27, the best fits for apoenzyme solutions at
various pH values were obtained for the dimer at pH
9.3 (v 3.032, Fig. 5C) and for the tetramer at pH
6.95 (v 3.881), respectively. On one hand, this con-
firms the conclusion from the SAXS studies on the
pH dependence of oligomer dissociation. On the other
hand, the higher v values demonstrate conformational
differences between the apoenzyme of EcODC in
solution and the crystal structure of the ThDP–
EcODC complex. These structural deviations are
illustrated by significant differences between experi-
mental and calculated scattering patterns at s values
of 1–1.5 nm
)1
(Fig. 5C).
Novel continuous kinetic assay
Previous kinetic studies on ODCs were performed
either discontinuously by monitoring the decarboxyl-
ation of oxalyl CoA to formyl CoA by HPLC and
capillary electrophoresis, respectively [17,18], or contin-
uously by using two auxiliary enzymes, formate dehy-
drogenase and formyl CoA transferase [2]. Here,
a kinetic assay was established to directly monitor
changes in the UV absorbance of the substrate oxal-
yl CoA during catalysis. Oxalyl CoA was synthesized
[19] and further purified by reverse-phase HPLC [20].
The novel assay is based on spectroscopic studies by
Quayle [7] reporting that decarboxylation of oxal-
yl CoA is accompanied by a decrease in absorbance at
265 nm and a concomitant increase at 235 nm
(Fig. 6A). An absorbance coefficient of 3300 m
)1
Æcm
)1
at 235 nm and pH 6.5 was determined for the purified
oxalyl CoA in the present study. All kinetic measure-
ments were performed by directly monitoring the
increase in absorbance at 235 nm, which corresponds
to the decarboxylation of oxalyl CoA. The progress
curves (Fig. 6B) illustrate that (a) a clear signal is
detectable even at low substrate concentrations; (b)
steady state is readily established as illustrated by the
linearity in the early stage of the progress curves; (c)
substrate is completely converted; and (d) the non-
enzymatic reaction is not significant, as expected.
Thus, the continuous assay provides quantitative infor-
mation on formation of formyl CoA in a simple to
perform manner.
Kinetic characterization
The steady-state kinetics displayed Michaelis–Menten
behaviour under all conditions used. The pH optimum
for the catalytic activity of EcODC was in the broad
A
B
Fig. 6. Spectral changes during decarboxylation of oxalyl CoA.
(A) UV ⁄ Vis spectra of oxalyl CoA (solid black line) and formyl CoA
(solid dark grey line) dissolved in 25 m
M sodium phosphate, pH 6.5.
The dashed line indicates the difference spectrum. (B) Progress
curves for the catalytic decarboxylation of oxalyl CoA (1, 0 l
M;2,
10 l
M; 3, 16.0 lM;4,35lM;5,50lM)byEcODC (0.26 lgÆmL
)1
)at
30 °C.
T. Werther et al. Studies on oxalyl CoA decarboxylase of E. coli
FEBS Journal 277 (2010) 2628–2640 Journal compilation ª 2010 FEBS. No claim to original US government works 2635
pH range 5.5–7.0. Similar ranges have been reported
for ODCs from O. formigenes and P. oxalaticus [2,7].
For the substrate oxalyl CoA, a K
M
of 4.8 lm and a
k
cat
of 60.7 per second and subunit were determined
from steady-state measurements at pH 6.5 and 30 °C
(Fig. 7 and Table 2). EcODC has a considerably higher
catalytic efficiency (k
cat
⁄ K
M
) than OfODC (12.6 versus
3.8 mm
)1
Æs
)1
). This is mainly due to the fivefold lower
K
M
of oxalyl CoA [3]. The SAXS studies imply that
the tetrameric state is the catalytically active one.
Coenzyme A competitively inhibits the decarboxylation
catalysed by EcODC (K
I
of 80 lm; Fig. 7A and
Table 2). However, the affinity of CoA for EcODC is
five times higher than that for OfODC, for which weak
mixed-type inhibition (400 and 270 lm) was found. In
the case of EcODC, the presence of 300 lm ADP, an
activator of ODC catalysis, resulted in a marginal
increase in k
cat
and a small decrease in K
M
, leading to a
1.7-fold higher catalytic efficiency (Fig. 7B and
Table 2). Similar weak activating effects have been
observed for ATP and AMP (data not shown). An
approximately threefold increase in catalytic activity
was observed for OfODC in the presence of ADP [3].
Obviously, the physiological importance of ADP acti-
vation as postulated for O. formigenes is weaker for
E. coli, as oxalate degradation seems to play no role in
energy generation in the latter organism under normal
environmental conditions.
Discussion
Our results show that the gene yfdU from E. coli
encodes an enzyme that exhibits oxalyl CoA decarbox-
ylase activity in vitro. Three crystal structures of
EcODC complexes (with the cofactor ThDP, with
ThDP and the activator ADP, and with ThDP and the
substrate analogue acetyl CoA, respectively) indicate a
tetrameric enzyme, with binding of neither ThDP,
ADP nor PADP (the part of acetyl CoA found in the
crystal structure) inducing significant alterations of the
protein conformation. This is also valid for the solu-
tion structures as determined using SAXS. Superposi-
tion of solution and crystal structures showed a very
high degree of accordance, except for ThDP–ace-
tyl CoA–EcODC. The scattering patterns of the latter
do not match any of the crystal structures, indicating
that binding of acetyl CoA may induce changes in the
protein conformation in solution. Berthold et al. [4]
published crystal structures of OfODC in complex with
the substrate, the post-decarboxylation intermediate
and the product. The only difference between these
structure complexes and that for holo-Of ODC without
additional ligands [3] was a ligand induced ordering of
the C-terminus (residues 553–565). For EcODC, the
only structural effect of binding of ADP was a
partially ordered C-terminus (residues 551–555). In
A
B
Fig. 7. Influence of the inhibitor CoA and the activator ADP on the
steady-state kinetics of EcODC catalysis. (A) Plots of v against [S]
in the absence (circles) and presence of various concentrations of
CoA (squares, 30 l
M; triangles, 60 lM; inverse triangles, 120 lM;
lines, hyperbolic fits). (B) Plots of v against [S] in the absence (open
circles) and presence of 60 l
M (filled triangles) and 300 lM ADP
(filled squares), respectively. Lines indicate hyperbolic fits. The con-
centration of EcODC was 0.26 lgÆmL
)1
.
Table 2. Kinetic constants for the decarboxylation of oxalyl CoA
catalysed by EcODC in the absence and presence of the inhibitor
CoA and the activator ADP. The errors given are the fitting errors.
Additions K
M
(lM) k
cat
(s
)1
)
k
cat
⁄ K
M
(s
)1
ÆlM
)1
)
None 4.82 ± 0.31 60.7 ± 0.89 12.6
30 l
M CoA 7.95 ± 0.68 59.2 ± 1.31 7.4
60 l
M CoA 12.00 ± 0.71 59.9 ± 1.14 5.0
120 l
M CoA 11.02 ± 0.73 52.8 ± 1.15 4.8
60 l
M ADP 3.37 ± 0.35 61.1 ± 1.57 18.1
300 l
M ADP 3.17 ± 0.45 69.7 ± 2.66 22.0
Studies on oxalyl CoA decarboxylase of E. coli T. Werther et al.
2636 FEBS Journal 277 (2010) 2628–2640 Journal compilation ª 2010 FEBS. No claim to original US government works
both enzyme species, the C-terminal part of the subun-
its is not involved in crystal packing contacts. From
these results, it may be concluded that the prime effect
of ADP activation on the enzyme conformation is the
freezing of this part of the subunit to reduce its flexi-
bility and thus to shield the active site from the envi-
ronment. This is likely to enhance the rate of cofactor
activation (deprotonation of the C2 atom of ThDP
[21]) as well as the rate of decarboxylation [22]. A sim-
ilar activation mechanism is probably operative in
pyruvate decarboxylases from yeast species [21].
Although the crystal structures of the holoenzyme
species from E. coli and O. formigenes are virtually
identical, the enzymes differ in their kinetic behaviour.
This difference is not obvious from the crystal struc-
ture of the ThDP binding sites formed by identical
amino acid residues in both species. However, in the
case of OfODC, a thiazolon cofactor analogue was
found at the active site even though ThDP was added
to the crystallization mixture. The reason for this strik-
ing difference is as yet unclear. The significantly higher
affinities of the substrate oxalyl CoA and the inhibitor
CoA for EcODC may be caused by two additional
hydrogen bond interactions (S265 and N404) in the
substrate binding site found for PADP in this enzyme
species. The corresponding side chains in OfODC
(A267 and M409) do not tend to form hydrogen bonds
with either the substrate or the inhibitor. Thus, these
structural differences could well be the reason for the
kinetic differences seen between the two enzyme
species. On the other hand, the differing kinetic con-
stants could be also partially due to the different
assays used, our novel continuous spectroscopic one
for EcODC and the discontinuous HPLC-based assay
for OfODC. The continuous assay appears to be the
more reliable and more direct approach, as whole
progress curves can be conveniently recorded.
The identical architecture of the ADP binding sites
of both species means that no structural explanation is
possible for the differing activating effects of ADP.
However, electron density for ADP was found in the
crystal structure of OfODC, even when no ligand was
added [3]. ADP was clearly detectable in the structure
of EcODC only if the ligand was present during
crystallization. The poor ADP activation of EcODC
presumably reflects the minor physiological relevance
of oxalate degradation for the energy metabolism of
E. coli. Thus, it is conceivable that non-oxalotrophic
bacteria only require enzymes for oxalate detoxifica-
tion under certain conditions [9]. Future studies of
other putative oxalyl CoA decarboxylases are required
to unravel this phenomenon, as well as the molecular
basis of ADP activation.
Experimental procedures
Unless otherwise stated, all chemicals and reagents were
purchased from Sigma-Aldrich Chemie GmbH (Steinheim,
Germany), VWR International GmbH (Darmstadt,
Germany) or AppliChem GmbH (Darmstadt, Germany),
and were of the highest available purity.
Protein expression and purification
The plasmid pMS470-115 ⁄ 6 ⁄ 5 was generously supplied by
Johannes Steinreiber (Dept. for Organic Chemistry, Univer-
sity of Graz, Austria). It carries the gene for oxalyl CoA
decarboxylase from E. coli under the control of a Tac pro-
moter, and was used to transform E. coli BL21 cells. The
cells were grown at 30 °Cin2· YT-ampicillin medium (1%
w ⁄ v yeast extract, 2% w ⁄ v tryptone, 1% w ⁄ v NaCl and
50 lgÆmL
)1
ampicillin) in shaking flasks. When the solution
had reached an absorbance of 0.8 at 600 nm, expression of
EcODC was induced by adding 0.5 mm isopropyl thio-b-d-
galactopyranoside. After 10 h of growth at 30 °C, corre-
sponding to an absorbance at 600 nm of 3.5–3.8, the cells
were harvested by centrifugation (2800 g, 20 min, 4 °C).
Approximately 20 g of cells were suspended in 40 mL 0.1 m
sodium phosphate, pH 7.0, containing 0.1 mm
ThDP ⁄ MgSO
4
,5%v⁄ v glycerol, 1 mm phenylmethanesulfo-
nyl fluoride, 1 mm dithiothreitol (DTT) and 1 mm EDTA,
and disrupted using a French press (five passages at
1200 bar). The homogenate was clarified by centrifugation
(70 000 g, 30 min), and the supernatant was diluted to
40 mg proteinÆmL
)1
using the same buffer. Nucleic acids
were eliminated by streptomycin sulfate precipitation (0.1%
w ⁄ v, 30 min agitation at 8 °C, and 25 min centrifugation at
70 000 g). After two subsequent ammonium sulfate precipi-
tations (15 g ⁄ 100 mL each), the pellet was resuspended in
25 mm Tris ⁄ HCl, pH 7.5. The protein solution was dialysed
twice for 5 h against 25 mm Tris ⁄ HCl, pH 7.5, 1 mm DTT,
with or without 150 mm NaCl, and then further purified by
anion-exchange chromatography using Q-Sepharose (GE
Healthcare, Munich, Germany; column size, diameter
26 · length 100 mm). Elution was performed with a linear
gradient of 500 mL of 100–400 mm NaCl in 25 mm
Tris ⁄ HCl, pH 7.5. The EcODC-containing fractions, eluting
at 150–300 mm NaCl, were pooled and precipitated by
adding 32 g ammonium sulfate per 100 mL. After centrifu-
gation (40 000 g, 15 min), the pellet was resuspended in
50 mm MES ⁄ NaOH, pH 6.5, 0.2 m ammonium sulfate,
applied on Superdex 200 (GE Healthcare; column size,
diameter 26 · length 600 mm), and eluted at a flow rate of
0.5 mLÆmin
)1
using the same buffer. Eluted fractions were
analysed by SDS–PAGE. EcODC-containing fractions with
> 95% homogeneity were pooled, flash-frozen in liquid
nitrogen, and stored at )80 °C. The identity of the purified
enzyme was confirmed using a combination of tryptic diges-
tion and MALDI-TOF mass spectrometry.
T. Werther et al. Studies on oxalyl CoA decarboxylase of E. coli
FEBS Journal 277 (2010) 2628–2640 Journal compilation ª 2010 FEBS. No claim to original US government works 2637
Determination of protein concentration
The protein concentrations of samples containing absorbing
ligands, such as ThDP, ADP, CoA or acetyl CoA, were
determined by the Bradford assay [23] using BSA as the
standard. Otherwise, the protein concentration was measured
via UV absorbance using a calculated molar absorption
coefficient of 44 600 m
)1
Æcm
)1
at 280 nm for the EcODC
monomer ( />Synthesis of the substrate oxalyl CoA
Oxalyl CoA was synthesized by thiol ester interchange
between thiocresol oxalate and CoA [24]. Thiocresol
oxalate was synthesized as described previously [19]. The
resulting product was purified by reverse-phase HPLC as
described previously [17], but using a Lichrospher 100
column (Merck KgaA Darmstadt, Germany; diameter
4 · length 250 mm, particle size 12 lm) and a stepwise
linear gradient at a flow rate of 1 mLÆmin
)1
.
Determination of the molar absorption coefficient
of oxalyl CoA and formyl CoA
Synthesized and HPLC-purified oxalyl CoA was dissolved
in 25 mm sodium phosphate, pH 6.5. The UV ⁄ Vis spectra
for various dilutions were recorded using an Uvikon 941
spectrophotometer (Kontron Instruments, GmbH, Du
¨
ssel-
dorf, Germany). After addition of 0.7 lm EcODC, the mix-
ture was incubated for 15 min at 30 °C, resulting in
complete conversion of oxalyl CoA to formyl CoA.
UV ⁄ Vis spectra of the resulting solutions were recorded
simultaneously (Fig. 6A). The decarboxylation of oxal-
yl CoA was followed by monitoring the n fi p* transition
of the a carbonyl group of the substrate at 235 nm [7]. A
molar absorption coefficient of 3300 m
)1
Æcm
)1
was deter-
mined from the difference spectra and used for the
calculation of catalytic activities.
Activity assay
Catalytic activities were determined using Jasco UV560
(Jasco Labor- u. Datentechnik GmbH, Grob-Umstadt, Ger-
many) or Uvikon 941 spectrophotometers in 25 mm sodium
phosphate, pH 6.5 at 30 °C, with a final reaction volume of
300 lL. Over the typical time scale of several minutes, sol-
vent-catalysed hydrolysis of the thioester is not detectable
under these conditions (Fig. 6B). Prior to the measurements,
the enzyme stock solution (1 mgÆmL
)1
, 16.5 lm monomer)
was saturated with the cofactors ThDP and MgSO
4
(both
250 lm) and incubated for 20 min at 30 °C. The reaction was
started by addition of 15 lL enzyme solution to the reaction
mixture. A dissociation constant of 17 lm was estimated for
ThDP using fluorescence spectroscopy. The steady-state
kinetic constants K
M
and k
cat
were determined by non-linear
regression of the data for the corresponding plots of v against
[S] according to the Michaelis–Menten equation.
Small-angle X-ray solution scattering
Data were collected using beamline X33 of the EMBL Ham-
burg Outstation (DORIS storage ring, Deutsches Elektronen
Synchrotron, Hamburg, Germany). Measurements were per-
formed at 16 °C with a camera length of 2.7 m using a
MAR345 image plate detector and a new vacuum sample
cell [25]. For s axis calibration (s =4psinh ⁄ k, where 2h is
the scattering angle and k is 0.15 nm, the X-ray wavelength),
collagen or tripalmitate was used. The scattering patterns
were collected for 120 s. Primary image files were extracted
during data collection for intensity normalization (transmit-
ted flux, detector response, s axis scaling) using the data
reduction program automar [26]. EcODC samples were
concentrated using centrifugal concentrators. If necessary,
the buffer was exchanged simultaneously. The influence of
protein concentration was studied for the range 0.7–
23 mg EcODCÆmL
)1
in 0.1 m Bis ⁄ Tris, pH 6.4, 10 mm
ThDP ⁄ MgSO
4
,5mm DTT in the absence and presence of
5mm coenzyme A. The effect of the activator ADP was
investigated for the range 0–50 mm in the same buffer at a
protein concentration of 5 mgÆmL
)1
. The dependence of the
oligomerization state of the enzyme on pH was measured
from pH 5.6–9.5 in various buffers, each at 0.1 m ionic
strength in the presence of 5 mm DTT in the absence or
presence of 5 mm ThDP ⁄ MgSO
4
as well as 10 mm ADP at
5 mg enzymeÆmL
)1
. Immediately before and after the
recording of protein scattering curves, the scattering pattern
for a buffer containing all components except EcODC was
measured. The scattering patterns of the buffer were merged
and subtracted from the corresponding enzyme-containing
patterns using the program primus-mar [27]. The forward
scattering intensity I
(0)
and the radius of gyration R
G
were
determined using the program gnom [28]. The molecular
masses of EcODC samples were calculated based on the
ratio between the I
(0)
of EcODC and that of BSA
(4 mgÆmL
)1
) and the molecular mass of the latter (67 kDa).
Theoretical scattering patterns were calculated from the
crystal structure models using the program crysol [16];
solution structure models were calculated from experimental
scattering patterns using the program dammin [29].
Crystallization
The purified EcODC was concentrated to 20 mgÆmL
)1
, and
the buffer was changed to 25 mm MES ⁄ NaOH, pH 6.5,
5mm ThDP ⁄ MgSO
4
for the ThDP–EcODC complex. To
obtain the complexes ThDP–ADP–EcODC or ThDP–ace-
tyl CoA–EcODC, 10 mm ADP or 2 mm acetyl CoA were
added. All EcODC complexes were crystallized by the
Studies on oxalyl CoA decarboxylase of E. coli T. Werther et al.
2638 FEBS Journal 277 (2010) 2628–2640 Journal compilation ª 2010 FEBS. No claim to original US government works
hanging drop vapour diffusion technique [30]. The drops
contained equal volumes (2 lL) of reservoir solution and
EcODC complex. The following reservoir solutions were
applied: 100 mm MES ⁄ NaOH, pH 6.5 and 1.5 m ammo-
nium sulfate for ThDP–EcODC, 100 mm MES ⁄ NaOH, pH
6.25 and 1.75 m ammonium sulfate for ThDP–ADP–
EcODC, and 100 mm MES ⁄ NaOH, pH 6.0, 0.2 m sodium
acetate and 5% w ⁄ v poly(ethylene glycol) 4000 for ThDP–
acetyl CoA–EcODC. Typically, crystals appeared after
3 days of incubation at 8 °C.
Data collection
Crystals were incubated in cryosolutions containing 20%
v ⁄ v ethylene glycol and 80% of the corresponding reservoir
solution. Diffraction data were collected at 100 K using
beamlines X12 and BW7A of the EMBL Hamburg Outsta-
tion (DORIS storage ring, Deutsches Elektronen Synchro-
tron, Hamburg, Germany) using detectors MARCCD-225
or MARCCD-165. The datasets were indexed, integrated
and scaled using the programs denzo and scalepack [31].
Intensities were converted to structure factor amplitudes
using the program truncate [32,33].
Structure determination and crystallographic
refinement
Initial phases were obtained by using the molecular replace-
ment method (program molrep [32]). The Expasy proteo-
mics server ( [34] was used to
generate a theoretical search model from the amino acid
sequence of EcODC based on the structure of OfODC
(PDB ID 2c31). The asymmetric unit contains two mono-
mers. Inspection of electron density maps, model building
and refinement were performed using refmac5 [32] and
Coot [35] until the free R factor and the crystallographic
R factor could not be improved further. For calculation of
the R
free
values, 1% (ThDP–ADP–EcODC and ThDP–ace-
tyl CoA–EcODC) and 5% (ThDP–EcODC) of reflections,
respectively, were randomly chosen. The final models were
validated using procheck [35]. All crystal structure figures
were prepared using Pymol ().
Acknowledgements
We gratefully acknowledge Dr Peter Konarev (EMBL
Outstation Hamburg) for helpful discussions on inter-
pretation of SAXS data using the program crysol,
Dr Johannes Steinreiber (Department for Organic
Chemistry, University of Graz, Austria) for providing
the plasmid used for expression of EcODC. Access to
the EMBL beamlines X33, X12 and BW7A in Hasylab
at the DORIS storage ring, Deutsches Elektronen Syn-
chrotron, Hamburg, is acknowledged.
References
1 Hodgkinson A (1977) Oxalate content of foods and
nutrition. In Oxalic Acid in Biology and Medicine
(Hodgkinson A, ed), pp. 193–212. Academic Press,
London.
2 Baetz AL & Allison MJ (1989) Purification and charac-
terization of oxalyl-coenzyme A decarboxylase from
Oxalobacter formigenes. J Bacteriol 171, 2605–2608.
3 Berthold CL, Moussatche P, Richards NG & Lindqvist
Y (2005) Structural basis for activation of the thiamin
diphosphate-dependent enzyme oxalyl-CoA decarboxyl-
ase by adenosine diphosphate. J Biol Chem 280, 41645–
41654.
4 Berthold CL, Toyota CG, Moussatche P, Wood MD,
Leeper F, Richards NG & Lindqvist Y (2007) Crystal-
lographic snapshots of oxalyl-CoA decarboxylase give
insights into catalysis by nonoxidative ThDP-dependent
decarboxylases. Structure 15, 853–861.
5 Muller YA, Lindqvist Y, Furey W, Schulz GE, Jordan
F & Schneider G (1993) A thiamin diphosphate binding
fold revealed by comparison of the crystal structures of
transketolase, pyruvate oxidase and pyruvate decarbox-
ylase. Structure 1, 95–103.
6 Sahin N (2003) Oxalotrophic bacteria. Res Microbiol
154, 399–407.
7 Quayle JR (1963) Carbon assimilation by Pseudomo-
nas oxalaticus (Ox1). 7. Decarboxylation of oxalyl-coen-
zyme A to formyl-coenzyme A. Biochem J 89, 492–503.
8 Gruez A, Roig-Zamboni V, Valencia C, Campanacci V
& Cambillau C (2003) The crystal structure of the
Escherichia coli yfdW gene product reveals a new fold
of two interlaced rings identifying a wide family of CoA
transferases. J Biol Chem 278, 34582–34586.
9 Toyota CG, Berthold CL, Gruez A, Jo
´
nsson S,
Lindqvist Y, Cambillau C & Richards NGJ (2008)
Differential substrate specificity and kinetic behavior of
Escherichia coli YfdW and Oxalobacter formigenes
formyl coenzyme A transferase. J Bacteriol 190, 2556–
2564.
10 Hawkins CF, Borges A & Perham RN (1989) A com-
mon structural motif in thiamin pyrophosphate-binding
enzymes. FEBS Lett 255, 77–82.
11 Kaplun A, Binshtein E, Vyazmensky M, Steinmetz A,
Barak Z, Chipman DM, Tittmann K & Shaanan B
(2008) Glyoxylate carboligase lacks the canonical active
site glutamate of thiamine-dependent enzymes. Nat
Chem Biol 4, 113–118.
12 Shukla A, Mylonas E, Di Cola E, Finet S, Timmins P,
Narayanan T & Svergun DI (2008) Absence of equilib-
rium cluster phase in concentrated lysozyme solutions.
Proc Natl Acad Sci USA 105, 5075–5080.
13 Javid N, Vogtt K, Krywka C, Tolan M & Winter R
(2007) Protein–protein interactions in complex cosolvent
solutions. Chemphyschem 8, 679–689.
T. Werther et al. Studies on oxalyl CoA decarboxylase of E. coli
FEBS Journal 277 (2010) 2628–2640 Journal compilation ª 2010 FEBS. No claim to original US government works 2639
14 Kutter S, Spinka M, Koch MHJ & Ko
¨
nig S (2007) The
influence of protein concentration on oligomer structure
and catalytic function of two pyruvate decarboxylases.
Protein J 26, 585–591.
15 Schu
¨
tz A, Golbik R, Tittmann K, Svergun DI, Koch
MHJ, Hu
¨
bner G & Ko
¨
nig S (2003) Studies on
structure–function relationships of indolepyruvate
decarboxylase from Enterobacter cloacae – a key
enzyme of the indole acetic acid pathway. Eur J
Biochem 270, 2322–2331.
16 Svergun D, Barberato C & Koch MHJ (1995) CRY-
SOL – a program to evaluate X-ray solution scattering
of biological macromolecules from atomic coordinates.
J Appl Crystallogr 28, 768–773.
17 Jonsson S, Ricagno S, Lindqvist Y & Richards NG
(2004) Kinetic and mechanistic characterization of the
formyl-CoA transferase from Oxalobacter formigenes .
J Biol Chem 279, 36003–36012.
18 Bendazzoli C, Turroni S, Gotti R, Olmo S, Brigidi P &
Cavrini V (2007) Determination of oxalyl-coenzyme A
decarboxylase activity in Oxalobacter formigenes and
Lactobacillus acidophilus by capillary electrophoresis.
J Chromatogr B Analyt Technol Biomed Life Sci 854,
350–356.
19 Stolle R (1914) U
¨
ber Methylthionaphtenchinon. Ber
Dtsch Chem Ges 47, 1130–1132.
20 Sly W & Stadtman ER (1963) Formate metabolism: I.
Formyl coenzyme A, an intermediate in the formate-
dependent decomposition of acetyl-phosphate in
Clostridium kluyveri. J Biol Chem 238, 2632–2638.
21 Kern D, Kern G, Neef H, Tittmann K, Killenberg-Jabs
M, Wikner C, Schneider G & Hu
¨
bner G (1997) How
thiamine diphosphate is activated in enzymes. Science
275, 67–70.
22 Crosby J & Lienhard GE (1970) Mechanism of
thiamine-catalyzed reactions. A kinetic analysis of the
decarboxylation of pyruvate by 3,4-dimethylthiazolium
ion in water and ethanol. J Am Chem Soc 92, 5707–
5716.
23 Bradford MM (1976) A rapid and sensitive method for
the quantitation of microgram quantities of protein
utilizing the principle of protein–dye binding. Anal
Biochem 72, 248–254.
24 Lipmann F & Tuttle C (1945) A specific micromethod
for the determination of acyl phosphates. J Biol Chem
159, 21–28.
25 Roessle MW, Klaering R, Ristau U, Robrahn B, Jahn
B, Gehrmann T, Konarev P, Round A, Fiedler S,
Hermes C et al. (2007) Upgrade of the small-angle
X-ray scattering beamline X33 at the European
Molecular Biology Laboratory, Hamburg. J Appl
Crystallogr 40, 190–194.
26 Petoukhov MV, Konarev PV, Kikhney AG & Svergun
DI (2007) ATSAS2.1 – towards automated and web-
supported small-angle scattering data analysis. J Appl
Crystallogr 40, 223–228.
27 Konarev PV, Volkov VV, Sokolova AV, Koch MHJ &
Svergun DI (2003) PRIMUS: a Windows PC-based
system for small angle scattering data analysis. J Appl
Crystallogr 36, 1277–1282.
28 Svergun DI (1992) Determination of the regularization
parameter in indirect-transform methods using percep-
tual criteria. J Appl Crystallogr 25, 495–503.
29 Svergun D (1999) Restoring low resolution structure of
biological macromolecules from solution scattering
using simulated annealing. Biophys J 76, 2879–2886.
30 Hampel A, Labananskas M, Conners PG, Kirkegard L,
RajBhandary UL, Sigler PB & Bock RM (1968) Single
crystals of transfer RNA from formylmethionine and
phenylalanine transfer RNA’s. Science 162, 1384–1387.
31 Otwinowski Z & Minor W (1997) Processing X-ray
diffraction data collected in oscillation mode. Methods
Enzymol 276, 307–326.
32 Collaborative Computational Project (1994) The CCP4
suite: programs for protein crystallography. Acta
Crystallogr D Biol Crystallogr 50, 760–763.
33 French S & Wilson K (1978) Treatment of
negative intensity observations. Acta Crystallogr A 34,
517–525.
34 Schwede T, Kopp J, Guex N & Peitsch MC (2003)
SWISS-MODEL: an automated protein homology-mod-
eling server. Nucleic Acids Res 31, 3381–3385.
35 Emsley P & Cowtan K (2004) Coot: model-building
tools for molecular graphics. Acta Crystallogr D Biol
Crystallogr 60, 2126–2132.
Studies on oxalyl CoA decarboxylase of E. coli T. Werther et al.
2640 FEBS Journal 277 (2010) 2628–2640 Journal compilation ª 2010 FEBS. No claim to original US government works