The 2000-2005 World Outlook for Nursing Home Care doc
Bạn đang xem bản rút gọn của tài liệu. Xem và tải ngay bản đầy đủ của tài liệu tại đây (424.43 KB, 125 trang )
www.icongroupedition.com
Ó2002 Icon Group Ltd.
The 2000-2005 World Outlook
for Nursing Home Care
ii
www.icongroupedition.com
Ó2002 Icon Group Ltd.
COPYRIGHT NOTICE
ISBN: 0-7576-5513-0
All of Icon Group Ltd. publications are copyrighted. Copying our publications in
whole or in part, for whatever reason, is a violation of copyrights laws and can lead
to penalties and fines.
Should you want to copy tables, graphs or other materials from our publications,
please contact us to request permission. Icon Group Ltd. often grants permission for
very limited reproduction of our publications for internal use, press releases, and
academic research. Such reproduction requires, however, confirmed permission from
Icon Group Ltd. Please read the full copyright notice, disclaimer, and user
agreement provisions at the end of this report.
IMPORTANT DISCLAIMER
Neither Icon Group Ltd. nor its employees can be held accountable for the use and
subsequent actions of the user of the information provided in this publication. Great
efforts have been made to ensure the accuracy of the data, but we can not
guarantee, given the volume of information, accuracy. Since the information given in
this report is forward-looking, the reader should read the disclaimer statement and
user agreement provisions at the end of this report.
iii
www.icongroupedition.com
Ó2002 Icon Group Ltd.
About Icon Group Ltd.
Icon Group Ltd.’s primary mission is to assist managers with their international information needs using forward-
looking economic analysis. Icon Group has field offices in San Diego, Paris, Singapore, Hong Kong and Lomé,
Togo (West Africa). Icon Group has published hundreds of multi-client databases, and global/regional market data,
industry and country publications.
Global/Regional Management Studies. Summarizing over 210 countries, management studies are generally
organized into regional volumes and cover key management functions. The human resource series covers minimum
wages, child labor, unionization and collective bargaining. The international law series covers media control and
censorship, search and seizure, and trial justice and punishment. The diversity management series covers a variety of
environmental context drivers that effect global operations. These include women’s rights, children’s rights,
discrimination/racism, and religious forces and risks. Global strategic planning studies cover economic risk
assessments, political risk assessments, foreign direct investment strategy, intellectual property strategy, and export
strategy. Financial management studies cover taxes and tariffs. Global marketing studies focus on target segments
(e.g. seniors, children, women) and strategic marketing planning.
Country Studies: Often managers need an in-depth, yet broad and up-to-date understanding of a country’s strategic
market potential and situation before the first field trip or investment proposal. Covering over 190 countries, each
study consists of forward-looking analysis, statistics, forecasts, and information of relevance to managers. The
studies are continually updated to ensure that the reports have the most relevant information available. In addition to
raw information, the reports provide relevant analyses which put a more general perspective on a country (seen in the
context of relative performance vis-à-vis benchmarks).
Industry & Trade Studies: Companies are racing to become more international, if not global in their strategies. For
over 2000 product/industry categories, these reports give the reader a concise summary of latent market forecasts,
pro-forma financials, import competition profiles, key references and trends across 200 countries of the world. Some
reports focus on a particular product and region (up to four regions per product), while others focus on a product
within a particular country.
Intranet Subscriptions: Icon Group Ltd. now offers full intranet subscriptions which brings millions of dollars of
high-end global market research to the manager’s personal computer. For more information, please contact Icon
Group via our web site: www.icongroupedition.com, or please email:
In addition to these reports, Icon Group publishes similar studies for other product categories, issue areas, regions of
the world, countries, cities and states (in the case of the United States). If you wish to receive a report that is
customized or addressing a particular issue, feel free to contact Icon Group:
Icon Group
Customer Service
4370 La Jolla Village Drive, Fourth Floor
San Diego, CA 92122 USA
Tel: 858-546-4340
Fax: 858-546-4341
Email:
URL: www.icongroupedition.com
Note: as statements and statistics in this report are forward-looking, the reader needs to read the last chapter for
disclaimers and user agreement provisions.
Contents iv
www.icongroupedition.com
Ó2002 Icon Group Ltd.
Table of Contents
1 INTRODUCTION 9
1.1 Overview 9
1.2 Market Potential Estimation Methodology 9
1.3 The Worldwide Market Potential for Nursing home care 11
2 AFRICA: NURSING HOME CARE 12
2.1 Executive Summary 12
2.2 Algeria 14
2.3 Angola 14
2.4 Benin 15
2.5 Botswana 15
2.6 Burkina Faso 16
2.7 Burundi 16
2.8 Cameroon 17
2.9 Cape Verde 17
2.10 Central African Republic 18
2.11 Chad 18
2.12 Comoros 19
2.13 Congo (formerly Zaire) 19
2.14 Djibouti 20
2.15 Egypt 20
2.16 Equatorial Guinea 21
2.17 Eritrea 21
2.18 Ethiopia 22
2.19 Gabon 22
2.20 Ghana 23
2.21 Guinea 23
2.22 Guinea-Bissau 24
2.23 Ivory coast 24
2.24 Kenya 25
2.25 Lesotho 25
2.26 Liberia 26
2.27 Libya 26
2.28 Madagascar 27
2.29 Malawi 27
2.30 Mali 28
2.31 Mauritania 28
2.32 Mauritius 29
2.33 Morocco 29
2.34 Mozambique 30
2.35 Namibia 30
2.36 Niger 31
2.37 Nigeria 31
Contents v
www.icongroupedition.com
Ó2002 Icon Group Ltd.
2.38 Republic of Congo 32
2.39 Rwanda 32
2.40 Sao Tome E Principe 33
2.41 Senegal 33
2.42 Sierra Leone 34
2.43 Somalia 34
2.44 South Africa 35
2.45 Sudan 35
2.46 Swaziland 36
2.47 Tanzania 36
2.48 The Gambia 37
2.49 Togo 37
2.50 Tunisia 38
2.51 Uganda 38
2.52 Zambia 39
2.53 Zimbabwe 39
3 ASIA: NURSING HOME CARE 40
3.1 Executive Summary 40
3.2 Bangladesh 42
3.3 Bhutan 42
3.4 Brunei 43
3.5 Burma 43
3.6 Cambodia 44
3.7 China 44
3.8 Hong Kong 45
3.9 India 45
3.10 Indonesia 46
3.11 Japan 46
3.12 Laos 47
3.13 Macau 47
3.14 Malaysia 48
3.15 Maldives 48
3.16 Mongolia 49
3.17 Nepal 49
3.18 North Korea 50
3.19 Papua New Guinea 50
3.20 Philippines 51
3.21 Seychelles 51
3.22 Singapore 52
3.23 South Korea 52
3.24 Sri Lanka 53
3.25 Taiwan 53
3.26 Thailand 54
3.27 Vietnam 54
Contents vi
www.icongroupedition.com
Ó2002 Icon Group Ltd.
4 EUROPE: NURSING HOME CARE 55
4.1 Executive Summary 55
4.2 Albania 57
4.3 Andorra 57
4.4 Austria 58
4.5 Belarus 58
4.6 Belgium 59
4.7 Bosnia and Herzegovina 59
4.8 Bulgaria 60
4.9 Croatia 60
4.10 Cyprus 61
4.11 Czech Republic 61
4.12 Denmark 62
4.13 Estonia 62
4.14 Finland 63
4.15 France 63
4.16 Georgia 64
4.17 Germany 64
4.18 Greece 65
4.19 Hungary 65
4.20 Iceland 66
4.21 Ireland 66
4.22 Italy 67
4.23 Kazakhstan 67
4.24 Latvia 68
4.25 Liechtenstein 68
4.26 Lithuania 69
4.27 Luxembourg 69
4.28 Macedonia 70
4.29 Malta 70
4.30 Moldova 71
4.31 Monaco 71
4.32 Netherlands 72
4.33 Norway 72
4.34 Poland 73
4.35 Portugal 73
4.36 Romania 74
4.37 Russia 74
4.38 Serbia and Montenegro 75
4.39 Slovakia 75
4.40 Slovenia 76
4.41 Spain 76
4.42 Sweden 77
4.43 Switzerland 77
Contents vii
www.icongroupedition.com
Ó2002 Icon Group Ltd.
4.44 Ukraine 78
4.45 United Kingdom 78
5 LATIN AMERICA: NURSING HOME CARE 79
5.1 Executive Summary 79
5.2 Argentina 80
5.3 Belize 81
5.4 Bolivia 81
5.5 Brazil 82
5.6 Chile 82
5.7 Colombia 83
5.8 Costa Rica 83
5.9 Ecuador 84
5.10 El Salvador 84
5.11 Guatemala 85
5.12 Guyana 85
5.13 Honduras 86
5.14 Mexico 86
5.15 Nicaragua 87
5.16 Panama 87
5.17 Paraguay 88
5.18 Peru 88
5.19 Suriname 89
5.20 Uruguay 89
5.21 Venezuela 90
6 NORTH AMERICA & THE CARIBBEAN: NURSING HOME CARE 91
6.1 Executive Summary 91
6.2 Antigua and Barbuda 93
6.3 Bahamas 93
6.4 Barbados 94
6.5 Bermuda 94
6.6 Canada 95
6.7 Cuba 95
6.8 Dominica 96
6.9 Dominican Republic 96
6.10 Grenada 97
6.11 Haiti 97
6.12 Jamaica 98
6.13 Martinique 98
6.14 Netherlands Antilles 99
6.15 St. Kitts and Nevis 99
6.16 St. Lucia 100
6.17 St. Vincent and the Grenadines 100
6.18 Trinidad and Tobago 101
Contents viii
www.icongroupedition.com
Ó2002 Icon Group Ltd.
6.19 United States 101
7 OCEANA: NURSING HOME CARE 102
7.1 Executive Summary 102
7.2 American Samoa 103
7.3 Australia 104
7.4 Fiji 104
7.5 Kiribati 105
7.6 Marshall Islands 105
7.7 Micronesia Federation 106
7.8 Nauru 106
7.9 New Zealand 107
7.10 Palau 107
7.11 Solomon Islands 108
7.12 Tonga 108
7.13 Tuvalu 109
7.14 Vanuatu 109
8 THE MIDDLE EAST: NURSING HOME CARE 110
8.1 Executive Summary 110
8.2 Afghanistan 112
8.3 Armenia 112
8.4 Azerbaijan 113
8.5 Bahrain 113
8.6 Iran 114
8.7 Iraq 114
8.8 Israel 115
8.9 Jordan 115
8.10 Kuwait 116
8.11 Kyrgyzstan 116
8.12 Lebanon 117
8.13 Oman 117
8.14 Pakistan 118
8.15 Qatar 118
8.16 Saudi Arabia 119
8.17 Syrian Arab Republic 119
8.18 Tajikistan 120
8.19 Turkey 120
8.20 Turkmenistan 121
8.21 United Arab Emirates 121
8.22 Uzbekistan 122
8.23 Yemen 122
9 DISCLAIMERS, WARRANTEES, AND USER AGREEMENT PROVISIONS 123
9.1 Disclaimers & Safe Harbor 123
9.2 Icon Group Ltd. User Agreement Provisions 124
Nursing Home Care 9
www.icongroupedition.com
Ó2002 Icon Group Ltd.
1 INTRODUCTION
1.1 OVERVIEW
The liberalization of markets has lead to record levels of international investments. Icon Group’s
primary mission is to assist international managers to better plan and implement strategies in a
global economy. It does so by providing various specialized industry reports, databases,
publications and services to its clients. This report is one of many published by Icon Group Ltd.
to assist executives and planners in monitoring and analyzing world markets. In addition to
industry-specific studies, Icon Group Ltd.’s reports cover human resources management, export
strategies, investment strategies, entry & marketing strategies, political and economic risk
assessments and legal trends (e.g., intellectual property, licensing, and corruption).
This report covers the world outlook for nursing home care across 235 countries. For each year
reported, the estimates are given for the latent demand for the country in question. Icon Group
uses a number of proprietary econometric models which project economic changes within each
country and across countries. From there, market potential estimates are created. The units used
in this report are: US $ mln.
As shown in the report, the market potential for nursing home care is expected to reach
$441,956.14 million by 2005. The distribution of the world market, however, will not be evenly
distributed across regions. Europe will be the largest market with $159,532.55 million or 36.10
percent, followed by North America & the Caribbean with $124,510.24 million or 28.17 percent,
and then Asia with $95,615.20 million or 21.63 percent of the world market. In essence, if a firm
targets these top 3 regions, they cover come 85.9 percent of the world wide demand for nursing
home care.
1.2 MARKET POTENTIAL ESTIMATION METHODOLOGY
Icon Group uses a number of methodologies to create market potential estimates for products and
services across markets, whether at the level of a region, country, or city. In this report, two
modelling approaches are used. The first involves modelling the economic fundamentals of each
market over time. This is based on standard models of economic growth (e.g. focussing on
growth of income, or gross domestic product per capita). The second approach is more subtle.
The second approach involves collecting information on the market size or market potential for
the particular product or service in question, typically in national currency, and translating these
into a common currency. Icon Group uses the U.S. dollar as its common currency across
markets. For some categories and markets, basic demand indicators are reported in national
statistics, as is mostly the case for the United States and other developed markets. In most of the
world’s 230 countries, however, few statistics are available. For these, Icon Group uses
Nursing Home Care 10
www.icongroupedition.com
Ó2002 Icon Group Ltd.
econometric models to estimate these markets, and forecast these over time. As true for all
forward-looking economic forecasts, certain critical assumptions must be made. Two types of
assumptions are made for the models used in this report. The first type covers the socio-
economic and global environment. In essence, Icon Group assumes that dynamics seen in the
past are likely to continue in the future, without major discontinuous changes. For example, if a
city, country or region has not seen civil strife, major recessions, or substantial foreign exchange
or currency changes, this is assumed to be the case over the forecast period. Likewise, the
worldwide demand is foreseen to progress in a fashion similar to that seen in historical figures,
based on aggregated data collected at the national level. The extent to which these assumptions
are violated in the future will surely affect the accuracy of the forecasts presented here.
The second type of assumption is of greater importance, especially for those markets where
insufficient local information is reported in the public domain, or in markets where there is higher
uncertainty. Here, we use cross-country econometric models of demand, often called a cross-
sectional pooled time series models with varying parameters. In simple terms, we assume an
underlying consumption function that is allowed to vary over time and across geographic
markets. Economists have long proposed various consumption functions. These include John
Maynard Keynes, Simon Kuznets, Irving Fisher, Franco Modigliani, Albert Ando, Richard
Brumberg, and Milton Friedman. Across these, and other authors, the consumption of a product
(as opposed to the amount produced) is foreseen to vary depending on a number of local factors
and the time frame that one considers (short-, medium- and long-run). In general, the variance of
the market potential across markets is foreseen to be a function of variances in income, wealth,
interest rates, expected future income, and a variety of exogenous factors, including geography
and culture. Icon Group forecasts primarily rely on non-cultural economic factors in modelling
cross-market demand, for a given product or service. We also model the market potential using a
consumption function which assumes a constant average propensity to consume in the long run
(i.e. as incomes rise, average consumption rates do not fall, as earlier argued by Keynes). Once
the cross-market model of demand is specified, it is combined with the local economic models
described above. As in all econometric exercises, the lack of local market figures in the public
domain results in estimation errors. Furthermore, many intervening factors may arise over time
that can materially affect the accuracy of the forecasts, including changes in local economic
conditions, changes in political regimes, improvements in primary data, and currency
fluctuations, among other factors. As the estimates and forecasts reported here are forward-
looking and subject to assumption-induced errors, you are asked to read the caveats and
disclaimers at the end of this report.
Nursing Home Care 11
www.icongroupedition.com
Ó2002 Icon Group Ltd.
1.3 THE WORLDWIDE MARKET POTENTIAL FOR NURSING
HOME CARE
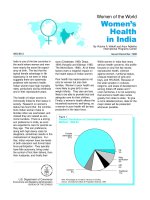
Worldwide Market Potential for Nursing home care (US $ mln): 2000
Region Latent Demand US $ mln % of Globe
_________________________________________________________________________________________________________
Europe 138,687 36.6
North America & the Caribbean 104,344 27.5
Asia 81,794 21.6
Latin America 20,297 5.4
Middle East 19,900 5.3
Africa 8,346 2.2
Oceana 5,630 1.5
Total 378,998 100.0
_________________________________________________________________________________________________________
Source: Icon Group Ltd., copyright 2000, www.icongroupedition.com
Worldwide Market Potential for Nursing home care (US $ mln): 2000
Europe
North America & the
Caribbean
Asia
Latin America
Other
World Market for Nursing home care: 1995 - 2005
Year World Market US $ mln
_________________________________________________________________________________________________________
1995 346,711.48
1996 354,032.67
1997 360,228.74
1998 367,275.99
1999 372,581.75
2000 379,717.06
2001 390,856.51
2002 402,972.96
2003 415,517.23
2004 428,505.87
2005 441,956.14
_________________________________________________________________________________________________________
Source: Icon Group Ltd., copyright 2000, www.icongroupedition.com
Nursing Home Care 12
www.icongroupedition.com
Ó2002 Icon Group Ltd.
2 AFRICA: NURSING HOME CARE
2.1 EXECUTIVE SUMMARY
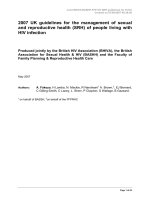
Market Potential for Nursing home care in Africa (US $ mln): 2000
Country Latent Demand US $ mln % of Africa
_________________________________________________________________________________________________________
South Africa 1,954 23.23%
Algeria 1,011 12.02%
Egypt 727 8.64%
Nigeria 570 6.77%
Libya 515 6.12%
Morocco 449 5.34%
Tunisia 255 3.03%
Cameroon 249 2.95%
Sudan 199 2.36%
Ivory coast 188 2.23%
Angola 174 2.06%
Kenya 173 2.05%
Congo (formerly Zaire) 170 2.01%
Tanzania 125 1.48%
Ghana 121 1.43%
Ethiopia 117 1.38%
Zimbabwe 114 1.35%
Senegal 108 1.28%
Uganda 105 1.24%
Gabon 96 1.14%
Botswana 67 0.79%
Zambia 64 0.75%
Burkina Faso 58 0.69%
Madagascar 56 0.66%
Guinea 52 0.62%
Other 630 8.28%
Total 8,346 100.00%
_________________________________________________________________________________________________________
Source: Icon Group Ltd., copyright 2000, www.icongroupedition.com
Nursing Home Care 13
www.icongroupedition.com
Ó2002 Icon Group Ltd.
Market Potential for Nursing home care in Africa (US $ mln): 2000
South Africa
Algeria
Egypt
Nigeria
Other
The Market for Nursing home care in Africa: 1995 - 2005
Year US $ mln % of Globe
_________________________________________________________________________________________________________
1995 8,049.73 2.32
1996 8,138.19 2.30
1997 8,202.56 2.28
1998 8,279.50 2.25
1999 8,322.44 2.23
2000 8,408.99 2.21
2001 8,646.77 2.21
2002 8,916.80 2.21
2003 9,196.23 2.21
2004 9,485.39 2.21
2005 9,784.65 2.21
_________________________________________________________________________________________________________
Source: Icon Group Ltd., copyright 2000, www.icongroupedition.com
Nursing Home Care 14
www.icongroupedition.com
Ó2002 Icon Group Ltd.
2.2 ALGERIA
Nursing home care (US $ mln): Algeria 1995 - 2005
Year Algeria % of Region % of Globe
_________________________________________________________________________________________________________
1995 986 12.24% 0.28%
1996 993 12.20% 0.28%
1997 997 12.15% 0.27%
1998 1,002 12.10% 0.27%
1999 1,004 12.05% 0.26%
2000 1,011 12.02% 0.26%
2001 1,043 12.05% 0.26%
2002 1,079 12.10% 0.26%
2003 1,117 12.15% 0.26%
2004 1,157 12.19% 0.26%
2005 1,198 12.24% 0.27%
_________________________________________________________________________________________________________
Source: Icon Group Ltd., copyright 2000, www.icongroupedition.com
2.3 ANGOLA
Nursing home care (US $ mln): Angola 1995 - 2005
Year Angola % of Region % of Globe
_________________________________________________________________________________________________________
1995 172 2.13% 0.00%
1996 173 2.12% 0.00%
1997 173 2.10% 0.00%
1998 173 2.09% 0.00%
1999 173 2.07% 0.00%
2000 174 2.06% 0.00%
2001 180 2.07% 0.00%
2002 187 2.09% 0.00%
2003 194 2.10% 0.04%
2004 201 2.11% 0.00%
2005 209 2.13% 0.00%
_________________________________________________________________________________________________________
Source: Icon Group Ltd., copyright 2000, www.icongroupedition.com
Nursing Home Care 15
www.icongroupedition.com
Ó2002 Icon Group Ltd.
2.4 BENIN
Nursing home care (US $ mln): Benin 1995 - 2005
Year Benin % of Region % of Globe
_________________________________________________________________________________________________________
1995 39 0.48% 0.00%
1996 39 0.47% 0.01%
1997 39 0.47% 0.00%
1998 38 0.46% 0.00%
1999 38 0.45% 0.00%
2000 38 0.45% 0.00%
2001 40 0.45% 0.00%
2002 41 0.46% 0.00%
2003 43 0.47% 0.01%
2004 45 0.47% 0.00%
2005 47 0.48% 0.00%
_________________________________________________________________________________________________________
Source: Icon Group Ltd., copyright 2000, www.icongroupedition.com
2.5 BOTSWANA
Nursing home care (US $ mln): Botswana 1995 - 2005
Year Botswana % of Region % of Globe
_________________________________________________________________________________________________________
1995 61 0.76% 0.00%
1996 63 0.76% 0.01%
1997 64 0.77% 0.00%
1998 65 0.78% 0.01%
1999 66 0.79% 0.00%
2000 67 0.79% 0.00%
2001 68 0.79% 0.00%
2002 70 0.78% 0.00%
2003 71 0.77% 0.00%
2004 73 0.77% 0.00%
2005 75 0.76% 0.00%
_________________________________________________________________________________________________________
Source: Icon Group Ltd., copyright 2000, www.icongroupedition.com
Nursing Home Care 16
www.icongroupedition.com
Ó2002 Icon Group Ltd.
2.6 BURKINA FASO
Nursing home care (US $ mln): Burkina Faso 1995 - 2005
Year Burkina Faso % of Region % of Globe
_________________________________________________________________________________________________________
1995 57 0.71% 0.00%
1996 58 0.70% 0.01%
1997 58 0.70% 0.00%
1998 58 0.70% 0.00%
1999 58 0.69% 0.00%
2000 58 0.69% 0.01%
2001 60 0.69% 0.00%
2002 62 0.70% 0.00%
2003 65 0.70% 0.00%
2004 67 0.70% 0.00%
2005 70 0.71% 0.00%
_________________________________________________________________________________________________________
Source: Icon Group Ltd., copyright 2000, www.icongroupedition.com
2.7 BURUNDI
Nursing home care (US $ mln): Burundi 1995 - 2005
Year Burundi % of Region % of Globe
_________________________________________________________________________________________________________
1995 21 0.25% 0.00%
1996 21 0.25% 0.00%
1997 21 0.25% 0.00%
1998 21 0.25% 0.00%
1999 22 0.25% 0.00%
2000 22 0.25% 0.00%
2001 22 0.25% 0.00%
2002 23 0.25% 0.00%
2003 24 0.25% 0.00%
2004 25 0.25% 0.00%
2005 25 0.25% 0.00%
_________________________________________________________________________________________________________
Source: Icon Group Ltd., copyright 2000, www.icongroupedition.com
Nursing Home Care 17
www.icongroupedition.com
Ó2002 Icon Group Ltd.
2.8 CAMEROON
Nursing home care (US $ mln): Cameroon 1995 - 2005
Year Cameroon % of Region % of Globe
_________________________________________________________________________________________________________
1995 233 2.89% 0.00%
1996 236 2.90% 0.00%
1997 239 2.91% 0.00%
1998 243 2.93% 0.00%
1999 245 2.94% 0.00%
2000 249 2.95% 0.00%
2001 255 2.94% 0.00%
2002 262 2.93% 0.00%
2003 269 2.92% 0.00%
2004 276 2.90% 0.06%
2005 283 2.89% 0.00%
_________________________________________________________________________________________________________
Source: Icon Group Ltd., copyright 2000, www.icongroupedition.com
2.9 CAPE VERDE
Nursing home care (US $ mln): Cape Verde 1995 - 2005
Year Cape Verde % of Region % of Globe
_________________________________________________________________________________________________________
1995 6 0.00% 0.00%
1996 6 0.00% 0.00%
1997 6 0.00% 0.00%
1998 6 0.00% 0.00%
1999 6 0.00% 0.00%
2000 6 0.00% 0.00%
2001 6 0.00% 0.00%
2002 6 0.00% 0.00%
2003 6 0.06% 0.00%
2004 7 0.00% 0.00%
2005 7 0.00% 0.00%
_________________________________________________________________________________________________________
Source: Icon Group Ltd., copyright 2000, www.icongroupedition.com
Nursing Home Care 18
www.icongroupedition.com
Ó2002 Icon Group Ltd.
2.10 CENTRAL AFRICAN REPUBLIC
Nursing home care (US $ mln): Central African Republic 1995 - 2005
Year Central African Republic % of Region % of Globe
_________________________________________________________________________________________________________
1995 23 0.28% 0.00%
1996 23 0.28% 0.00%
1997 23 0.28% 0.00%
1998 23 0.28% 0.00%
1999 23 0.27% 0.00%
2000 23 0.27% 0.00%
2001 24 0.27% 0.00%
2002 25 0.28% 0.00%
2003 26 0.28% 0.00%
2004 27 0.28% 0.00%
2005 28 0.28% 0.00%
_________________________________________________________________________________________________________
Source: Icon Group Ltd., copyright 2000, www.icongroupedition.com
2.11 CHAD
Nursing home care (US $ mln): Chad 1995 - 2005
Year Chad % of Region % of Globe
_________________________________________________________________________________________________________
1995 23 0.29% 0.00%
1996 23 0.28% 0.00%
1997 24 0.28% 0.00%
1998 24 0.28% 0.00%
1999 24 0.28% 0.00%
2000 24 0.28% 0.00%
2001 24 0.28% 0.00%
2002 25 0.28% 0.00%
2003 26 0.28% 0.00%
2004 27 0.28% 0.00%
2005 28 0.28% 0.00%
_________________________________________________________________________________________________________
Source: Icon Group Ltd., copyright 2000, www.icongroupedition.com
Nursing Home Care 19
www.icongroupedition.com
Ó2002 Icon Group Ltd.
2.12 COMOROS
Nursing home care (US $ mln): Comoros 1995 - 2005
Year Comoros % of Region % of Globe
_________________________________________________________________________________________________________
1995 5 0.00% 0.00%
1996 5 0.00% 0.00%
1997 6 0.00% 0.00%
1998 6 0.00% 0.00%
1999 6 0.06% 0.00%
2000 6 0.00% 0.00%
2001 6 0.00% 0.00%
2002 6 0.00% 0.00%
2003 6 0.00% 0.00%
2004 6 0.00% 0.00%
2005 7 0.00% 0.00%
_________________________________________________________________________________________________________
Source: Icon Group Ltd., copyright 2000, www.icongroupedition.com
2.13 CONGO (FORMERLY ZAIRE)
Nursing home care (US $ mln): Congo (formerly Zaire) 1995 - 2005
Year Congo (formerly Zaire) % of Region % of Globe
_________________________________________________________________________________________________________
1995 143 1.77% 0.00%
1996 149 1.82% 0.04%
1997 154 1.87% 0.00%
1998 160 1.92% 0.00%
1999 165 1.97% 0.00%
2000 170 2.01% 0.00%
2001 171 1.98% 0.00%
2002 172 1.93% 0.00%
2003 173 1.88% 0.00%
2004 174 1.83% 0.00%
2005 175 1.78% 0.00%
_________________________________________________________________________________________________________
Source: Icon Group Ltd., copyright 2000, www.icongroupedition.com
Nursing Home Care 20
www.icongroupedition.com
Ó2002 Icon Group Ltd.
2.14 DJIBOUTI
Nursing home care (US $ mln): Djibouti 1995 - 2005
Year Djibouti % of Region % of Globe
_________________________________________________________________________________________________________
1995 8 0.10% 0.00%
1996 8 0.10% 0.00%
1997 9 0.10% 0.00%
1998 9 0.10% 0.00%
1999 9 0.11% 0.00%
2000 9 0.11% 0.00%
2001 10 0.11% 0.00%
2002 10 0.10% 0.00%
2003 10 0.10% 0.00%
2004 10 0.10% 0.00%
2005 10 0.10% 0.00%
_________________________________________________________________________________________________________
Source: Icon Group Ltd., copyright 2000, www.icongroupedition.com
2.15 EGYPT
Nursing home care (US $ mln): Egypt 1995 - 2005
Year Egypt % of Region % of Globe
_________________________________________________________________________________________________________
1995 718 8.91% 0.20%
1996 721 8.85% 0.20%
1997 722 8.80% 0.20%
1998 724 8.74% 0.19%
1999 723 8.68% 0.19%
2000 727 8.64% 0.19%
2001 751 8.68% 0.19%
2002 779 8.74% 0.19%
2003 809 8.79% 0.19%
2004 839 8.84% 0.19%
2005 871 8.90% 0.19%
_________________________________________________________________________________________________________
Source: Icon Group Ltd., copyright 2000, www.icongroupedition.com
Nursing Home Care 21
www.icongroupedition.com
Ó2002 Icon Group Ltd.
2.16 EQUATORIAL GUINEA
Nursing home care (US $ mln): Equatorial Guinea 1995 - 2005
Year Equatorial Guinea % of Region % of Globe
_________________________________________________________________________________________________________
1995 3 0.00% 0.00%
1996 3 0.00% 0.00%
1997 3 0.00% 0.00%
1998 3 0.00% 0.00%
1999 3 0.00% 0.00%
2000 3 0.00% 0.00%
2001 3 0.00% 0.00%
2002 3 0.00% 0.00%
2003 3 0.00% 0.00%
2004 3 0.00% 0.00%
2005 3 0.00% 0.00%
_________________________________________________________________________________________________________
Source: Icon Group Ltd., copyright 2000, www.icongroupedition.com
2.17 ERITREA
Nursing home care (US $ mln): Eritrea 1995 - 2005
Year Eritrea % of Region % of Globe
_________________________________________________________________________________________________________
1995 8 0.00% 0.00%
1996 7 0.00% 0.00%
1997 7 0.00% 0.00%
1998 7 0.08% 0.00%
1999 7 0.08% 0.00%
2000 7 0.00% 0.00%
2001 7 0.00% 0.00%
2002 8 0.00% 0.00%
2003 8 0.00% 0.00%
2004 9 0.00% 0.00%
2005 9 0.00% 0.00%
_________________________________________________________________________________________________________
Source: Icon Group Ltd., copyright 2000, www.icongroupedition.com
Nursing Home Care 22
www.icongroupedition.com
Ó2002 Icon Group Ltd.
2.18 ETHIOPIA
Nursing home care (US $ mln): Ethiopia 1995 - 2005
Year Ethiopia % of Region % of Globe
_________________________________________________________________________________________________________
1995 112 1.38% 0.00%
1996 113 1.38% 0.03%
1997 114 1.38% 0.00%
1998 115 1.38% 0.00%
1999 115 1.38% 0.00%
2000 117 1.38% 0.00%
2001 120 1.38% 0.00%
2002 124 1.38% 0.00%
2003 128 1.38% 0.00%
2004 132 1.38% 0.00%
2005 136 1.38% 0.00%
_________________________________________________________________________________________________________
Source: Icon Group Ltd., copyright 2000, www.icongroupedition.com
2.19 GABON
Nursing home care (US $ mln): Gabon 1995 - 2005
Year Gabon % of Region % of Globe
_________________________________________________________________________________________________________
1995 91 1.12% 0.00%
1996 92 1.13% 0.00%
1997 93 1.13% 0.00%
1998 94 1.13% 0.00%
1999 95 1.14% 0.00%
2000 96 1.14% 0.00%
2001 99 1.14% 0.00%
2002 102 1.13% 0.00%
2003 104 1.13% 0.00%
2004 107 1.13% 0.00%
2005 110 1.12% 0.02%
_________________________________________________________________________________________________________
Source: Icon Group Ltd., copyright 2000, www.icongroupedition.com
Nursing Home Care 23
www.icongroupedition.com
Ó2002 Icon Group Ltd.
2.20 GHANA
Nursing home care (US $ mln): Ghana 1995 - 2005
Year Ghana % of Region % of Globe
_________________________________________________________________________________________________________
1995 122 1.51% 0.00%
1996 122 1.50% 0.03%
1997 122 1.48% 0.00%
1998 122 1.46% 0.03%
1999 121 1.45% 0.00%
2000 121 1.43% 0.00%
2001 126 1.45% 0.00%
2002 131 1.46% 0.00%
2003 136 1.48% 0.00%
2004 142 1.50% 0.00%
2005 148 1.51% 0.00%
_________________________________________________________________________________________________________
Source: Icon Group Ltd., copyright 2000, www.icongroupedition.com
2.21 GUINEA
Nursing home care (US $ mln): Guinea 1995 - 2005
Year Guinea % of Region % of Globe
_________________________________________________________________________________________________________
1995 52 0.64% 0.00%
1996 52 0.63% 0.00%
1997 52 0.63% 0.00%
1998 52 0.63% 0.00%
1999 52 0.62% 0.00%
2000 52 0.62% 0.00%
2001 54 0.62% 0.00%
2002 56 0.63% 0.00%
2003 58 0.63% 0.00%
2004 61 0.63% 0.00%
2005 63 0.64% 0.00%
_________________________________________________________________________________________________________
Source: Icon Group Ltd., copyright 2000, www.icongroupedition.com
Nursing Home Care 24
www.icongroupedition.com
Ó2002 Icon Group Ltd.
2.22 GUINEA-BISSAU
Nursing home care (US $ mln): Guinea-Bissau 1995 - 2005
Year Guinea-Bissau % of Region % of Globe
_________________________________________________________________________________________________________
1995 3 0.00% 0.00%
1996 3 0.00% 0.00%
1997 3 0.00% 0.00%
1998 4 0.00% 0.00%
1999 4 0.04% 0.00%
2000 4 0.00% 0.00%
2001 4 0.00% 0.00%
2002 4 0.00% 0.00%
2003 4 0.00% 0.00%
2004 4 0.00% 0.00%
2005 4 0.00% 0.00%
_________________________________________________________________________________________________________
Source: Icon Group Ltd., copyright 2000, www.icongroupedition.com
2.23 IVORY COAST
Nursing home care (US $ mln): Ivory coast 1995 - 2005
Year Ivory coast % of Region % of Globe
_________________________________________________________________________________________________________
1995 190 2.36% 0.00%
1996 190 2.33% 0.00%
1997 189 2.30% 0.00%
1998 189 2.28% 0.05%
1999 188 2.25% 0.00%
2000 188 2.23% 0.00%
2001 195 2.25% 0.00%
2002 203 2.28% 0.00%
2003 212 2.30% 0.00%
2004 221 2.33% 0.00%
2005 231 2.35% 0.05%
_________________________________________________________________________________________________________
Source: Icon Group Ltd., copyright 2000, www.icongroupedition.com
Nursing Home Care 25
www.icongroupedition.com
Ó2002 Icon Group Ltd.
2.24 KENYA
Nursing home care (US $ mln): Kenya 1995 - 2005
Year Kenya % of Region % of Globe
_________________________________________________________________________________________________________
1995 175 2.17% 0.00%
1996 175 2.15% 0.00%
1997 174 2.12% 0.04%
1998 174 2.10% 0.00%
1999 173 2.07% 0.00%
2000 173 2.05% 0.04%
2001 180 2.07% 0.00%
2002 187 2.10% 0.00%
2003 195 2.12% 0.00%
2004 204 2.14% 0.00%
2005 212 2.17% 0.00%
_________________________________________________________________________________________________________
Source: Icon Group Ltd., copyright 2000, www.icongroupedition.com
2.25 LESOTHO
Nursing home care (US $ mln): Lesotho 1995 - 2005
Year Lesotho % of Region % of Globe
_________________________________________________________________________________________________________
1995 20 0.25% 0.00%
1996 20 0.24% 0.00%
1997 19 0.23% 0.00%
1998 19 0.22% 0.00%
1999 18 0.21% 0.00%
2000 18 0.21% 0.00%
2001 19 0.21% 0.00%
2002 20 0.22% 0.00%
2003 21 0.23% 0.00%
2004 23 0.24% 0.00%
2005 25 0.25% 0.00%
_________________________________________________________________________________________________________
Source: Icon Group Ltd., copyright 2000, www.icongroupedition.com