MEED S.A. The Costs of Water Pollution in India potx
Bạn đang xem bản rút gọn của tài liệu. Xem và tải ngay bản đầy đủ của tài liệu tại đây (698.24 KB, 55 trang )
MEED S.A.
Matières Premières, Eau, Environnement,
Développement
51, rue Spontini
75 116 Paris – France
Tel. : 33 (1) 47 04 42 37
Fax : 33 (1) 47 55 67 23
Cerna, Centre d’économie industrielle
Ecole Nationale Supérieure des Mines de Paris
60, boulevard Saint Michel
75272 Paris Cedex 06 – France
Tél. : 33 (1) 40 51 90 91 – Fax : 33 (1) 44 07 10 46
The Costs of Water Pollution in India.
A. Maria
CERNA, Ecole Nationale Supérieure des Mines de Paris,
Paris, France.
Revised Version
Paper Presented at the conference on Market Development of Water & Waste Technologies
through Environmental Economics, 30
th
-31
st
October 2003, Delhi.
The costs of water pollution in India.
Augustin MARIA
CERNA
60 Bd St Michel, 75006 PARIS
Paper prepared for circulation amongst the members of the DEMATEDEE
Network
The costs of water pollution in India
The costs of water pollution in India
1. Introduction 1
2. Water pollution regulation in India 2
2.1. Water pollution – related legislation 2
2.2. The pollution control boards 2
2.3. Environmental standards 4
2.4. The water cess 4
2.5. The Common Effluent Treatment Plants Schemes 6
2.6. The River action plans 6
2.7. The National Drinking Water Mission 8
3. Pollution Status 10
3.1. Surface water pollution 10
3.2. Groundwater Quality problems in India. 11
4. Sources of Human Pollution 16
4.1. Pollution by domestic wastewater 16
4.2. Pollution by Industrial effluents 16
4.3. Pollution by agricultural run-offs 21
5. Adverse economic impacts of water pollution – Existing studies on India 24
5.1. The cost of inaction (Brandon & Homman 1995) 24
5.2. Measuring Benefits from Industrial Water Pollution Abatement: Use of Contingent
Valuation Method in Nandesari Industrial Area 29
5.3. Cleaning-up the ganges: a cost-benefit analysis of the Ganga Action Plan 29
5.4. Environmental impact of industrial effluents in Noyyal River Basin 31
6. The cost of pollution control 33
6.1. The cost of Industrial Pollution abatement 33
6.2. The cost of domestic pollution control 38
Bibliography 40
Annex A 46
1. The health cost of water pollution – methodological issues 46
1. Introduction
This report tries to summarize the information available about the different costs of water
pollution in India. The variety of these costs comes not only from the variety of pollution dealt
with (domestic, industrial, agricultural …) but also from the method used to calculate these costs.
The notion of cost is quite complex. Formally, it implies the comparison between two scenarios,
and the assessment of the welfare of a group of economic agent in both scenarios. In the case of
water pollution, the problem can be represented by a resource which provides environmental
services, and economic agents that benefit from these services. Calculating a formal cost of water
pollution would imply to model the different equilibrium at stake, and to deduct from these
different equilibrium the effect of a difference in the ambient pollution on the aggregated welfare.
To determine these equilibriums, one would need hydrological as well as agronomic, medical and
behavioural models that are not available as for now in India.
In practice, many different techniques are applied in order to provide estimates of the economic
burden due to water pollution, that only provide partial estimates of a certain kind of cost, that is
the cost of a particular aspect of pollution on a certain category of agents.
This document does not provide any original figure or data. It is a preliminary literature survey
of the Indian context regarding water pollution. Although it aims at being as comprehensive and
exhaustive as possible, many important elements might be missing, but we hope that reactions
from the different partners will enable us to provide a reliable basis for common understanding
and fruitful collaboration.
Political will, or financial resources are often quoted as critical element for a sound
environmental policy, but information is surely at least as important as the other elements.
Information on the status of environmental quality, on the sources of pollution, and the way it
affects the different actors. This is the availability of such information, and the way it is being
analysed and used in India that we tried to assess.
It appears that the availability of this kind of information has been enhanced by the effort of
various institutions during the last fifteen years. The Central Pollution Control Board (CPCB), the
Central Ground Water Board (CGWB), the Central Statistical Organisation (CSO) and several
other institutions now provide nation wide data about water quality, industrial activity, etc…
We will first present the Indian regulation regarding water pollution. Current regulation can be
defined as a command and control approach, based on emission concentration standards enforced
by the different State Pollution Control Boards. We will then present the data available on
pollution status for both surface and ground water. The main kind of pollution will be presented,
i.e. pollution by domestic wastewater, pollution by industrial effluents, and pollution by
agricultural run-offs. We will then give an overview of the studies that have attempted to cost
water pollution. Several methods are represented in this survey, applied at different geographical
levels. Finally, we present figures available on the major costs of pollution abatement.
1
2. Water pollution regulation in India
This sections gives an overview of the current state of the Indian environmental regulation
system. We mention the main relevant texts regarding the regulation of water pollution. We then
describe the main elements of the institutional set up, that is the pollution control boards, and the
existing tools at their disposition. Finally we discuss the role of informal regulation by local
communities.
2.1. Water pollution – related legislation
Unless there have been some environment related acts in India as early as the nineteenth century,
the first significant laws regarding the protection of environmental resources appeared in the
1970's with the setting up of a National Comimittee on Environmental Planning and
Coordination, and the enactment of the Wildlife Protection Act, 1972.
Since then, three main texts have been passed at the central level, that are relevant to water
pollution : the Water (Prevention and Control of Pollution) Act, 1974, the Water (Prevention
and Control of Pollution) Cess Act, 1977 and the Environment (Protection) Act (1986).
The Water Act 1974 established the Pollution Control Boards at the central and state level.
The Water Cess Act 1977 provided the Pollution Control Boards with a funding tool, enabling
them to charge the water user with a cess designed as a financial support for the board's activities.
The Environment Protection Act 1986 is an umbrella legislation providing a single focus in the
country for the protection of environment and seeks to plug the loopholes of earlier legislation
relating to environment.
The law prohibits the pollution of water bodies and requires any potentially polluting activity to
get the consent of the local SPCB before being started.
2.2. Institutional set-up The pollution control boards
Composition : Each board is composed of a chairman and five members, with agriculture
fisheries, and government-owned industries having representation.
2.2.1. The Central Pollution Control Board (CPCB)
The CPCB has overshight powers over the various state boards. It sets emission standards, and
lays down ambient standards. The CPCB also conducts nation wide surveys about the status of
pollution, and of pollution mitigation.
Two programs of inland water quality monitoring have been set up so far, leading to the
spreading of 480 measurement stations over the main river basins of the country. These two
programs are the Global Environment Monitoring System (GEMS) and Monitoring of Indian
Aquatic Resources (MINARS). The ganga river is subject to a dedicated program called Ganga
Action Plan (GAP) under which a water quality control network as been set up in the ganga basin.
The measurement are made in different kind of medium (river, wells, lakes, creeks, ponds, tanks,
drains and canals) and 25 physico-chemical and biological parameters are monitored.
2.2.2. The State Pollution Control Boards (SPCB)
The implementation of the national environmental laws, and the enforcement of the standards set
by the CPCB is decentralised at the level of each state, with the SPCB in charge of this role. The
SPCB can demand information from any industry about the compliance with the Act. Non-
2
compliance can be punished with fines up to Rs. 10000, and imprisonment up to three months. In
case of continued non-compliance, an additional daily fine of 5000 Rs. can be imposed. Until
1988, the only enforcement tool of the SPCB was criminal prosecution. This was revised by the
1988 amendment to the Water Act of 1974. The boards now have the power to close non-
compliant companies or to cut their water and power supply. The ultimate recourse remains
public interest litigation in front on the supreme court. During the last decade, the supreme court
has been involved several times in large scale environment related measures. In April 1995 for
example, the Supreme Court of India, in a public interest litigation case, has ordered that 538
tanneries located in 3 clusters in Calcutta generating about 30 mld of effluents be shifted from the
city to a leather complex and a CETP (Common Effluent Treatment Plant)be provided to treat the
effluent generated from the complex. In 1996, it has ordered the closure of all tanneries in Tamil
Nadu that had not set up pollution control systems.
However, control and sanction is not the only way of interaction between the boards and the
polluting entities. Under the Water Cess Act of 1977 state boards may charge industries and
municipalities with a water cess calculated on the volume of water consumed, and for consent
fees. Nevertheless any fee levied by the SPCBs have to be sent to the central government. The
central government is then supposed to return 80% of the fees to the SPCBs
2.2.3. Assessment of the action of SPCBs.
In 1996, a survey of India's pollution regulatory structure was conducted by the world bank
(Shaman 1996). It shows that SPCBs have suffered from a lack of efficiency during their
formative years. One plausible cause for this inefficiency might be the low rate of return of the
funds sent by the SPCBs to the central government. By 1987-88, all the state boards had filed a
total of only 1,602 cases for prosecution under the Water Act. Of these, 288 had been decided and
1,314 cases were still pending. Recent signs indicate more vigilance by government officials
toward violators.
In 1991, the CPCB Board began implementation of an coordinated action plan for industrial
pollution control with the state boards. The Board selected 17 highly polluting manufacturing
sectors. In addition to identifying critical manufacturing sectors, the Board went on to determine
which geographical locations had been most affected by industrial pollution. It identified 13
extremely polluted waterways. Following consultations with the state boards, 22 critically
polluted areas around the country were also identified. All these sites and rivers were targeted for
short-term emergency programs.
The Board also sought to identify polluters by size. Again working with their state counterparts,
the Board also identified 1,551 large and medium sized units throughout India. 1,125 were found
to be in compliance. 319 plants were found to be not in compliance. Of those 319 plants, 258 had
begun operating before 1981. The remaining 107 plants were ultimately closed.
In 1994, Indian courts closed almost 1,000 factories for pollution problems. In addition, the
Supreme Court fined 15 plants, including some multi-nationals. (Source : Shaman, 1996)
In 1997, another team of economists from the world bank (Pargal, Mani & Huq, 1997) looked for
evidences of influence of inspections from the SPCBs on emission by polluting firms. The results,
however, showed only a higher level of inspection in highly polluted areas, but no causal links
between the level of inspection and a decrease in emissions. The study did not find neither
evidence of informal pressure from local population on polluting industries.
3
2.3. Regulatory tools
2.3.1. Environmental standards
2.3.1.1. Ambient standards for river quality
Table 1 Primary Water Quality Standards
Designated best use
Criterion Class A Class B Class C Class D Class E
Dissolved Oxygen (mg/l)
Maximum
6 5 4 4 -
BOD (mg/l)
Maximum
2 3 3 - -
Total coliform count (MPN/100
ml)
Maximum
50 500 5000 - -
pH
acceptable range
6.5-8.5 6.5-8.5 09-juin 6.5-8.5 6.5-8.5
Free ammonia (mg/l) - - - 1.2
Condustivity - - - - 2.25
Sodium absorbtion ratio - - - - 26
Boron (mg/l) - - - - 2
Class A: Drinking water source without conventional treatment. Class B: Water for outdoor
bathing.
Class C:Drinking water with conventional treatment. Class D: Water for wildlife and fisheries
Classe E: Water for recreation and aesthetics, irrigation and industrial cooling.
Source : CPCB
2.3.1.2. Discharge standards: MINAS
The CPCB has issued a set of norms that have to be enforced by the SPCBs. Those standards are
expressed in terms of effluent concentration and are called Minimum Acceptable Standards
(MINAS). SPCB have the choice to adopt more stringent standards.
The MINAS are defined for each type of industry and for each type of medium of release.
Classical criteria are BOD, COD, and TSS.
The MINAS standards concerning those criteria are respectively of 30 mg/L, 250 mg/L, and 100
mg/L.
2.3.2. The water cess
Table 2 Industries Subject to Water Cess
1. Ferrous metallurgical industry
2. Non-ferrous metallurgical industry
3. Mining industry
4. Ore processing industry
5. Petroleum industry
6. Petrochemical industry
7. Chemical indsutry
4
8. Ceramic indsutry
9. Cement industry
10. Textile industry
11. Paper industry
12. Fertiliser industry
13. Coal (including coke) industry
14. Power (thermal and disesel) generating industry
15. Processing of animal or vegetable products industry
Source : The water (Prevention and Control of Pollution) Cess Act, 1977
Table 3 Rate of Water Cess
Purpose for which water is
consumed
Maximum rate
(Paisa per kilolitre)
Maximum rate
(Paisa per kilolitre)
in case of non-compliance of
the water user with the
environmental standards
Industrial cooling, spraying in
mine pits or boiler feeds
1.50 2.25
Domestic purpose
2.00 3.00
Processing whereby water gets
polluted and the pollutants are
easily biodegradable and are
toxic.
4.00 7.50
Processing whereby water gets
polluted and the pollutants are not
easily biodegradable and are
toxic.
5.00 7.00.
Source : The water (Prevention and Control of Pollution) Cess Act, 1977
2.3.3. Other economic incentives
• Depreciation allowance: A depreciation of 100% per cent is provided on specific
equipment installed by manufacturing units to control pollution.
• Water cess: If an industry has installed equipment for treatment of sewage or effluent, it
can avail of a rebate of 70 per cent on the water cess, which is levied on water use.
• Concessional custom duty: Equipment and spares for pollution control attract reduced
rates of customs duty
• Excise duty: Excise duty at reduced rate of 5% on manufactured goods that are used for
pollution control
• Soft loans: Financial institutions can extend soft loan facilities for installation of pollution
control equipment
• Subsidies: Small scale industries can receive financial assistance and subsidies to set up
common effluent treatment facilities
5
2.4. Special schemes
2.4.1. The Common Effluent Treatment Plants Schemes
Pollution from small size industries (SSIs) puts the Indian regulators in front of a difficult
arbitrage between economic development and environmental sustainability. Indeed, 40% of the
wastewater generated by Indian most polluting industries comes from small size industries. With
the adoption of the water act, those small size industries had in theory the obligation to treat their
effluent in order to reach a pollution concentration respecting the minimum acceptable standards
laid down by the SPCBs. Nevertheless, the size of these facilities makes the installation of a
standard effluent treatment plant (ETP) unaffordable because of the important fixed cost of an
individual ETP. Therefore, public authorities have taken the initiative to promote common
effluent treatment plants (CETPs) schemes, allowing small industries to gather in order to treat
jointly their effluents. The CETP concept was originally promoted by the Ministry of
Environment and Forests in 1984. The first CETP in India was constructed in 1985 in Jeedimetlha
near Hyderabad, Andhra Pradesh, to treat waste waters from pharmaceuticals and chemicals
industries. In 1999, 82 CETPs had been set up around the country.
Although CETPs are mainly seen as a mean to take advantage of scale economies, these schemes
also act as subsidies from public powers to small industries in order to allow them to respect the
standards.
The minimum participation asked from SSIs in the CETP schemes implemented in India is 20%.
The rest is funded through subsidies from central and state governments as well as loans from
international organisations such as the world bank or Indian institutions such as IDBI or ILFS.
The subsidy effect in favour of SSIs may be increased in some cases when an industrial area
gathers SSIs as well as larger polluting industries. In these case, some cross subsidies may be set
up by asking the larger industries to contribute to the development of the CETP while treating
their effluent before releasing them in the common drain.
There are in fact diverging opinions on the relevance of CETPs in a national pollution abatement
policy. It has been clearly shown that compared to individual ETPs, CETPS are more cost
effective in reaching the effluent concentration standards. (Pandey & Deb, 1998; Sankar 1998).
However, treating the effluents is not the only way to meet the standards, and process changes
induced by regulatory pressure have proved to give good results in several results, and can even
enhance the company's competitiveness. In a seminal article published in 1991, Michael Porter
formulated what is usually referred to as the "Porter Hypothesis" : "Strict environmental
regulations do not inevitably hinder competitive advantage against foreign rivals; indeed, they
often enhance it" (Porter, 1991). A test of the Porter hypothesis on the Indian manufacturing
industry was recently carried out by Murty and Kumar (Murty & Kumar 2001) Taking this
element into account, one can wonder if the CETPs are really a viable long term solution , or if
they simply delay a necessary effort of process adaptation from the concerned industries.
2.4.2. The River action plans
The National River Conservation Directorate (NRCD), under the Ministry of Environment and
Forest, Government of India, is in charge of coordinating several river conservation plans. Those
plans basically consist in the setting up of sewage diversion and treatment facilities, along with
action directed toward mitigation of industrial pollution through the seting up of Individual or
Common Effluent Treatment Plants (ETPs)
6
The first large scale action plan oriented towards conservation and rehabilitation of water
resources was the Ganga Action Plan (GAP), launched in 1985. The Ganga River Basin is one of
the most populous in the world with 5 Indian states relying on the Ganga for their water needs
(Haryana, Delhi, Uthar Pradesh and West Bengal). The river system has been divided in several
streches for which objectives of water quality were fixed using the primary water quality
standards defined in table 1. The main elements of the strategy adopted for the first phase of the
Ganga Action Plan were a combination of diversion and treatment of sewage from the major
cities in the river basin, as well as provision of low cost sanitation for rural areas, and other
interventions such as river banks development and setting up of electric crematorium. In practice,
only the first part of the plan consisting in diversion of sewages has been fully implemented. Out
of the 1340 MLD capacity that was initially targeted for sewage treatment, only 873 was actually
set up.
The GAP has however led to an observable enhancement of river quality in the Ganga.
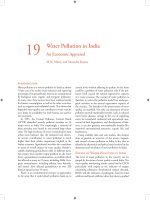
Along with the actions directed toward domestic pollution, 68 highly polluting were identified
along the Ganga River Basin and were asked to conform with the standards by setting up ETPs.
Chart 1. Yearwise Progress of ETP Installation in the 68 Industries concerned by the
GAP
14
25
41
44
46
55
0
11
10
7
2
0
54
27
8
3
00 0
5
9
14
20
13
0
20
40
60
1985 1988 1990 1992 1994 1995*
Year
No. of Industries
Units with ETP Installed Units with ETP Under Construction
Units with No ETP Units closed
Source : CPCP
A comprehensive Cost-Benefit Analysis of the Ganga Action Plan was published in 2000
(Markandya & Murty 2000)
The First phase of the Ganga Action Plan has led to other sub-action plans : the Yamuna, Gomati,
and Damodar Action Plans, as well as the second phase of the GAP.
The National River Conservation Plan (NRCP) was launched in 1995 to cover 18 major rivers in
10 states of the country. Under this action plan pollution abatement works are being taken up in
46 towns in the states of A.P., Bihar, Gujarat, Karnataka, Maharashtra, M.P., Orissa, Punjab,
Rajasthan and Tamil Nadu. About 1928 mld of sewage is targetted to be intercepted, diverted and
treated.
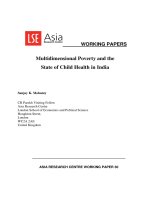
The total NRCP sanctioned cost is of Rs. 737.13 Crore.
The following chart give a repartition of this cost by state.
Chart 2. State-Wise sanctioned cost of National River Conservation Plan
7
Source : NRCP
The following table summarizes the the scheduled scope and cost of the different plans
implemented.
Table 4 Programs implemented by the National River Conservation Directorate
Name Number of towns
covered
Volume of
Sewage Diverted /
Treated (MLD)
Cost
(Rs.
Crores)
Ganga Action Plan
Phase I 25 873 462.04
National River
Conservation Plan
46 1928 737.13
Yamuna Action Plan 20 744 823.57
Gomati Action Plan 3 269 61.11
Damodar Action Plan 12 68 23.58
Ganga Action Plan
Phase II (main stem) 29 618 378
Ganga Action Plan
Phase II (Supreme Court
Towns)
30 162 209.90
Source : NRCD
2.4.3. The National Drinking Water Mission
The Accelerated Rural Water Supply Programme (ARWSP) was introduced in 1972-73 by the
Government of India to assist the States and Union Territories (UTs) to accelerate the pace of
coverage of drinking water supply. The entire programme was given a Mission approach with the
launch of the Technology Mission of Drinking Water and Related Water Management, also called
the National Drinking Water Mission (NDWM), in 1986. It was one of the five Societal Missions
launched by the Government of India. The NDWM was renamed as the Rajiv Gandhi National
Drinking Water Mission (RGNDWM) in 1991.
8
In addition of the ARWSP, the government launched a similar initiative on sanitation. The
centrally Sponsored Rural Sanitation Programme (CRSP) was laun ched in 1986 .
2.5. Community action and informal regulation
In addition to the action of the different administrative agencies, some kind of pollution
regulation can be enforced by direct action of affected communities. According to Goldar and
Banerjee (2002) the two channels of informal regulation are (1) to report violation of legal
standards to the regulatory institutions (where such standards and institutions exist), and (2) to put
pressure on regulators (politicians and administrators) to tighten their monitoring and
enforcement.
Pargal, Mani and Huq (1997), and Murty and Prashad (1999) have carried out field survey of
effluent discharge from small and medium industries in order to study how the characteristics of
local communities impact on the environmental behaviour of local industries. Goldar and
Banerjee (2002) have performed a similar study taking environmental water quality instead of
industries's effluent discharge as a measure of the output of informal regulation.
9
3. Pollution Status
3.1. Surface water pollution
As mentioned in section 2, the CPCB has set up several network or river quality monitoring
stations. In 1999, there wer 507 such stations, of which 430 were set up under the Monitoring of
Indian National Aquatic Resources (MINARS) program, 50 stations under Global Environmental
Monitoring Systems (GEMS), and 27 stations under the Yamuna Action Plan (YAP).
The water quality was compared with desirable water quality expressed in terms of the quality
class defined in table 1 following the best use of water.
Table 4 shows some of the most polluted river stretches. The level of unwanted pollution is given
by the difference between the desired class and the existing class. Table 4 also proposes some
explanation for the pollution observed. It can be seen that the major sources of pollution
identified are domestic pollution from large cities, an industrial pollution from industries such as
sugar industry, distilleries, tanneries, or fertilisers.
Table 5 List of polluted river stretches
Source : CPCB 1999 (reported in MoEF 2001)
10
Table 5 gives pollution level for the different Indian states. The criteria presented are Biological
Oygen Demand, Total Coliform, and Faecal Coliform. While BOD excess can be the result of
both domestic or industrial pollution, Coliform count is directly related to domestic wastewater.
Table 6 Water Quality Status in India
Source : CPCP 1999 (reported in MoEF 2001)
3.2. Groundwater Quality problems in India.
In this section, we will deal only with quality-related problems of ground water in India, putting
aside the problems of lowering of the water table due to over-exploitation. Nevertheless, we will
study a broader problem than the one of pollution per say, dealing with water quality problem that
can be considered as not being pollution-related, since most of them are mainly geogenic.
Indeed the main quality problem encountered with ground water in India are due to excess
fluoride, arsenic, iron, nitrate and salinity. Nitrate contamination is mainly anthropogenic, due to
the use of fertilizers and discharge of fecal material. Salinity may have different origin, but the
most common is the infiltration of brackish water in a fresh aquifer due to the over exploitation of
this aquifer.
11
3.2.1. Ground water use
It is estimated that 80% of domestic needs in rural areas and 50% in urban areas is met by ground
water.
1
India's total replenishable groundwater have been estimated at 431.8 km
3
by the Central
Statistical Organisation. The average level of groundwater development in India is 32%, although
some states have exploited their resources to a much greater extent (94% in Punjab, 84% in
Haryana, 60% in Tamil Nadu, 64% in Lakshadweep, 51% in Rajasthan)
2
.
85% of ground water extracted is used for irrigation purposes and 15% for Industrial and
domestic. purposes.
3
Reciprocally, as much as 70 to 80% of India's agricultural output may be
groundwater dependent.
3.2.2. Quality problems
3.2.2.1. Quality problems in rural areas.
A survey carried out by the Rajiv Gandhi National Drinking Water Mission, GoI, based on 1%
random sampling indicated that 217211 habitations had water quality problems.
Table 7 Number of Habitations affected with Water Quality Problems
Nature of Quality
Problem
Number of affected
habitations
Excess Fluoride 36988
Excess Arsenic 3553
Excess Salinity 32597
Excess Iron 138670
Excess Nitrate 4003
Other reasons 1400
Total 217211
1
India tenth plan. 8.1.54
2
Central Statistical Organisation (1997) "Compendium of Environmant Statistics". New Delhi:
Department of Statistics, Ministry of Planning and Programme implementation, Government of
India.
3
Ramesh Chandra Panda, Mission Director, Rajiv Gandhi National "Drinking Water Mission.
Drinking Water Quality and Related Health Impact in Rural India" Presented in the 3
rd
World
Water Forum, Kyoto, 2003.
12
3.2.3. Fluoride:
High fluoride concentration in ground water beyond the permissible limit of 1.5 p.p.m is one of
the most worrying toxicological problems India. This contamination has geological origins, and
dangerous level of Fluoride presence in ground water have been recorded in 17 different states,
covering almost the hole territory. In affected areas, the range of fluoride contamination varies
between 1.5 and 29 p.p.m. Prolonged ingestion of high quantities of fluoride can lead to dental or
skeletal fluorosis.
According to a survey carried out by the Rajiv Gandhi National Drinking Water Mission
(RGNDWM) in 1993, around 25 million people were affected at this time. The population at risk
is estimated at 66 million
3.2.3.1. Origin
The fluoride is present in many different geological formations, but the gneiss of the Indian
underground have been identified as being responsible for the problematic fluoride concentration
in ground water.
3.2.3.2. Fluoride mitigation
Department of Drinking Water Supply of the Ministry of Rural Areas and Employment,
Government of India, has constituted a Central Task Force to facilitate in setting up of a Centre of
Excellence for Fluorosis Mitigation.
A sub mission of the RGNDWM has been created for the control of fluorosis. Control measures
include the installation of fluor removal plants using processes based on Nalgonda technique or
activated alumina process. Those plants can be either fill and draw or handpump-attached). 499
such plants had been approved in 1998, of which 1998 had been installed upto December 1998.
The main methods identified for Fluoride removal are
Co-precipitaion
Adsorption by activated carbon and activated alumina
Exchange method
Reverse Osmosis
3.2.4. Arsenic:
Arsenic contamination of groundwater has an unusually high and dramatic occurrence in the
gangetic delta including West Bengal and Bangladesh. The first indication of arsenic-related
health problems was reported in West Bengal in 1983. It took ten more years for the situation to
be recognised in Bangladesh. Since then, several programs of investigation have been carried out
and the arsenic crisis in the ganga delta is now the focus of many efforts worldwide to release the
population living in this area from this serious threat. Arsenic contamination through drinking
water may be responsible for cancer of skin, lungs, urinary bladder, and kidney, as well as other
skin affectations. The population at risk is estimated at 5.3 million, with 200000 people actually
affected.
3.2.4.1. Origin
Arsenic is widespread in the earth's crust. The concentration of arsenic, however, is particularly
high in the thick succession of fluviatile sediments pertaining to the quaternary age that form the
majority of the exploited aquifers in the region.
Although everyone agrees about the geologic origin of the arsenic that can be found in ground
water in West Bengal and Bangladesh, there is no consensus about the reason why the arsenic
gets diluted at such a high rate.
13
Some scientist assume that the high arsenic concentration in groundwater can be explained by the
exposition of arseno-ferous complex to atmospheric oxygen introduced in the aquifer in response
to lowering of groundwater level.
An alternative explanation puts forward the strongly reducing condition of the aquifer, that can be
explained by the burial of organic sediment during its geological formation.
This two - mostly geogenic - explanations are challenged by another one based on the action of
phosphates from chemical fertilizers that could displace arsenic from the sediment.
3.2.4.2. Contamination
Arsenic in drinking water.
WHO standards concerning Arsenic concentration in drinking water established in 1993 an
allowable concentration of 0.01mg/L, bringing down the 1963 limit of 0.05mg/L. However, the
permissible limit in India and Bangladesh, is still 0.05 mg/L, and most of the test done in those
areas use this reference.
Nine of sixteen districts of West Bengal have been reported to have ground water arsenic
concentrations above 0.05mg/L
4
. According to the Public Health Engineering Department
(PHED) in Calcutta, the population of those nine districts is estimated at 39 million. There are
around 22000 public tubewells and more than 400000 private tubewells in the area. In the tenth
five-year plan document prepared by the Indian Planning Commission, it was reported that
arsenic contaminated habitations had been identified in eight districts, with 200,000 people
actually affected, and an exposed population around 5.3 million. The reported number of
tubewells in the affected area was 22000 public tubewells, and 130000 private tubewells. These
figures, compared to the one provided by the PHED, show the lack of information about the
private tubewells, which is a major obstacle in the efforts to assess the real extent of the crisis.
Arsenic in biomass.
The problem of arsenic in drinking water is maybe the more urgent to be solved, but finding
solutions for providing safe drinking water will not prevent totally As ingestion as long as As
enters the surface environment through extracted ground water. Animals drinking contaminated
water may accumulate As in their tissues, as well as crops grown in a field irrigated with As
contaminated groundwater. Irrigation poses an even more serious threat to the environment,
through a potential long term contamination of soils, and maybe a subsequent contamination of
surface water flows.
Until recently, no study was conducted to explore those alternative pathways. The Indian Council
of Agricultural Research as started a study in 1998 about the impact of As contamination in terms
of agricultural management.
5
Although the surface water was not found to be heavily contaminated, the study showed that As
tends to accumulate in most of the crop cultivated on the soils irrigated with contaminated water.
Moreover, the As present in the crops is mostly in its most toxical form of arsenate.
4
Chowdhury U.K., Biswas B.K., Chowdhury T. Roy, Samanta G., Mandal B.K., Basu G.K.,
Chanda C.R., Lodh D., Saha K.C., Mukherjee S.C., Roy S., Kabir S, Ouamruzzaman Q.,
Chakraborti D. (2000) "Groundwater Arsenic Contamination in Bangladesh and West Bengal,
India" Environmental Health Perspectives Volume 108, Number 5, May 2000
5
ICAR (2001) "Final Report: Status, causes and impacts of arsenic contamination in groundwater
in parts of West Bengal vis-avis management of agricultural systems." Ad-hoc Scheme executed
by BCKV; NBSS & LUP, NDRI, GSO, CSSRI, SWID. Principal Investigator – Sanyal, S.K.
14
3.2.4.3. Arsenic mitigation in West Bengal
Mitigation strategies
Arsenic contamination can be avoided either by providing an arsenic-free water supply, either by
providing an arsenic removal technology.
•
•
Providing an arsenic-free water supply, can be achieved by :
- Using surface water.
- Rainwater harvesting
- Tapping into deeper aquifers (100-150 meters), or shallow aquifers (hand-dug wells less
deep than 20 meters) which have been found to be arsenic free.
Providing an arsenic removal technology which can be used, either at the level of the
household, either at a more central level. There is now eight main classes of arsenic
remediation technologies based on the following processes : 1. Oxidation, 2. Coagulation/Co-
precipitation, 3. Sedimentation, 4. Filtration, 5. Adsorption, 6. Ion Exchange, 7.
Membrane/Reverse Osmosis, 8. Biological.
6
The Water and Sanitation Program (WSP) has conducted a field study about the technologies
being tested in West Bengal and Bangladesh for Arsenic Mitigation. Seven promising
technologies were identified.
- Two bucket Treatment Unit : this rustic technology is based
- Three Kalshi Filter Unit
- RKM Filter Unit
- Amal Domestic Water Purifier
- Passive Sedimentation
- Co-precipitation Using Tablet Reagents
- Adsorption
3.2.5. Iron:
High concentration of Iron in drinking water is the most widespread quality problem in India.
Nevertheless, the health impact of this contamination is smaller than the one caused by arsenic of
fluoride contamination. Using Iron contaminated water, that is over the permissible limit of 1
ppm can cause constipation accompanied by other physiological disorders.
The RGNDWM sub mission dedicated to the removal of Excess Iron had approved 1615 and
9355 plants had already been commissioned in 1998.
3.2.6. Brackishness:
Brackishness may be an initial characteristic of some aquifers, but it can be caused or worsened
by infiltration due to overexploitation of the aquifer. This is often the case in coastal areas where
aquifers get contaminated with infiltrated sea water.
Excess brackishness in drinking water has laxative effects.
The permissible limit is set at 1500 ppm of total dissolved solids (TDS).
194 desalination plants have been approved by the RGDWM and 150 plants had been
commissioned up to 1998.
6
Susan E. Murcott "Arsenic Remediation Technologies Online Informational Database" MIT
15
4. Sources of Human Pollution
4.1. Pollution by domestic wastewater
In the tenth plan document from the Indian planning commission sewage alone was reported to be
responsible for 80% of the total water pollution in the country.
4.1.1. Domestic pollution in urban environment
Theoretically, the Indian cities and towns are accountable for their wastewater discharge.
Therefore, they are supposed to collect and treat all their wastewater. They are also supposed to
pay a water cess proportional to their water consumption to the local State Pollution Control
Board (SPCB). In practice however, these rules are not applied. As it is illustrated by the CPCB
statistics presented hereunder, even the class I cities, (the largest Indian cities) are treating a small
part of their effluents, while the smaller towns practically don't have any treatment facilities.
The SPCB do not feel they have enough authority to impose some pressure on the municipalities
to have them comply with the regulation.
In such a situation, the incentive for the municipal bodies to enhance the collection and treatment
of wastewater comes from the local demand for better quality.
Status of wastewater generation, collection and treatment in class I cities and class II towns
(MLD)
wastewater collected wastewater treated
Type Number of
Cities/Town
s
wastewater
generated
(MLD)
MLD % (of
generated)
MLD % (of
collected
)
% (of
total)
Class I cities 299 16662.5 11938.2 72 4037.2 33.8 24
Class II
towns
345 1649.6 1090.3 66 61.5 5.6 3.7
Total 644 18312.1 13028.5 71 4098.7 31.5 22.4
Source CPCB 2000
4.1.2. Domestic pollution in rural environment
No figures are available about the non point source pollution due to domestic wastewater
discharge in rural areas.
According to the Central Statistical Organisation (CSO), 3.15 % of the rural population had
access to sanitation services in 1993. This left around 563.6 million people living in rural areas
had no access to toilets.
Global numbers about this kind of pollution would not be very useful anyway, since the effect of
such a pollution is essentially local, and intimately linked with the local practice of water fetching
and hygiene.
4.2. Pollution by Industrial effluents
Major polluting industries
The CPCB has laid down a list of major polluting industries in 1989. Those industries are subject
to a special regime of inspection from the SPCBs and are subject to the water Cess.
16
Those industries are :
1. Cement mills (above 200t/ day)
2. Sugar
3. Thermal Power plants
4. Distilleries
5. Fertilizers
6. Oil refineries
7. Caustic Soda Production
8. Petrochemicals
9. Zinc Smelting
10. Copper Smelting
11. Aluminum Smelting
12. Sulphuric acid
13. Integrated Iron and Steel
14. Pulp and Paper
15. Tanneries
16. Pharmaceuticals
17. Dye and Dye Intermediates
18. Pesticides
Source : CPCB 1989
4.2.1.1. Pollution by large industries
In 1992, the CPCB has launched a water pollution control program in order to tackle the problem
of industrial pollution. It has identified 1551 large and medium industries, and given a time
schedule for compliance with the prescribed standards.
The progress report is presented in the following tables. According to these figures, a drastic
reduction can be observed in the number of non-compliant industries. Doubts main remain,
however, concerning the actual operation of the installed treatment units. There are indeed
evidence that many industries only run their effluent treatment plant (ETP) during the inspections.
Table 8 Status of Pollution Control in 17 Categories of Highly Polluting Industries, India,
1995 and 2000
State/ Union
territory
Number of
units
identified
No. of units not having
adequate facilities to comply
with standards
Mar-95 Dec-2000
Andhra Pradesh 173 32 1
Assam 15 5 1
Bihar 62 11 2
Goa 6 0 0
Gujarat 177 8 0
Haryana 43 7 0
Himachal Pradesh 9 0 0
Jammu and
Kashmir
84 0
17
Karnataka 85 21 0
Kerala 28 4 0
Madhya Pradesh 78 21 5
Maharashtra 335 28 5
Orissa 23 10 4
Punjab 45 11 0
Rajasthan 49 2 0
Tamil Nadu 119 8 0
Uttar Pradesh 224 40 3
West Bengal 58 27 3
Delhi 5 3 0
Pondicherry 6 4 0
Other states/UT 3 6 0
Total 1551 252 24
Source: Central Pollution Control Board, Annual Report, 1994-95 and 2000-01, reported in
Goldar and Banerjee 2002.
18
Table 9 Status of Defaulters under the Program of Industrial Pollution Control Along
the Rivers and Lakes, India, 1997 and 2000
State/Union
Territory
Number
of
defaulter
s in Aug.
97
Closed
subsequentl
y
A
cquired
requisite
treatment/
disposal
facilities
Number of
defaulters in
Dec.2000
Andhra Pradesh 60 17 37 6
Assam 7 5 0 2
Bihar 14 4 10 0
Goa 0 0 0 0
Gujarat 17 3 14 0
Haryana 21 8 12 1
Himachal Pradesh 0 0 0 0
Jammu and
Kashmir
0 0 0 0
Karnataka 20 2 17 1
Kerala 36 4 32 0
Madhya Pradesh 2 1 0 1
Maharashtra 6 3 3 0
Orissa 9 1 4 4
Punjab 18 1 16 1
Rajasthan 0 0 0 0
Tamil Nadu 366 118 248 0
Uttar Pradesh 241 59 176 6
West Bengal 30 7 23 0
Pondicherry 4 0 4 0
Total 851 233 596 22
Source: Central Pollution Control Board, reported in Goldar and Banerjee 2002.
4.2.1.2. Pollution by Small scale industries
As mentioned in section 2, the toughest choice that Indian authorities have to face in term of
industrial pollution control is posed by pollution small scale industries (SSIs). Indeed, the
smallest facilities are the one for which adaptation to the environmental standard are less
affordable. The number of SSIs is estimated to be over 0.32 million units, of which many are
highly polluting. The share of the SSIs in term of wastewater generation among several of the
major polluting industries was reported to be about 40%.
Table 10 Wastewater generation by SSIs in selected industrial sectors
Industry Wastewater
generation
(MLD)
Engineering 2125
paper and board mills 1087
textile 450
organic chemicals 60
19
tanneries 50
pharmaceuticals 40
dye and dye intermediates 32
soaps, paints, varnishes, and petrochemicals 10
edible oiol and vanaspati 7
Source : CPCB, reported in Kathuria and Gundimeda (2001)
4.2.2. Estimation of Pollution Intensity in India using the Industrial
Pollution Projection System.
In order to deal with the lack of global data about industrial pollution in developing countries, the
World Bank has developed a method to assess such levels of pollution, using data from developed
countries such as the US and converting them, thanks to pollution intensities coefficients (Hettige
et. al., 1994). This method is called Industrial Pollution Projection System (IPPS).
The IPPS has developed by the World Bank merges data from US-EPA about pollution emissions
and the Longitudinal Research Database (LRD) on industrial activity, in order to calculate a
pollution intensity for different industrial sectors. The pollution intensity is defined as the level of
pollution emission per unit of industrial activity, this last value being measured either by the
value of production, the value added, or the employment. The pollution intensities from the
World Bank have been computed for the year 1987.
Recently, an attempt has been made to estimate industrial pollution in India using the IPPS
(Pandey & Gosh, 2002).
The data used were provided by the Annual Survey of Industries (ASI) from the Indian Central
Statistical Organisation (CSO).
Thanks to these datas, Pandey & Gosh were able to give an estimation of the pollution load in the
different states and the contribution of the different polluting industries to this pollution load in
each states.
The estimated pollution load for the different states is presented in the following table.
Table 11 Water Pollution Load (tons of BOD) Using Output intensity.
States Pollution Load
Bihar 321494
Madhya Pradesh 243125
Maharashtra 234360
Orissa 204240
Andhra Pradesh 131536
West Bengal 130444
Uttar Pradesh 103205
Punjab 96050
Tamil Nadu 84384
Gujarat 78354
Karnataka 58705
Haryana 36939
Rajasthan 23530
Delhi 12387
Pondicherry 9655
Chandigarh 9294
Assam 7861
20
Kerala 6549
Himachal Pradesh 5709
Jammu & Kashmir 2378
Goa 118
Daman & Diu 115
Others 78698
All India 1879140
Source : Pandey & Ghosh, 2002.
The following table provides some estimations of Pollution Load for the different industries.
Table 12 Estimated water pollution load (in tons) by industry.
Industry
Estimates using
Output
Intensities Ranking
Estimates using
Employment
Intensities Ranking
Aluminium 47469 3 0 16
Copper 16035 6 44495 9
Zinc 7737 8 22923 12
Iron and Steel 1639368 1 8093409 1
Cement 5168 11 28000 11
Oil Refinery 4340 12 16805 13
Drugs 5889 10 44736 8
Petrochemicals 1818 13 3805 14
Fertilisers 31480 4 106644 7
Pesticides 7366 9 37927 10
Caustic Soda 836 15 135691 5
Pulp and Paper 86245 2 801764 3
Leather 894 14 5316058 2
Dyes 0 16 1198 15
Distillery 7740 7 110334 6
Sugar 16747 5 217639 4
Source : Pandey & Ghosh
4.3. Pollution by agricultural run-offs
Pollution by agricultural run-offs has too main effects on the environment. Pesticides may be
responsible for poisoning. They are specially difficult to remove from freshwater, and thus, can
be found in municipal or bottled water, even after conventional treatment. A study from the CSE
recently drew the alarm about the concentration in pesticides such as organochlorines and
organophosphaters that was exceeding the WHO standards in almost all the Indian brands of
bottled water.
(Down to Earth, February 2003,
www.cseindia.org/html/lab/bottled_water_result.htm)
As for the fertlisers, they have an indirect adverse impact on the water resources. Indeed, by
increasing the nutritional content of the water courses, fertilisers allow organisms to proliferate.
These organisms may be disease vectors, or algae. The proliferation of algae may slower the
flow in the water courses, thus increasing again the proliferation of organisms and sedimentation.
21
In spite of these well known adverse effects, and the worrying growth of fertiliser and pesticide
use in the India agricultural sector, these products are still subsidised by the government.
The following table shows the increasing use of fertiliser and pesticide in the country.
Table 13 Evolution of fertiliser and pesticide use in India.
Fertiliser Use (Million of tones)
1984 7.7
1995-96 13.9 (80 % increase)
Pesticide Use (tones)
1971 24305
1994-95 85030 (240% increase)
Source : Central Statistical Organisation, 1999 (reported in IGIDR, 2000)
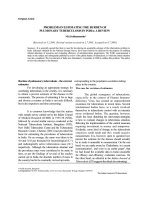
The following chart shows a detailed profile of the evolution of the consumption of the three
major chemicals used in fertilisers, i.e. Nitrates (N) Phosphates (P), and Potassium (K).
Chart 3. Trend of fertilizer consumption in India (1951 – 2000)
Source : Bathnagar & Sharma, 2002
The WHO has defined a permissible limit of concentration of Nitrates of 45 mg/L of NO3, which
is also accepted by the Indian Council of Medical Research (ICMR).
The following chart shows the relation between N-Fertilisers in several states and the respective
concentration of NO3 found in tubewells during a survey carried out in 1986.
It can be observed that in states such as Haryana, the NO3 concentration was already exceeding
by far the permissible limits in 1986. The increase in fertilisers consumption reported in the right
part of the chart leads us to assume that those concentrations are now exceeding the limits in
several other states.
22