Towards Inclusive Financial Development for Achieving the MDGs in Asia and the Pacific pptx
Bạn đang xem bản rút gọn của tài liệu. Xem và tải ngay bản đầy đủ của tài liệu tại đây (933.85 KB, 45 trang )
WP/10/07
MPDD WORKING PAPERS
Towards Inclusive Financial
Development for Achieving the
MDGs in Asia and the Pacific
Kunal Sen
Towards Inclusive Financial
Development for Achieving the
MDGs in Asia and the Pacific
Kunal Sen
Recent MPDD Working Papers
WP/09/01 Towards a New Model of PPPs: Can Public Private
Partnerships Deliver Basic Services to the Poor?
by Miguel Pérez-Ludeña
WP/09/02 Filling Gaps in Human Development Index: Findings for
Asia and the Pacific
by David A. Hastings
WP/09/03 From Human Development to Human Security: A Prototype
Human Security Index
by David A. Hastings
WP/09/04 Cross-Border Investment and the Global Financial Crisis in
the Asia-Pacific Region
by Sayuri Shirai
WP/09/05 South-South and Triangular Cooperation in Asia-Pacific:
Towards a New Paradigm in Development Cooperation
by Nagesh Kumar
WP/09/06 Crises, Private Capital Flows and Financial Instability in
Emerging Asia
by Ramkishen S. Rajan
Macroeconomic Policy and Development Division (MPDD)
Economic and Social Commission for Asia and the Pacific
United Nations Building, Rajadamnern Nok Avenue
Bangkok 10200, Thailand
Email:
Director
Dr.NageshKumar
SeriesEditor
Dr.AynulHasan
WP/10/07
MPDD Working Papers
Macroeconomic Policy and Development Division
Towards Inclusive Financial Development for Achieving the
MDGs in Asia and the Pacific
Prepared by Kunal Sen
∗
October 2010
Abstract
The views expressed in this Working Paper are those of the author(s) and should not necessarily be
considered as reflecting the views or carrying the endorsement of the United Nations. Working
Papers describe research in progress by the author(s) and are published to elicit comments and to
further debate. This publication has been issued without formal editing.
Financial development enhances domestic resource mobilisation and also
allows these resources to the most productive uses. While there is little doubt
that financial development leads to higher economic growth which may then
lead to poverty reduction, financial development in itself will allow developing
countries to achieve the Millennium Development Goals (MDGs). We will argue
in the paper that a more relevant dimension of financial development that is
important for the achievement of the MDGs is inclusiveness of the financial
system. We will develop concepts and measures of inclusive financial
development and show that measures of inclusive financial development are
positively correlated with progress towards the attainment of MDGs. We will
also present evidence of how inclusive financial development can contribute to
reaching the MDGs. Finally, we will discuss some analytical principles and
issues relating to inclusiveness in financial development.
∗
Kunal Sen is Professor of Development Economics and Policy at IDPM, School of Environment and
Development, University of Manchester, United Kingdom. This paper was prepared as an input to the
ESCAP theme study entitled Financing an Inclusive and Green Future : A Supportive Financial System
and Green Growth for Achieving the Millennium Development Goals in Asia and the Pacific.
CONTENTS
1. INTRODUCTION …………………………………………………………………………………………
1
2. FINANCE, GROWTH AND POVERTY: THE INTER-RELATIONSHIPS…………….…………….
1
3. INCLUSIVE FINANCIAL DEVELOPMENT: CONCEPT, MEASURES AND PATTERNS ………
3.1 Inclusive financial development: What do we mean by it?
3.2 Inclusive financial development: How do we measure it?
3.3 Measures of inclusive financial development and their relationship with the
MDGs………………………………………………………………………………………………
5
6
7
8
4. HOW DOES INCLUSIVE FINANCIAL DEVELOPMENT CONTRIBUTE TO PROGRESS
TOWARDS THE MDGs? ……………………………………………………………………………
4.1 Inclusive financial development and poverty reduction …………………………….………
4.2 Inclusive financial development and achieving universal primary education………….…
4.3 Inclusive financial development and improving health outcomes…………………… ……
4.4 Inclusive financial development and women’s empowerment………………………………
17
17
18
19
20
5. INCLUSIVE FINANCIAL DEVELOPMENT – SOME ANALYTICAL ISSUES…….……………….
5.1 Commercial banks……………………………………………….………………………………
5.2 Development financial institutions……………………………….…………………………….
5.3 Microfinance………………………………………………………… ………………………….
5.4 Microinsurance……………………………………………………………………………………
5.5 Stock markets…………………………………………………………………………………….
5.6 Bond markets……………………………………………………………………………………
5.7 Financial infrastructure…………………………………… ……………………………………
5.8 Financial innovation………………………………………………………………………………
21
21
22
24
26
26
27
27
29
6. POLICY RECOMMENDATIONS……………………………………………………………………….
6.1 Encouraging financial development……………………………………………………………
6.2 Encouraging the inclusiveness of the financial sector………………………….……………
29
30
31
REFERENCES …………………………………………………………………………………………….
33
APPENDIX: ABBREVIATIONS OF COUNTRIES………………………………………………………. 38
FIGURES
Figure 1: Understanding the finance-growth nexus………………………………………… 2
Figure 2: The net effect of finance on growth at different levels of inequality…………… 4
Figure 3: The inter-relationships between financial development, economic growth,
income inequality and poverty………………………………………………………
5
Figure 4: The relationship between credit market based measure of financial
development and per capita income in Asia and the Pacific……………………
9
Figure 5: The relationship between equity market based measure of financial
development and per capita income in Asia and the Pacific……………………
10
Figure 6: The relationship between credit market based measure of financial
development and poverty rates in Asia and the Pacific…………………………
10
Figure 7: The relationship between equity market based measure of financial
development and poverty rates in Asia and the Pacific…………………………
11
Figure 8: Firm based measures of inclusive financial development in Asia and the
Pacific………………………………………………………………………………….
11
Figure 9: The expected contribution of inclusive financial development to the MDGs…… 13
Figure 10: The relationship between inclusive financial development and the MDGs……. 13
Figure 11: The relationship between inclusive financial development and poverty
reduction in Asia and the Pacific…………………………………………………….
14
Figure 12: The relationship between inclusive financial development and primary
enrolment rate in Asia and the Pacific………………………………………………
14
Figure 13: The relationship between inclusive financial development and malnutrition
prevalence (height for weight of children) in Asia and the Pacific………………
15
Figure 14: The relationship between inclusive financial development and under 5
mortality rate in Asia and the Pacific………………………………………………
15
Figure 15: The relationship between inclusive financial development and the HIV
prevalence rate in Asia and the Pacific……………………………………………
16
Figure 16: The relationship between gender-inclusive financial development and the
female labor force participation rate in Asia and the Pacific……………………
16
Figure 17: Microfinance and the bottom of the pyramid……………………………………… 25
TABLE
Table 1: Household based measures of inclusive financial development in Asia and the
Pacific…………………………………………………………………………………
12
BOXES
Box 1: Microfinance success in a difficult institutional environment: the case of
Fiji……………………………………………………………………………………….
17
Box 2: Does microfinance lead to poverty reduction? Evidence from Pakistan………. 18
Box 3: Microfinance and Child health outcomes in Indonesia…………………………. 20
Box 4: The pros and cons of state intervention in credit markets……………………… 23
Box 5: The large and small of banking: the case of the ICICI bank and microfinance 23
Box 6: The role of development finance institutions in an inclusive financial
development strategy: the case of SIDBI and NABARD in India………………
24
Box 7: Leveraging remittances with microfinance in Asia and the Pacific …………… 28
Box 8: Microfinance in post-conflict environments: the case of Bougainville…………. 28
Box 9: The post office can be an important channel for financial inclusion…………… 29
Box 10: Mobile phone banking in remote regions: the case of Telmar…………………… 30
TowardsinclusivefinancialdevelopmentforachievingtheMDGsinAsiaandthePacific
1. INTRODUCTION
Financial development, broadly defined to include not just financial sector deepening but
also improvements in the efficiency of the financial sector, is vital for pro-poor growth
(Mavrotas 2009). Financial development enhances domestic resource mobilisation and also
allows these resources to the most productive uses. The cross-country literature on the
relationship between financial development and economic growth is vast – and most studies
show that financial development unambiguously and positively impacts on economic growth
(Aghion and Bolton 1997, Levine 1997). However, while there is little doubt that financial
development leads to higher economic growth which may then lead to poverty reduction, it is
less clear that financial development in itself will allow developing countries to achieve the
eight Millennium Development Goals (MDGs). We will argue in this paper that the
relationship between financial development and the achievement of the MDGs is not as
straightforward as the relationship between financial development and the achievement of
economic growth. We will further argue that the more relevant dimension of financial
development that is important for the achievement of the MDGs is inclusiveness of the
financial system. We will develop concepts and measures of inclusive financial development
and show that measures of inclusive financial development are positively correlated with
progress towards the attainment of MDGs. We will then present evidence of how inclusive
financial development can contribute to reaching the MDGs. Finally, we will discuss some
analytical principles and issues relating to inclusiveness in financial development and how
inclusiveness may be achieved in different segments of the financial system, and end with
some policy recommendations.
In the next section, we review the arguments on the finance-growth nexus and show that such
a nexus does not necessarily lead to a finance-poverty nexus. In Section 3, we propose a
broader definition of financial development that includes financial inclusion as a key
dimension. We present some measures of inclusive financial development and the
relationships between these measures and the MDGs in the Asia-Pacific region. In Section 4,
we assess what we know about the role of inclusive financial development in contributing to
the achievement of the MDGs. In Section 5, we address some analytical issues on how to
obtain greater financial inclusion in the Asia Pacific region. Section 6 will provide some
policy recommendations.
2. FINANCE, GROWTH AND POVERTY: THE INTER-RELATIONSHIPS
Since the work of the economic historian Raymond Goldsmith (1969), who found that
“rough parallelism can be observed between economic and financial development if periods
of several decades are considered” (p.48), it has been widely recognised that a well-
functioning financial system is crucial to economic growth (McKinnon 1973, Shaw 1973).
Financial development can lead to economic growth in the following five ways: i) by
facilitating the trading, hedging, diversifying, and pooling of risk, ii) by allocating resources
to the most productive uses; iii) by monitoring managers and exerting corporate; iv) by
mobilising savings, and v) by facilitating the exchange of goods and services (Levine 1997).
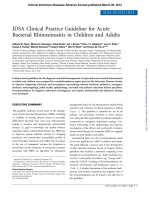
The theoretical mechanisms by which financial development leads to economic growth is
best captured by Figure 1. The figure shows schematically how financial markets and
intermediaries can be linked to growth by means of their five main functions. In fulfilling
those five functions to overcome market frictions such as information costs and transaction
costs, financial markets and intermediaries actually affect saving and allocation decisions in
1
MPDDWorkingPapersWP/10/07
ways that influence growth. Levine (1997) identifies two channels through which each
financial function may affect growth: Capital accumulation and technological innovation
(Barro and Sala-i-Martin 1995, Barro 1997). The financial system affects resource allocation
either by altering the savings rate or by reallocating savings among different capital
producing technologies. With respect to technological innovation, the functions performed
by the financial system affect economic growth by altering the rate of technological
innovation.
Figure 1: Understanding the finance-growth nexus
Market
Frictions
Financial
Functions
Financial
Markets and
Intermediaries
Channels to
Growth
Economic
Growth
1. Mobilize savings
2. Allocate resources
3. Exert corporate control
4. Facilitate risk
Management
5. Ease trading of goods
and services, contracts
1. Information costs
2. Transaction costs
1. Capital accumulation
2. Technological innovation
Source: Ozer (2008)
Therefore, the degree of financial development can have a positive effect on economic
growth both by increasing the volume of investment and its efficiency (Khan and Senhadji
2000). Financial development can increase the volume of investment by the greater
mobilisation of investible resources in the economy (Bandiera, Honohan and Schianarelli
2000). With respect to the efficiency of investment, the financial sector can improve the
allocation of investible funds in four ways. Firstly, the financial sector improves the
screening of fund-seekers and the monitoring of the recipients of funds, which improves the
allocation of resources. Secondly, in the presence of information and transactions costs, the
financial system eases the trading, hedging and pooling of risk. Thirdly, financial markets
and intermediaries mitigate the information acquisition and enforcement costs of monitoring
managers of firms and exerting corporate control. Finally, financial systems spur
technological innovation by encouraging specialisation in the economy via the lowering of
transactions costs. There is persuasive empirical evidence both across countries and for
individual countries that suggest that countries with better developed financial systems tend
to grow faster, controlling for all other determinants of economic growth.
1
1
See Abu-Bader and Abu-Qarn. 2006, Acaravci, Ozturk and Acaravci. 2007, Arestis and Demetriadis 2007,
Beck, Levine and Loayza 2000a, b, Beck and Levine 2001, Choe and Moosa. 1999, Christopoulosa and
Tsionas. 2004, Khalifa 1999, Demetriades, P.O. and K.A. Hussein.1996.
2
TowardsinclusivefinancialdevelopmentforachievingtheMDGsinAsiaandthePacific
However, while financial development can lead to higher economic growth, it is not obvious
that it will lead to higher poverty reduction (Holden and Propenko 2001). This is because of
two reasons. Firstly, the effect of financial development on poverty reduction is itself
dependent on the level of income or asset inequality in the country. For countries with high
levels of inequality, the effect of growth on poverty and therefore, of finance on poverty will
be less than for countries with low levels of inequality (Ahluwalia 1976). Secondly and more
importantly, financial development may itself exacerbate inequality in the country. Thus, as
banks and other financial intermediaries grow in size and number, they may choose to lend
only to those who have collateral and who can borrow against such collateral. This may be
high net worth households and medium and large firms in the country. Poorer households or
small and micro enterprises who do not have access to collateral may be rationed out of
financial markets. The emergence of stock markets – another crucial indicator of financial
development – may only listed companies who are usually medium or large in size, or the
richer households who would less risk averse in investing in shares with uncertain income
streams than poorer households who would be more risk averse (Demirguc-Kunt and Levine.
1996, Demirguc-Kunt 2006).
A high level of inequality may not only reduce the poverty reducing impact of economic
growth, it may itself contribute to reducing the impact of financial development on economic
growth (Clarke 1995, Partridge 1997, Aghion, Caroli and Garcia-Penalosa. 1999, Baneree and Duflo
2001)
. The reason why income distribution is likely to exert an influence on economic
efficiency is that productive opportunities might vary along the wealth distribution (Banerjee
and Newman 1993, Blanchflower and Oswald 1998, Parker 2000). Where information is
costly and imperfect, equilibrium credit rationing will arise - that is, agents will be able to
obtain credit only if they own assets that can be used as collateral. A more unequal
distribution of assets would then imply that, for any given level of per capita income, a
greater number of people are credit constrained (Deininger and Olinto 2000). In an economy
where individuals make indivisible investments - in schooling, for example- that have to be
financed through borrowing, this would imply lower physical and human capital formation
and hence, aggregate growth (King and Levine 1993a, b; Deininger and Squire, 1998).
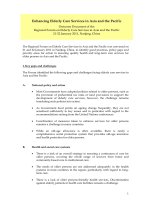
The fact that the effect of finance on growth is conditional on the level of inequality is clear
from Figure 2, which shows that the effect of financial development on economic growth at
different levels of income inequality. The figure shows that the greater the level of inequality
(as measured by the Gini coefficient), the lower the magnitude of the positive effect of
finance on growth. The impact of finance on growth is more than six times larger when a
country has a Gini coefficient of 10 per cent as compared to when a country has a Gini
coefficient of 90 per cent.
The inter-relationships between financial development, economic growth and income
inequality are depicted in Figure 2. Financial development can reduce poverty by increasing
economic growth. However, financial development can exacerbate income inequality, and
thus, can lead to higher poverty, for the same of economic growth. Higher income inequality
can negatively impact on economic growth, and thus, bring about a decrease in the rate of
economic growth. Economic growth also may widen disparities between individuals and
groups in the economy, and by increasing inequality, reduce the impact of financial
development on poverty reduction. This suggests that the relationship between financial
development and poverty reduction is complex and depends on whether financial
development increases inequality and whether this increased inequality is large enough to
3
MPDDWorkingPapersWP/10/07
dwarf the positive effect of financial development on poverty reduction via higher economic
growth. It also depends on whether economic growth and income inequality mutually
reinforce each other such that higher inequality leads to lower growth and higher growth
leads to higher inequality.
Figure 2. The net effect of finance on growth at different levels of inequality
0
1
2
3
4
5
6
7
8
9
5 101520253035404550556065707580859095100
Gini Coefficient
Average Per Capita GDP Growth
Source: Ozer and Sen (2009)
For financial development to have an unambiguous positive effect on poverty reduction, it
must lead to both an increase in economic growth and a decrease in income inequality. Such
an outcome is most likely if financial development is inclusive. Financial development that is
not inclusive and that does not reduce asset and income inequalities in the economy has less
of a likelihood in reducing MDG 1 – halving income poverty by 2015, and may also for the
same reason may contribute to progress in attaining MDGs relating to health, nutrition and
health. But how do we define inclusive financial development? We do this in the next
section.
4
TowardsinclusivefinancialdevelopmentforachievingtheMDGsinAsiaandthePacific
Figure 3. The inter-relationships between financial development,
economic growth, income inequality and poverty
Inequality
Poverty
Growth
Finance
Source: Author
3. INCLUSIVE FINANCIAL DEVELOPMENT: CONCEPT, MEASURES AND
PATTERNS
Financial development is the increase in the size of the financial sector relative to economic
activity. Higher levels of financial development are brought about by the increase in number
of financial intermediaries such as commercial banks and co-operative credit unions along
with an increase in the size of these intermediaries. Higher levels of financial development
are also brought about by increase in the depth of capital markets such as stock and bond
markets, along with an increase in the range of financial instruments available in the these
markets. Two standard measures of financial development are the share of domestic credit to
the private sector as a ratio of GDP, and market capitalisation (stock market trading volume)
of listed companies as a ratio of GDP. The first could be called the credit based measure of
financial development and the second the equity based measure of financial development. It
is clear from Figures 4 and 5 that both the credit and equity based measures of financial
development are positively related to higher economic development, as measured by per
capita GDP. However, the relationship between financial development and poverty reduction
is less clear, as is seen in Figures 6 and 7.
5
MPDDWorkingPapersWP/10/07
This indicates that financial development by itself is unlikely to contribute to MDGs, if it is
not sufficiently inclusive. Commercial banks and other financial intermediaries may only
lend to medium and large sized firms and to rich households who can provide the necessary
collateral to these intermediaries for lending purposes. Capital markets may channelize funds
only to the large listed companies, who have the ability to pay for the high fixed costs
necessary to issue shares in the stock market or who have been in existence for a long enough
period to obtain credit ratings that are necessary for issuing bonds, debentures and fixed
deposits. Both credit and capital markets may ration credit to small and micro enterprises or
to poor households who may not have the history of past borrowing to obtain credit ratings
necessary to borrow from capital markets, cannot meet the costs of underwriters necessary to
issue shares and are seen as risky customers by commercial banks and other financial
intermediaries. This implies that only a financial sector that is inclusive in its ability to bring
in previously underbanked households or to lend to small and micro enterprises can be a
potent positive force for achieving MDGs (UNCTAD 2001).
3.1 Inclusive financial development: What do we mean by it?
Inclusive financial development is the development of the financial system that is biased
towards the poor. . A stronger definition of inclusive financial development is that it is
financial development that is actually driven by access of the poor to financial services and
products.
It is important to note that inclusive financial development is not the same thing as financial
inclusion. The latter simply captures the increasing access of poor households to financial
services (for example, the possibility of depositing funds in a financial institution by a poor
household in a remote rural village), regardless of its effect on the growth of the financial
sector in the economy.
2
Inclusive financial development implies both financial inclusion and
growth in the width and depth of the financial sector. Thus, inclusive financial development
will occur when the inclusiveness of the financial sector does not retard its growth
possibilities. Clearly, it is possible for policy-makers to require financial institutions by
government regulation to open branches in remote regions of the country, so that the poor
can access these branches. However, if such government intervention leads to the creation of
unviable branch expansion that itself impedes the development of the banking system in the
country or the efficiency of financial intermediation, such an attempt to bring about financial
inclusion may not necessarily lead to inclusive financial development, and have negative
effects on economic growth, and hence, on poverty reduction. Put in another way, inclusive
financial development should be a pattern of financial development that should
simultaneously lead to higher economic growth and reductions in social exclusion and
income inequality.
2
Information on financial inclusion is available in web-sites such as www.afi-global.net. The data on financial
inclusion in the Asia-Pacific region is patchy, with few systematic studies on the extent of financial exclusion in
the region. An exception is the report of the Committee on Financial Inclusion constituted by the National Bank
for Agriculture and Rural Development in India (NABARD, 2008). The committee reports that 51.4 per cent of
farmer households are financially excluded from both formal / informal sources, and of the total farmer
households, only 27 per cent access formal sources of credit, with one third of this group also borrow from non-
formal sources. Overall, 73 per cent of farmer households in India have no access to formal sources of credit.
6
TowardsinclusivefinancialdevelopmentforachievingtheMDGsinAsiaandthePacific
3.2 Inclusive financial development: How do we measure it?
Measuring inclusive financial development is important as it allows us to assess to what
extent a country’s financial system is inclusive, relative to other countries in the region. It
also allows us to examine the relationship between inclusive financial development and the
relevant MDGs that financial sector may be expected to have an impact on.
To measure inclusive financial development in the Asia and the Pacific, we need indicators
that can be calculated using data which is readily available for as many countries as possible
in the Asia-Pacific region. We propose two sets of measures of inclusive financial
development. The first is the share of firms in total firms in the country that have access to
credit. Allied with this is the share of firms in the country which are owned by females. We
call these measures the Firm Based Measures of Inclusive Financial Development. The
data for this measure is available from the World Bank’s World Development Indicators. The
second set of measures is the proportion of the country’s population who are depositors in
microfinance institutions, along with the proportion of borrowers who are women, and the
average loan balance and deposit balance per borrower/depositor as a ratio of Gross National
Income (GNI) per capita. The data are available from www.mixmarket.org, which is a global,
web-based, microfinance information platform. It provides information to sector actors and
the public at large on microfinance institutions (MFIs) worldwide, public and private funds
that invest in microfinance, MFI networks, raters/external evaluators, advisory firms, and
governmental and regulatory agencies. MIX Market currently provides data on over 1400
MFIs, several of whom are based in Asia and the Pacific.
3
We call this set of measures the
Household Based Measures of Inclusive Financial Development.
We start with the Household Based Measures of Inclusive Financial Development, and
provide estimates of it for countries in Asia and the Pacific for which we have data. We do
this in Table 1. Considering the average loan balance per borrower (as a ratio of Gross
National Income per capita), we can see countries in Central Asia have very high loans
balances per borrower, indicating significant depth in the microfinance sector. For example,
Kyrgistan has an average loan balance per borrower as a ratio of GNI per capita of 347 per
cent. In contrast, loan balances per borrower is very low in countries like Thailand and
Turkey at 5.1 per cent and 4.8 per cent respectively. Not surprisingly, a similar picture
emerges when one considers average deposit balance per depositor (as a ratio of GNI per
capita) – countries in Central Asia have high deposit balances per depositor.
Using a different indicator of financial inclusion at the household level – the percentage of
women borrowers in total borrowers, we find that 91.6 per cent of borrowers in Bangladesh
are women. In contrast, only 13.2 per cent of borrowers in Uzbekistan are women.
Bangladesh has also one of the highest percentages of depositors in the total population at
18.1 per cent. This may be an indication of the success of MFIs in Bangladesh and their
ability to target women in lending activities.
3
The mix market data-base is regarded as the most reliable data-base on microfinance and is widely used by
researchers working on micro-finance. The data-base reports data on individual microfinance institutions. We
compute simple averages of the requisite variables for individual micro finance institutions for each country in
the Asia Pacific region for which the data is available.
7
MPDDWorkingPapersWP/10/07
Moving on to firm based measures of inclusive financial development in Figure 8, we find
that about 75 per cent of firms in Thailand have access to credit while only 8 per cent of
firms in Uzbekistan have access to credit. With respect to female ownership, 41 per cent of
firms in Georgia and Turkey are owned by women, while only 16 per cent of firms in
Bangladesh are owned by women. The low rate of female ownership of firms in Bangladesh
contrasts with the high rate of women are borrowers from MFIs in the same country. This
shows that the firm and household based measures of inclusive financial development are
capturing different dimensions of inclusive financial development, and that one set of
measures by itself may not be sufficiently informative of the degree of inclusive financial
development in the country.
3.3 Measures of inclusive financial development and their relationship with the MDGs
Is there a prima facie case of inclusive financial development being a contributor to the
achievement of the MDGs? To address this question, we can examine the relationship
between our measures of inclusive financial development and the different indicators of
MDG progress. Before we do this, we first need to establish which specific MDG we expect
to be impacted on by inclusive financial development. As shown in Figure 9, among the eight
MDGs, we expect inclusive financial development to specifically impact on the six MDGs
that deal with poverty and hunger, education, gender equality and health. The more inclusive
the financial sector in reaching out to the poorest, and the more likely the inclusivity of the
financial development will bring about a change in economic and social well-being of poor
households. Inclusive financial development will lead to higher income growth of
economically and socially disadvantaged households, leading to lower poverty reduction and
less hunger among members of the household. As depicted in Figure 10, higher income
growth will also lead to the likelihood that the poorer households send their children to
school and that their nutritional intake is such they are less likely to be prone to chronic and
debilitating illness. Higher income growth of poor households also allow them to access
costly health services that may not have been within reach when they had less income.
Therefore, higher income growth of poor households brought about by inclusive financial
development is expected to lead to better health and educational outcomes of these
households, and by doing so, contribute to the attainment of the MDGs on universal primary
education, and on reducing the infant mortality and maternal mortality rates and the HIV
prevalence rate. Inclusive financial development is also expected to lead to lower poverty
rates (as measured by the $1.25 dollar a day poverty line, for example) and lower degree of
malnutrition among children. The decrease in poverty itself will lead to better educational
and health outcomes of poor households.
With respect to the MDG on gender equality, financial development that is particularly
inclusive of women may be expected to womens’ empowerment and progress in gender
related indicators of economic and social development.
We examine the relationship between inclusive financial development and the different
indicators of MDG progress in Asia and the Pacific in Figures 11, 12, 13, 14, 15 and 16. We
8
TowardsinclusivefinancialdevelopmentforachievingtheMDGsinAsiaandthePacific
use depositors in MFIs as a percentage of total population as our preferred measure of
inclusive financial development. In Figure 11, we plot the relationship between depositors as
percentage of population and the poverty headcount ratio (using $1.25 per day as the poverty
line). In Figure 12, we plot the relationship between depositors as percentage of population
and the primary enrolment rate. In Figure 13, we plot the relationship between depositors as
percentage of population and malnutrition prevalence (using height for age for children). In
Figure 14, we plot the relationship between depositors as percentage of population and the
under 5 mortality rate. In Figure 15, we plot the relationship between depositors as
percentage of population and the HIV prevalence rate. Finally, in Figure 16, we plot the
relationship between female ownership of firms and the labour force participation rate of
women. In all these graphs, we see a clear relationship between inclusive financial
development and the MDG indicator, where higher inclusiveness of the financial sector is
associated with improvements in the indicator and progress towards the MDG in question.
The most striking relationship is between inclusive financial development and poverty
reduction, where a greater degree of inclusive financial development is related with declining
poverty rates.
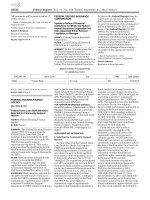
Figure 4. The relationship between credit market based measure of
financial development and per capita income in Asia and the Pacific
ARM
AUS
CHN
GEO
IDN
IRN
JPN
MYS
MDV
NZL
PHL
RUS
SGP
SLB
SLA
THA
TON
TKM
VUN
AZE
BGD
BHN
BRN
KHM
FJI
IND
KAZ
KOR
KGZ
LAO
FSM
MNG
NPL
PAK
PNG
SAM
TJK
TML
TUR
VNM
0
10000
20000
30000
40000
50000
60000
0 50 100 150 200 250
Domestic Credit to Private Sector, % of GDP
GDP per capita, constant $ PPP
Source: Author’s calculations from World Bank’s World Development Indicators.
9
MPDDWorkingPapersWP/10/07
Figure 5. The relationship between equity market based measure of
financial development and per capita income in Asia and the Pacific
AUS
CHN
FJI
IRN
JPN
KAZ
KZG
MNG
NPL
PAK
PHL
SGP
LKA
TUR
VNM
ARM
AZE
BGD
BHN
GEO
IND
IDN
NZL
PNG
RUS
THA
UZB
0
5000
10000
15000
20000
25000
30000
35000
40000
0 20 40 60 80 100 120 140 160 180
Market Capitalisation as % of GDP
GDP per capita, constant $ PPP
Source: Author’s calculations from World Bank’s World Development Indicators.
Figure 6. The relationship between credit market based measure of
financial development and poverty rates in Asia and the Pacific
ARM
AZE
BGD
BHN
KHM
CHN
GEO
IRN
KAZ
KGZ
LAO
MYS
MNG
PAK
PNG
PHL
LKA
TJK
THA
TML
VNM
IND
NPL
RUS
TUR
TKM
0
10
20
30
40
50
60
70
0 20 40 60 80 100 120 140 160
Domestic Credit to Private Sector (as % of GDP)
Poverty Rate ($1.25 per day)
Source: Author’s calculations from World Bank’s World Development Indicators.
10
TowardsinclusivefinancialdevelopmentforachievingtheMDGsinAsiaandthePacific
Figure 7. The relationship between equity market based measure of
financial development and poverty rates in Asia and the Pacific
0
10
20
30
40
50
60
70
0 102030405060708
Market Capitalisation as Percentage of GDP
Poverty Rate ($1.25 per day)
ARM
AZE
BGD
BTN
CHN
IND
KAZ
KGZ
MNG
NPL
PAK
PNG
PHL
RUS
LKA
THATUR
UZB
VNM
IR
0
N
GEO
Source: Author’s calculations from World Bank’s World Development Indicators.
Figure 8. Firm based measures of inclusive financial development
in Asia and the Pacific
BGD
KHM
CHN
GEO
IND
IDN
KOR
LAO
MYS
PAK
PHL
LKA
TJK
THA
TUR
UZB
VNM
0
10
20
30
40
50
60
70
80
Percenta
g
e of Total
Firms
Firms with access to credit
Female Ownership
Source: Author’s compilation from www.mixmarket.org and World Bank’s World Development Indicators
11
MPDDWorkingPapersWP/10/07
Table 1. Household based measures of inclusive financial development
in Asia and the Pacific
Countries
Average loan
balance per
borrower /
Gross
National
Income (GNI)
per capita
(per cent)
Average
deposit
balance per
depositor /
GNI per
capita
Women
borrowers as
per cent of
Total
borrowers
Depositors as
percentage of
Population
Afghanistan 86.9 24.8% 69.81
Armenia 44.6 391.0% 31.11 4.13
Azerbaijan 93.8 305.5% 34.34 0.19
Bangladesh 17.7 6.1% 91.60 18.12
Cambodia 91.8 103.6% 60.71 2.71
China 34.5 1.0% 63.39
Timor-Leste 26.0 5.0% 82.53
Georgia 84.0 20.0% 22.29 8.44
India 18.2 5.3% 92.77 0.29
Indonesia 53.8 15.9% 48.13 10.58
Kazakhstan 296.2 45.10
Kyrgyzstan 347.2 453.5% 62.21 0.49
Lao PDR 33.6 6.0% 0.01
Mongolia 83.5 36.0% 10.27 66.69
Nepal 95.9 17.4% 97.00 2.40
Pakistan 22.8 12.0% 48.70 0.30
Papua New
Guinea 56.7 16.5% 2.90
Philippines 22.7 14.0% 70.38 2.99
Russia 79.8 77.6% 40.74 0.03
Samoa 8.4 1.0% 99.81 2.63
Sri Lanka 19.0 7.6% 58.14 5.55
Tajikistan 275.4 773.0% 42.24 0.43
Thailand 5.1 94.49
Turkey 4.8 0.0% 100.00
Ukraine 160.8 86.0%
Uzbekistan 176.8 112.0% 13.24 0.17
Viet Nam 15.2 5.6% 61.74 0.20
Source: Author’s calculations, from www.mixmarket.org and World Bank’s World Development Indicators
12
TowardsinclusivefinancialdevelopmentforachievingtheMDGsinAsiaandthePacific
Figure 9. The expected contribution of inclusive financial development to the MDGs
Millennium
Development
Goals
Gender
Equality
Hea l th
Environment
Gl obal
Partnership
Education
Poverty
1. Eradicate extreme
p
overt
y
and hun
g
e
r
2. Achieve universal
p
rimar
y
education
3. Promote gender
equality and
empower women
4. Reduce child
mo rtal it
y
7. Ensure
environmental
stability
8. Develop a global
partnership for
development
6. Combat
HIV/AIDS, malaria
and other diseases
5. Improve materna
l
heal th
Theme Goal s Targets
1. Halve proporti on of people who live on <1$
a
2. Halve proporti on of people who suffer from
h
3. Access to complete primary schooling
4. Access for all genders to primary and second
a
(2015)
5. Reduce by 2/3 , the under-five mortality rate
6. Reduce by 3/4, the maternal mortality rate
7. Halt and begin to reverse the spread of HIV/
A
8. Halt and begin to reverse the spread of malari
9. Integrate principles of sustainable developme
n
10. Access to safe drinking water and sanitation
11. Improve lives of at least 100 million city dw
e
12. Develop trading and financial system
13. Address needs of least developed countries
14. Address needs of landl ocked count ries and is
l
15. Deal with debt problems and make sustainabl
16. Provi de decent and productive work for yout
h
17. Provide access to affordable and essential dr
u
1
8.
A
va
il
ab
ili
ty
o
f n
ew
tec
hn
o
l
og
i
es
a
n
d
I
C
T’
s
Source: Adapted from Claessens and Feijen (2006)
Figure 10. The relationship between inclusive financial development and the MDGs
Inclusive
Financial
Develo
p
men
t
Income
(Growth)
MDGs
Health,
Education, and
Gender Equality
MDG
Poverty
(
Income
Source: Adapted from Claessens and Feijen (2006)
13
MPDDWorkingPapersWP/10/07
Figure 11. The relationship between inclusive financial development and
poverty reduction in Asia and the Pacific
0
10
20
30
40
50
60
70
0.00 1.00 2.00 3.00 4.00 5.00 6.00 7.00 8.00 9.00
Depositors as % of Popln
Poverty Rate ($1.25 per day)
LKA
PHL
PNG
KHM
NPL
KGZ
TJK
ARM
LAO
IND
PAK
UZB
RUS
Source: Author’s calculations from www.mixmarket.org and World Bank’s World Development Indicators.
Figure 12. The relationship between inclusive financial development and
primary enrolment rate in Asia and the Pacific
AFG
ARM
KHM
GEO
IDN
KGZ
PAK
PNG
PHL
SLA
TJK
IND
LAO
RUS
SAM
UZB
VNM
0
20
40
60
80
100
120
0.00 2.00 4.00 6.00 8.00 10.00 12.00
Depositors as % of Popln
Primary Enrolment Rate
Source: Author’s calculations from www.mixmarket.org and World Bank’s World Development Indicators.
14
TowardsinclusivefinancialdevelopmentforachievingtheMDGsinAsiaandthePacific
Figure 13. The relationship between inclusive financial development and
malnutrition prevalence (height for weight of children) in Asia and the Pacific
AFG
ARM
KHM
IND
KGZ
NPL
LKA
TJK
UZB
IDN
LAO
PAK
PHL
VNM
0
10
20
30
40
50
60
70
0.00 2.00 4.00 6.00 8.00 10.00 12.00
Depositors as % of Popln
Malnutrition Prevalence, height for age, (% of
children)
Source: Author’s calculations from www.mixmarket.org and World Bank’s World Development Indicators.
Figure 14. The relationship between inclusive financial development and the
under-5 mortality rate in Asia and the Pacific
AFG
KHM
IDN
NPL
PAK
PNG
PHL
LKA
UZB
ARM
GEO
IND
KGZ
LAO
RUS
SAM
TJK
VNM
0
50
100
150
200
250
300
0.00 2.00 4.00 6.00 8.00 10.00 12.00
Depositors as % of Popln
Under 5 Mortality Rate
Source: Author’s calculations from www.mixmarket.org and World Bank’s World Development Indicators.
15
MPDDWorkingPapersWP/10/07
Figure 15. The relationship between inclusive financial development and
the HIV prevalence rate in Asia and the Pacific
PHL
ARM
GEO
IND
IDN
KGZ
LAO
NPL
PAK
PNG
SAM
UZB
VNM
0
0.2
0.4
0.6
0.8
1
1.2
1.4
0.00 2.00 4.00 6.00 8.00 10.00 12.00
Depositors as % of Popln
HIV Prevalence Rate (%)
Source: Author’s calculations from www.mixmarket.org and World Bank’s World Development Indicators.
Figure 16. The relationship between gender-inclusive financial development and the
female labour force participation rate in Asia and the Pacific
BGD
TUR
VNM
GEO
IND
KOR
TJK
UZB
0
10
20
30
40
50
60
70
80
0 5 10 15 20 25 30 35 40 45
Labor participation rate, female (% of female population ages 15+)
Female Participation in Ownership (% of firms)
Source: Author’s calculations from www.mixmarket.org and World Bank’s World Development Indicators.
16
TowardsinclusivefinancialdevelopmentforachievingtheMDGsinAsiaandthePacific
4. HOW DOES INCLUSIVE FINANCIAL DEVELOPMENT CONTRIBUTE TO
PROGRESS TOWARDS THE MDGS?
In this section, we assess what we know about the manner inclusive financial development
may assist in the achievement of the MDGs. We draw from the secondary literature, and rely
on existing studies that have rigorously addressed the relationship between inclusive
financial development and the MDGs. We first examine the evidence on poverty reduction,
then look at educational and health outcomes in turn, and end with the evidence on womens’
empowerment.
The evidence will be primarily drawn from the impact of microfinance on the MDGs. By
microfinance, we mean any financial institution which is small-scale in size and whose
primary clientele are low income households and micro-enterprises. Microfinance
institutions, by their very nature, reach out to such households and enterprises, who may have
significant problems accessing finance from other sources. Microfinance, therefore, has been
the key element of inclusive financial development wherever it has occurred in the Asia
Pacific region (ESCAP 2006). However, it is not the only element in inclusive financial
development and we will argue in the next section that other segments of the financial system
such as commercial banks and innovative ways of providing financial services such as post
offices must be leveraged on for accelerated inclusive financial development.
4.1 Inclusive financial development and poverty reduction
Access to finance allows poor people to protect, diversify, and increase their sources of
income. We know these are the essential routes out of poverty, and inclusive financial
development can help poor households in buffering sudden shocks to incomes and assets.
Inclusive financial development also allows poor households and micro enterprises to borrow
and invest in productive human capital (such as sending children to school) and productive
physical capital (such as agricultural machinery).
Microfinance also helps protect poor households against the extreme vulnerability that
characterizes their everyday existence. Loans, savings, and insurance help smooth out
income fluctuations and maintain consumption levels even during lean periods. The
availability of financial services acts as a buffer for sudden emergencies, business risks,
climactic shocks or events, such as a flood or a death in the family, that can push a poor
family into destitution (CGAP 2003).
Box 1: Microfinance Success in a Difficult Institutional Environment:
The Case of Fiji
The Republic of Fiji includes about 332 islands, of which approximately one-third is populated.
About 25 per cent of the population are below the poverty line, according to the Government’s 1996
Poverty Report. Given the low density of population in Fiji, it would have been difficult for
microfinance institutions to be successful. However, the Government of Fiji established the National
Microfinance Unit in 1999 to provide very poor families to engage in productive activities and to
grow. The scheme has been successful, with the loans disbursed doubling from 164 thousand Fijian
dollars in 2000 to 379 thousand Fijian dollars in 2003. The repayment rate has been 90%. Mostly
women have been recipients of the loans.
Source: Kinivuwai, L. (2005). “Developing Micro Finance in Fiji: Challenges and Successes”, mimeo.
17
MPDDWorkingPapersWP/10/07
There is robust evidence that poor households who have access to financial services do better
over time in terms of economic well-being than poor households who do not have access to
such services. For example, borrowers in a MFI called Bank Rakyat Indonesia increased their
incomes by 12.9 per cent compared to increases of 3 per cent in households who did not
belong to the MFI. Three-fourths of clients of a MFI called SHARE in India saw significant
improvements in well-being and half moved out of poverty. Members in Bangladesh of a
MFI called BRAC in Bangladesh who stayed in program for more than 4 years increased
household expenses by 28 per cent and assets by 112 per cent. Grameen Bank is one of the
most well respected MFI in the world, and members of Grameen Bank in Bangladesh had
incomes which were 43 per cent higher than incomes of non-members in villages not served
by the Grameen Bank and 28 per cent higher in villages served by the Grameen Bank.
Box 2: Does Microfinance Lead to Poverty Reduction? Evidence from Pakistan
Using data from a survey of clients of the leading microfinance bank in Pakistan, Khushhali Bank
(KB), in 2005, Setboonsarng and Parpiev (2008) find that the lending program contributed
significantly to income generation activities such as agricultural production and, in particular, animal
raising, leading to lower poverty among the client households. The study confirms that KB has been
effective, overall, in reaching out to the poor and has rapidly expanded its outreach to remote rural
areas of Pakistan, consistent with the government’s poverty alleviation program.
Source: Setboonsarng, S. and Z. Parpiev (2008). Microfinance and the Millennium Development Goals in
Pakistan: Impact Assessment Using Propensity Score Matching, ADBI Institute Working Paper No. 104.
4.2 Inclusive financial development and achieving universal primary education
Investing in education of their children is the most likely way that poor households can break
out of the intergeneration poverty trap. This is perhaps why one of the first things poor
people do with new income from microenterprise is invest in their children’s education.
Studies show that children of microfinance clients are more likely to go to school and stay in
school longer. Student drop-out rates are much lower in microfinance-client households
(CGAP 2003). To support this priority, many microfinance programs are developing new
credit and savings products specifically tailored to school expenses.
The evidence on the effect of inclusive financial development in promoting universal primary
education is strong. A longitudinal study in a BRAC area in Bangladesh found that basic
competency in reading, writing, and arithmetic among children 11–14 years old in member
households had increased from 12 per cent of children at the start of the program in 1992 to
24 per cent in 1995. In non-member households, only 14 per cent of children could pass the
education competency tests in 1995. An ethnographic study of a Grameen village shows a
much higher levels of schooling of Grameen children compared to children of non-members.
Almost all of the girls in Grameen households had some schooling compared to 60 per cent
of girls in the comparison group; 81 per cent of Grameen boys went to school compared to
54 per cent in non-Grameen households (CGAP 2003). This is also substantiated in the
World Bank study in 1998, which found higher levels of schooling for children of all credit
program participants and statistically significant higher rates of schooling for girls in
Grameen households.
18