Measuring Financial Inclusion - The Global Findex Database docx
Bạn đang xem bản rút gọn của tài liệu. Xem và tải ngay bản đầy đủ của tài liệu tại đây (1.14 MB, 61 trang )
P R W P
6025
Measuring Financial Inclusion
e Global Findex Database
Asli Demirguc-Kunt
Leora Klapper
e World Bank
Development Research Group
Finance and Private Sector Development Team
April 2012
WPS6025
Public Disclosure AuthorizedPublic Disclosure AuthorizedPublic Disclosure AuthorizedPublic Disclosure Authorized
Produced by the Research Support Team
Abstract
e Policy Research Working Paper Series disseminates the ndings of work in progress to encourage the exchange of ideas about development
issues. An objective of the series is to get the ndings out quickly, even if the presentations are less than fully polished. e papers carry the
names of the authors and should be cited accordingly. e ndings, interpretations, and conclusions expressed in this paper are entirely those
of the authors. ey do not necessarily represent the views of the International Bank for Reconstruction and Development/World Bank and
its aliated organizations, or those of the Executive Directors of the World Bank or the governments they represent.
P R W P 6025
is paper provides the rst analysis of the Global
Financial Inclusion (Global Findex) Database, a new set
of indicators that measure how adults in 148 economies
save, borrow, make payments, and manage risk. e
data show that 50 percent of adults worldwide have an
account at a formal nancial institution, though account
penetration varies widely across regions, income groups
and individual characteristics. In addition, 22 percent of
adults report having saved at a formal nancial institution
is paper is a product of the Finance and Private Sector Development Team, Development Research Group. It is part of
a larger eort by the World Bank to provide open access to its research and make a contribution to development policy
discussions around the world. Policy Research Working Papers are also posted on the Web at .
e authors may be contacted at and
in the past 12 months, and 9 percent report having taken
out a new loan from a bank, credit union or micronance
institution in the past year. Although half of adults
around the world remain unbanked, at least 35 percent
of them report barriers to account use that might be
addressed by public policy. Among the most commonly
reported barriers are high cost, physical distance, and lack
of proper documentation, though there are signicant
dierences across regions and individual characteristics.
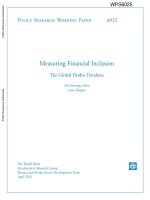
Measuring Financial Inclusion:
The Global Findex Database
Asli Demirguc-Kunt and Leora Klapper
*
This Version: April, 2012
Abstract: This paper provides the first analysis of the Global Financial Inclusion (Global Findex)
Database, a new set of indicators that measure how adults in 148 economies save, borrow, make
payments, and manage risk. The data show that 50 percent of adults worldwide have an account at a
formal financial institution, though account penetration varies widely across regions, income groups and
individual characteristics. In addition, 22 percent of adults report having saved at a formal financial
institution in the past 12 months, and 9 percent report having taken out a new loan from a bank, credit
union or microfinance institution in the past year. Although half of adults around the world remain
unbanked, at least 35 percent of them report barriers to account use that might be addressed by public
policy. Among the most commonly reported barriers are high cost, physical distance, and lack of proper
documentation, though there are significant differences across regions and individual characteristics.
Keywords: Financial Inclusion; Financial Institutions; Emerging Markets
JEL Codes: G2, G21, O16
* Demirgüç-Kunt: World Bank, ; Klapper: World Bank,
We thank Franklin Allen, Oya Pinar Ardic Alper, Thorsten Beck, Massimo Cirasino, Robert Cull, Maya Eden, Asli
T. Egrican, Tilman Ehrbeck, Michael Fuchs, Xavi Gine, Markus Goldstein, Ruth Goodwin-Groen, Raul
Hernandez-Coss, Richard Hinz, Jake Kendall, Aart Kraay, Alexia Latortue, Sole Martinez Peria, Ignacio Mas-Ribo,
Jonathan Morduch, Nataliya Mylenko, Mark Napier, Douglas Pearce, Bikki Randhawa, Richard Rosenberg,
Armida San Jose, Kinnon M. Scott, Peer Stein, Gaiv Tata, Jeanette Thomas, Klaus Tilmes, Augusto de la Torre,
Rodger Voorhies, and Alan Winters for their valuable and substantive comments during various stages of the
project. The team is also appreciative for the excellent survey execution and related support provided by Gallup,
Inc. under the direction of Jon Clifton. We are especially grateful to the Bill & Melinda Gates Foundation for
providing financial support making the collection and dissemination of the data possible. This paper was prepared
with outstanding assistance from Douglas Randall. This paper’s findings, interpretations, and conclusions are
entirely those of the authors and do not necessarily represent the views of the World Bank, their Executive
Directors, or the countries they represent.
MEASURING FINANCIAL INCLUSION
1
Well-functioning nancial systems serve a vital purpose, oering savings, credit,
payment, and risk management products to people with a wide range of needs.
Inclusive nancial systems—allowing broad access to nancial services, with-
out price or nonprice barriers to their use—are especially likely to benet poor
people and other disadvantaged groups. Without inclusive nancial systems,
poor people must rely on their own limited savings to invest in their education
or become entrepreneurs—and small enterprises must rely on their limited earn-
ings to pursue promising growth opportunities. is can contribute to persistent
income inequality and slower economic growth.
1
Until now little had been known about the global reach of the nancial sector—t
he
extent of nancial inclusion and the degree to which such groups as the poor,
women, and youth are excluded from formal nancial systems. Systematic indica-
tors of the use of dierent nancial services had been lacking for most economies.
e Global Financial Inclusion (Global Findex) database provides such indicators.
is report presents the rst round of the Global Findex database, a new set of
indicators that measure how adults in 148 economies save, borrow, make pay-
ments, and manage risk. e indicators are constructed with survey data from
interviews with more than 150,000 nationally representative and randomly selected
adults age 15 and above in those 148 economies during the 2011 calendar year.
2
e Global Findex data show sharp disparities in the use of nancial services
between high-income and developing economies and across individual character-
istics. e share of adults in high-income economies with an account at a formal
nancial institution is more than twice that in developing economies. And around
the world, men and more educated, wealthier, and older adults make greater use
of formal nancial services.
Novel cross-country data on self-reported reasons for not having a formal ac-
count make it possible to identify barriers to nancial inclusion. Moreover, the
ability to disaggregate data by individual characteristics allows researchers and
policy makers to identify population groups that are excluded from the formal
nancial system and better understand what characteristics are associated with
certain nancial behaviors.
As the rst public database of indicators that consistently measure people’s use of
nancial products across economies and over time, the Global Findex database
lls a big gap in the nancial inclusion data landscape. e data set can be used
to track the eects of nancial inclusion policies globally and develop a deeper
and more nuanced understanding of how people around the world save, borrow,
make payments, and manage risk. e main indicators on the use of formal ac-
counts and formal credit will be collected yearly, and the full set of indicators
every three years.
INTRODUCTION
MEASURING FINANCIAL INCLUSION
2
The use of formal accounts varies widely across regions,
economies, and individual characteristics
Worldwide, 50 percent of adults report having an individual or joint account at
a formal nancial institution. But while account penetration is nearly universal
in high-income economies, with 89 percent of adults reporting that they have
an account at a formal nancial institution, it is only 41 percent in developing
economies. Globally, more than 2.5 billion adults do not have a formal account,
most of them in developing economies.
e dierences in account ownership by individual characteristics are particularly
large in developing economies. While 46 percent of men have a formal account,
only 37 percent of women do. Indeed, there is a persistent gender gap of 6–9 per-
centage points across income groups within developing economies. Among all
adults in the developing world, those in the richest quintile (the top 20 percent
of the income distribution within an economy) are on average more than twice
as likely as those in the poorest to have a formal account.
Unique data on the mechanics of account use across economies show that here too
there are sharp dierences between high-income and developing economies—in
the frequency of deposits and withdrawals, in the way that people access their ac-
counts, and in the payment systems they use. In developing economies 10 percent
of adults with a formal account report making no deposits or withdrawals in a
typical month; in high-income economies only 2 percent report this. Most ac-
count holders in developing economies make deposits and withdrawals primarily
through tellers at bank branches; their counterparts in high-income economies
rely more heavily on automated teller machines (ATMs). Debit cards, checks, and
electronic payments are also far more commonly used in high-income economies.
But there is a bright spot in the expansion of nancial services in the developing
world: the recent introduction of “mobile money.” e greatest success has been
in Sub-Saharan Africa, where 16 percent of adults—and 31 percent of those with
a formal account—report having used a mobile phone in the past 12 months to
pay bills or send or receive money.
e purposes and benets of account use vary widely. Worldwide, 26 percent of
account holders use their account to receive money or payments from the gov-
ernment. is practice is most common in high-income economies and relatively
rare in South Asia and East Asia and the Pacic. Compared with counterparts in
other parts of the world, adults with a formal account in high-income economies,
Europe and Central Asia, and Latin America and the Caribbean are the most likely
to report having used their account in the past year to receive wage payments, and
those in Sub-Saharan Africa the most likely to report having used their account
to receive payments from family members living elsewhere.
Worldwide, 22 percent of adults report having saved at a formal nancial institu-
tion in the past 12 months, including about half of account holders in high-income
economies, Sub-Saharan Africa, and East Asia and the Pacic. In developing econo-
mies savings clubs are one common alternative (or complement) to saving at a
MEASURING FINANCIAL INCLUSION
3
formal nancial institution: in Sub-Saharan Africa 19 percent of adults report hav-
ing saved in the past year using a savings club or person outside the family. But a
large share of adults around the world who report having saved or set aside money
in the past 12 months do not report having done so using a formal nancial insti-
tution, informal savings club, or person outside the family. ese adults account
for 29 percent of savers worldwide and more than half of savers in 55 economies.
Analysis of Global Findex data shows that account penetration is higher in econo-
mies with higher national income as measured by GDP per capita, conrming
the ndings of previous studies.
3
But national income explains much less of the
variation in account penetration for low- and lower-middle-income economies.
Indeed, at a given income level and nancial depth, use of nancial services varies
signicantly across economies, suggesting a potentially important role for policy.
Removing physical, bureaucratic, and financial barriers could
expand the use of formal accounts
Poor people juggle complex nancial transactions every day and use sophisticated
techniques to manage their nances, whether they use the formal nancial system
or not.
4
We cannot assume that all those who do not use formal nancial services
are somehow constrained from participating in the formal nancial sector—ac-
cess and use are not the same thing. But the recent success of mobile money in
Sub-Saharan Africa shows that innovations can bring about dramatic changes
in how people engage in nancial transactions. To allow a better understanding
of the potential barriers to wider nancial inclusion, the Global Findex survey
includes novel questions on the reasons for not having a formal account. e
responses can provide insights into where policy makers might begin to make
inroads in expanding the use of formal nancial services.
Worldwide, by far the most common reason for not having a formal account—
cited by 65 percent of adults without an account—is lack of enough money to use
one. is speaks to the fact that having a formal account is not costless in most
parts of the world and may be viewed as unnecessary by a person whose income
stream is small or irregular. Other common reasons reported for not having an
account are that banks or accounts are too expensive (cited by 25 percent of adults
without a formal account) and that banks are too far away (cited by 20 percent).
e self-reported barriers vary signicantly across regions as well as by individual
characteristics. Among adults without a formal account, those in Sub-Saharan
Africa and Latin America and the Caribbean are the most likely to cite missing
documentation as a reason for not having one. ose in Europe and Central Asia
have the least trust in banks. Women tend to report using someone else’s account
signicantly more than do men, highlighting the challenges that women may
encounter in account ownership. Adults who report having saved, but not using
a formal account to do so, are signicantly more likely to cite distance, cost, and
paperwork as barriers to having a formal account.
MEASURING FINANCIAL INCLUSION
4
is systematic evidence on barriers to the use of nancial services allows re-
searchers and policy makers to understand reasons for nonuse and to prioritize
and design policy interventions accordingly. But because at this point the data
are cross-sectional, they cannot be used to determine what impact removing
these self-reported barriers would have. Measuring that impact requires rigor-
ous evaluation and is beyond the scope of this report. Moreover, since people
often face multiple barriers to the use of formal accounts, and the survey allows
multiple responses, addressing individual constraints may not increase the use
of accounts if other barriers are binding.
Nevertheless, a cursory look at these self-reported barriers provides interesting
information. Distance from a bank is a much greater barrier in rural areas, as
expected. Technological and other innovations that help overcome this barrier
of physical distance could pay o—potentially increasing the share of adults us-
ing a formal account by up to 23 percentage points in Sub-Saharan Africa and 14
percentage points in South Asia. Relaxing documentation requirements could also
potentially increase the share of adults with an account by up to 23 percentage
points in Sub-Saharan Africa.
Perhaps even more important than barriers of physical access and eligibility are
barriers of aordability. ese issues seem to be particularly important in Latin
America and the Caribbean, where 40 percent of non-account-holders report that
formal accounts are too expensive. Worldwide, reducing withdrawal charges and
balance fees could make formal accounts more attractive to more than 500 million
adults who are without one. Again, these statements are meant to be indicative,
not causal, and further analysis is required.
Whether in response to these barriers or for other reasons, many people use infor-
mal methods to save money or make payments as an alternative or complement
to formal banking. Informal savings clubs and mobile money are two popular
examples of nancial management tools that can operate outside the formal
nancial sector.
Formal borrowing and insurance are relatively rare
in the developing world
While the share of adults who report having taken out new loans in the past 12
months is surprisingly consistent around the world, the sources and purposes
for these loans are extremely diverse. Globally, 9 percent of adults report having
originated a new loan from a formal nancial institution in the past 12 months—14
percent of adults in high-income economies and 8 percent in developing econo-
mies. In addition, about half of adults in high-income economies report having a
credit card, which might serve as an alternative to short-term loans. In developing
economies only 7 percent report having one. Seven percent of adults around the
world have an outstanding mortgage, a share that rises to 24 percent in high-
income economies. About 11 percent of adults in developing economies report
having an outstanding loan for emergency or health purposes. Less than 20 percent
of those in this group report borrowing only from a formal nancial institution.
MEASURING FINANCIAL INCLUSION
5
Only 17 percent of adults in developing economies report having personally paid
for health insurance, though the share is as low as 2 percent in low-income econo-
mies. Of adults working in farming, forestry, or shing in developing economies,
only 6 percent report having purchased crop, rainfall, or livestock insurance in
the past year.
The Global Findex database fills an important gap
A growing literature examines household nance and especially the borrowing
and savings decisions of households.
5
Using evidence from the FinMark Trust
(FinScope) surveys in 2009 in Kenya, one study shows that savings and credit
services are used mostly for family-related purposes and less for business-related
purposes.
6
is nding is consistent with another study showing that about half the
volume of borrowing by poor households is for nonbusiness purposes, including
consumption.
7
Still another study, conducting eld experiments in Kenya, nds
that people with access to savings accounts or simple informal savings technolo-
gies are more likely to increase productivity and income, increase investment in
preventive health, and reduce vulnerability to illness and other unexpected events.
8
Yet because of the lack of systematic data on household use of nancial services,
empirical literature investigating the links between household access to nance
and development outcomes remains scarce. e Global Findex database extends
this literature by providing cross-country, time-series data on individuals’ use of
nancial services.
ere have been earlier eorts to collect indicators of nancial access from
providers of nancial services (nancial institutions) as well as from the users
(households and individuals). But those collecting individual- and household-
level data have been limited and questions—and the resulting data—often are
not consistent or comparable across economies. e Global Findex indicator on
account penetration lends itself most easily to comparison. While the results are
broadly consistent with those of earlier eorts, the correlation is imperfect and
in a few cases there are nontrivial discrepancies.
ese dierences are likely to stem from three important variations in user-side
data on the use of nancial services. First, the denition of an account varies
across surveys and respondents are often prompted in dierent ways. e Global
Findex survey denes an account as an individual or joint account at a formal
nancial institution (a bank, credit union, cooperative, post oce, or micro-
nance institution) and notes in the question text that an account can be used to
save money, to make or receive payments, or to receive wages and remittances.
It also includes those who report having a debit or ATM card. Other surveys may
list an array of institutions (formal or semiformal) or products (savings account,
checking account, pension scheme, Islamic loan) that are specic to the economy
or region, while still others may simply ask, “do you have a bank account?”
Second, there are important dierences in the unit of measurement across sur-
veys. While the Global Findex account penetration indicator refers to individual
or joint account ownership, many earlier surveys measured account penetration
MEASURING FINANCIAL INCLUSION
6
at the household level, an approach that captures use but not ownership and
tends to result in higher estimates for penetration, especially among youth and
women. In addition, the Global Findex survey includes adults age 15 and above,
while other surveys often use 16 or 18 as an age cuto.
ird, many of the most recent individual- or household-level surveys on nancial
use in a given economy or region were carried out several years ago and may not
reect recent reforms or expansions of nancial access.
Two commonly cited cross-country user-side data collection eorts are the FinMark
Trust’s FinScope initiative, a specialized household survey in 14 African countries
and Pakistan,
9
and the European Bank for Reconstruction and Development’s Life
in Transition Survey (LITS), which covers 35 countries in Europe and Central Asia
and includes several questions on nancial decisions as part of a broader survey.
10
e Global Findex country-level estimates of account penetration are generally
higher than those of the FinScope surveys, perhaps because of the dierence in
timing (most of the FinScope surveys were carried out in the mid-2000s) and the
variation in the denition of an account. e Global Findex country-level estimates
of account penetration are within 7 percentage points of the LITS estimates for
the majority of economies, with discrepancies perhaps explained by the fact that
the LITS nancial access questions focus on households, not individuals, and are
less descriptive than those of the Global Findex survey.
11
On the provider side, Beck, Demirguc-Kunt, and Martinez Peria collected indica-
tors of nancial outreach (such as number of bank branches and ATMs per capita
and per square kilometer as well as the number of loan and deposit accounts per
capita) from 99 country regulators for the rst time in 2004.
12
ese data were
updated and expanded by the Consultative Group to Assist the Poor (CGAP) in
2008 and 2009 and by the International Monetary Fund in 2010. ese data sets
are important sources of basic cross-country indicators developed at a relatively
low cost. Yet indicators based on data collected from nancial service providers
have several important limitations. First, data are collected only from regulated
nancial institutions and thus provide a fragmented view of nancial access.
Second, aggregation can be misleading because of multiple accounts or dormant
accounts. Most important, this approach does not allow disaggregation of nancial
service users by income or other characteristics. at leaves policy makers unable
to identify segments of the population with the lowest use of nancial services,
such as the poor, women, or youth.
e Global Findex database can serve as an important tool for benchmarking
and for motivating policy makers to embrace the nancial inclusion agenda.
By making it possible to identify segments of the population excluded from the
formal nancial sector, the data can help policy makers prioritize reforms accord-
ingly and, as future rounds of the data set become available, track the success of
those reforms. e questionnaire, translated into and executed in 142 languages
to ensure national representation in 148 economies, can be used by local policy
makers to collect additional data. Adding its questions to country-owned eorts
to collect data on nancial inclusion can help build local statistical capacity and
increase the comparability of nancial inclusion indicators across economies
MEASURING FINANCIAL INCLUSION
7
and over time. As future rounds of data collection are completed, the database
will allow researchers to provide empirical evidence linking nancial inclusion
to development outcomes and promote the design of policies rmly based on
empirical evidence.
e complete economy-level database, disaggregated by gender, age, education, income, and
rural or urban residence, is available at Individual-
level data will be published in October 2012.
1. See, for example, King and Levine (1993); Beck, Demirguc-Kunt, and Levine (2007); Beck, Levine,
and Loayza (2000); Demirguc-Kunt and Levine (2009); Klapper, Laeven, and Rajan (2006); and
World Bank (2008a).
2. e Bill & Melinda Gates Foundation funded three triennial rounds of data collection through
the complete questionnaire. In addition, data on two key questions relating to the use of formal
accounts and formal loans will be collected and published annually.
3. For example, Beck, Demirguc-Kunt, and Martinez Peria (2007); and Cull, Demirguc-Kunt, and
Morduch (forthcoming).
4. Collins and others 2009.
5. For a detailed literature review, see World Bank (2008a) and references therein. Campbell (2006)
also provides an overview of the household nance eld.
6. Beck 2009.
7. Johnston and Morduch 2008.
8. Dupas and Robinson 2009, 2011.
9. In addition, the World Bank has designed surveys to assess nancial access in developing econo-
mies including Brazil, Colombia, India, and Mexico.
10. e LITS includes high-income economies in Europe and Central Asia. For additional informa-
tion, see EBRD (2011).
11. See Beck and Brown (2011) for a discussion of the use of banking services in transition econo-
mies using the LITS data set.
12. See Beck, Demirguc-Kunt, and Martinez Peria (2007). In addition, Honohan (2008) and World
Bank (2008a) used these indicators as well as other data to estimate a headline indicator of
access. In a separate exercise Beck, Demirguc-Kunt, and Martinez Peria (2008) documented
cross-country eligibility, aordability, and geographic access barriers by surveying banks.
MEASURING FINANCIAL INCLUSION
8
e Global Findex indicators measure the use of nancial services, which is distinct
from access to nancial services.
Access
most often refers to the supply of services,
while use is determined by demand as well as supply.
1
Use
refers to the levels and
patterns of use of dierent nancial services among dierent groups, such as poor
people, youth, and women.
Indicators
e rst set of indicators focuses on formal accounts; the mechanics of the use of these
accounts ( frequency of use, mode of access); the purpose of these accounts (personal
or business, receipt of payments from work, government, or family); barriers to account
use; and alternatives to formal accounts (mobile money).
e account penetration indicator measures individual or joint ownership of formal
accounts—accounts at a formal nancial institution such as a bank, credit union, co-
operative, post oce, or micronance institution. It includes those who report having a
debit or ATM card tied to an account.
Indicators relating to the receipt of payments measure the use of formal accounts to
receive wages (payments for work or from selling goods), payments or money from the
government, and family remittances (money from family members living elsewhere).
e second set of indicators focuses on savings behavior. is relates to the use of ac-
counts, as people often save at formal nancial institutions. Other indicators explore the
use of community-based savings methods and the prevalence of savings goals.
e third set focuses on sources of borrowing (formal and informal); purposes of bor-
rowing (mortgage, emergency or health purposes, and the like); and use of credit cards.
e fourth focuses on use of insurance products for health care and agriculture. (See the
questionnaire for the survey questions.)
2
Data coverage
e Global Findex indicators are drawn from survey data collected over the 2011 calen-
dar year, covering more than 150,000 adults in 148 economies and representing about
97 percent of the world’s population. e survey was carried out by Gallup, Inc. in as-
sociation with its annual Gallup World Poll, which since 2005 has surveyed about 1,000
people annually in each of up to 157 economies,
3
using randomly selected, nationally
representative samples.
4
e target population is the entire civilian, noninstitutional-
ized population age 15 and above. Surveys are conducted in the major languages of each
economy. (For details on the data collection dates, sample sizes, excluded populations,
and margins of error, see the annex to this methodology section.)
e 148 economies covered by the Global Findex indicators include both high-income
economies and developing (low- and middle-income) economies. e regional and income
group classications are those used by the World Bank, available at ld-
bank.org/about/country-classications. e regions exclude high-income economies.
METHODOLOGY
MEASURING FINANCIAL INCLUSION
9
e regional and worldwide aggregates omit economies for which Gallup excludes more
than 20 percent of the population in the sampling either because of security risks or
because the population includes non-Arab expatriates. ese excluded economies are
Algeria, Bahrain, the Central African Republic, Madagascar, Qatar, Somalia, and the
United Arab Emirates. e Islamic Republic of Iran is also excluded because the data
were collected in that country using a methodology inconsistent with that used for other
economies (the survey was carried out by phone from Turkey). e exclusion of the Islamic
Republic of Iran has a nontrivial eect on regional aggregates because its population is
larger and wealthier than those of other economies in the Middle East and North Africa.
For example, account penetration in the region is estimated to be 18 percent when the
Islamic Republic of Iran is excluded but 33 percent when it is included.
Survey methodology
e survey methodology is that used for the Gallup World Poll. Surveys are conducted
face to face in economies where telephone coverage represents less than 80 percent of
the population.
In most economies the eldwork is completed in two to four weeks. In
economies where face-to-face surveys are conducted, the rst stage of sampling is the
identication of primary sampling units, consisting of clusters of households. e pri-
mary sampling units are stratied by population size, geography, or both, and clustering
is achieved through one or more stages of sampling. Where population information is
available, sample selection is based on probabilities proportional to population size;
otherwise, simple random sampling is used. Random route procedures are used to select
sampled households. Unless an outright refusal occurs, interviewers make up to three at-
tempts to survey the sampled household. If an interview cannot be obtained at the initial
sampled household, a simple substitution method is used. Respondents are randomly
selected within the selected households by means of the Kish grid.
5
In economies where telephone interviewing is employed, random digit dialing or a na-
tionally representative list of phone numbers is used. In selected economies where cell
phone penetration is high, a dual sampling frame is used. Random respondent selection is
achieved by using either the latest birthday or Kish grid method.
6
At least three attempts
are made to reach a person in each household, spread over dierent days and times of day.
Data weighting
Data weighting is used to ensure a nationally representative sample for each economy.
First, base sampling weights are constructed to account for oversamples and household
size. If an oversample has been conducted, the data are weighted to correct the dispro-
portionate sample. Weighting by household size (number of residents age 15 and above)
is used to adjust for the probability of selection, as residents in large households will
have a disproportionately lower probability of being selected for the sample. Second,
poststratication weights are constructed. Population statistics are used to weight the
data by gender, age, and, where reliable data are available, education or socioeconomic
status. Finally, approximate study design eect and margin of error are calculated. e
average country-level margin of error for the account penetration indicator is plus or
minus 3.9 percent.
All regional or income group aggregates are also weighted by country population (age
15 and above).
MEASURING FINANCIAL INCLUSION
10
1. World Bank 2008a.
2. In a few instances surveyors and supervisors reported that respondents were somewhat taken
aback at the series of questions, given the personal nature of the topic. is concern was
particularly relevant in economies with large security risks, such as Mexico and Zimbabwe,
and in economies where personal nances are widely regarded as a private matter, such as
Cameroon, Italy, and Portugal. ere were also reports from the eld that the terminology and
concepts used in the survey were entirely new to some respondents. Although eorts were
made to include simple denitions of such terms as accounts and debit cards, the unfamiliarity
and complexity of the topic were still reported to be a hurdle in several economies, including
Afghanistan, Cambodia, Chad, and rural Ukraine. Overall, however, the rate of “don’t know” or
“refuse” answers was very low. For the core questions (those not ltered by other questions),
“don’t know” or “refuse” responses made up less than 1 percent of the total and no more than
2 percent in any region.
3. e Gallup World Poll has been used in previous academic studies. For example, Deaton (2008)
uses Gallup World Poll questions on life and health satisfaction and looks at the relationships
with national income, age, and life expectancy. Gallup World Poll questions are also used by
Stevenson and Wolfers (2008) and Sacks, Stevenson, and Wolfers (2010) as part of their research
to analyze relationships between subjective well-being and income; by Clausen, Kraay, and Nyiri
(2011) to analyze the relationship between corruption and condence in public institutions;
by Demirguc-Kunt, Klapper, and Zingales (2012) to study changes in trust in banks over the
nancial crisis; and by Stevenson and Wolfers (2011) to examine trust in institutions over the
business cycle.
4. In some economies oversamples are collected in major cities or areas of special interest. In ad-
dition, in some large economies, such as China and the Russian Federation, sample sizes of at
least 4,000 are collected.
5. e Kish grid is a table of numbers used to select the interviewee. First, the interviewer lists
the name, gender, and age of all permanent household members age 15 and above, whether
or not they are present, starting with the oldest and ending with the youngest. Second, the
interviewer nds the column number of the Kish grid that corresponds to the last digit of the
questionnaire number and the row number for the number of eligible household members. e
number in the cell where the column and row intersect is the person selected for the interview.
In economies where cultural restrictions dictate gender matching, respondents are randomly
selected using the Kish grid from among all eligible adults of the interviewer’s gender.
6. In the latest birthday method an interview is attempted with the adult in the household who
had the most recent birthday.
MEASURING FINANCIAL INCLUSION
11
Worldwide, 50 percent of adults report having an account at a formal nancial
institution—a bank, credit union, cooperative, post oce, or micronance insti-
tution.
1
For most people, having such an account serves as an entry point into
the formal nancial sector. A formal account makes it easier to transfer wages,
remittances, and government payments. It can also encourage saving and open
access to credit.
ese benets accrue to account holders around the world. But beyond these
commonalities are many dierences across regions, income groups, and individual
characteristics—in the prevalence of accounts, in potential barriers to their use,
in the purposes of their use. And in the developing world especially, many people
rely on alternatives to formal accounts.
How does account ownership vary around the world?
Not surprisingly, account penetration diers enormously between high-income
and developing economies: while it is nearly universal in high-income economies,
with 89 percent of adults reporting that they have an account at a formal nancial
institution, it is only 41 percent in developing economies. Among regions, the
Middle East and North Africa has the
lowest account penetration, with only
18 percent of adults reporting a formal
account (gure 1.1).
In several economies around the world—
including Cambodia, the Democratic
Republic of Congo, Guinea, the Kyrgyz
Republic, Turkmenistan, and the Re-
public of Yemen—more than 95 percent
of adults do not have an account at a
formal nancial institution (map 1.1).
Globally, more than 2.5 billion adults
do not have a formal account, most of
them in developing economies.
2
What explains the large variations in
account penetration? Why do more than 99 percent of adults in Denmark have
a formal account while virtually none do in Niger? Does account penetration
depend simply on an economy’s income level? Or are there other determining
factors? And if so, what are they?
ACCOUNTS AND PAYMENTS
1.1
FIGURE
Account penetration
Adults with an account at a formal financial institution (%)
89
55
45
39
33
24
18
GLOBAL
AVERAGE
50%
HIGH-INCOME
ECONOMIES
EAST ASIA
& PACIFIC
EUROPE &
CENTRAL ASIA
LATIN
AMERICA &
CARIBBEAN
SOUTH
ASIA
SUB-
SAHARAN
AFRICA
MIDDLE EAST
& NORTH
AFRICA
Source: Demirguc-Kunt and Klapper 2012.
MEASURING FINANCIAL INCLUSION
12
VARIATION BY INCOME
AND INEQUALITY
Without a doubt, national income, prox-
ied by GDP per capita, explains much
of the variation in account penetration
around the world (gure 1.2). Denmark
is among the world’s richest economies
while Niger is among the poorest. Above
a GDP per capita of $15,000, with only a
few exceptions, account penetration is
virtually universal.
3
Indeed, regression
analysis shows that national income
explains about 70 percent of the varia-
tion among the world’s economies in the
share of adults with a formal account.
4
Yet among the bottom 50 percent of
the income distribution in the sample
(economies with a GDP per capita below
$2,200), the relationship between GDP
per capita and account penetration is
much weaker.
1.2
FIGURE
National income explains much of the variation in account
penetration across all economies—but far less among
lower-income ones
Adults with an account at a formal financial institution (%)
GDP per capita
(2000 US$)
20
10,000 20,000 30,000 40,000
40
60
80
100
•
•
•
•
•
•
•
•
•
•
•
•
•
•
•
•
•
•
•
•
•
•
•
•
•
•
•
•
•
•
•
•
•
•
•
•
•
•
•
•
•
•
•
•
•
•
•
•
•
•
•
•
•
•
•
•
•
•
•
•
•
•
•
•
•
•
•
•
•
•
•
•
•
•
•
•
•
•
•
•
•
•
•
•
•
•
•
•
•
•
•
•
•
•
•
•
•
•
•
•
•
•
•
•
•
•
•
•
•
•
•
•
•
•
•
•
•
•
•
•
•
•
•
•
•
•
•
•
•
•
•
•
•
•
•
Note: GDP per capita data are for 2010.
Source: Demirguc-Kunt and Klapper 2012; World Bank, World Development Indicators database.
1.1
MAP
Account penetration around the world
0–15
16–30
31–50
51–80
81
+
No data
Adults with an account at a formal
financial institution (
%
)
IBRD 39220 MARCH 2012
Source: Demirguc-Kunt and Klapper 2012.
MEASURING FINANCIAL INCLUSION
13
Consider Ghana and Benin. Both have a GDP per capita of about $560.
5
But while
29 percent of adults in Ghana report having a formal account, only 10 percent
in Benin do. us even among economies with similar income levels and in the
same region there can be signicant dierences in account penetration.
Indeed, when the analysis is restricted to the bottom 50 percent of economies by
income level, GDP per capita explains only 22 percent of the variation in account
penetration among economies. is suggests that the variation across economies
is not determined solely by national income as proxied by GDP per capita.
At the individual level, household income—both absolute and relative—plays
an important part in explaining the variation in account penetration. e role
of absolute
household income can be assessed by looking at the share of adults
living on less than $2 a day who have a formal account (gure 1.3).
6
Worldwide,
only 23 percent of adults in this income category report having an account at a
formal nancial institution. Economies in South Asia and in East Asia and the
Pacic have been most successful in expanding nancial services to this group.
In these regions about 27 percent of those living on less than $2 a day have an
account. In the Middle East and North Africa only 6 percent do.
Comparing account penetration across within-economy income quintiles sheds
light on the role of relative income (gure 1.4). Account penetration in the
poorest
quintile in high-income economies is 37 percent higher on average than in the
richest
quintile in developing economies. Within developing economies, adults
in the richest income quintile are on average more than twice as likely to have an
account as those in the poorest. While average account penetration in the poorest
quintile varies widely across regions, the average in the richest quintile clusters
around 55 percent—except in East Asia and the Pacic (with the highest, at 76
percent) and the Middle East and North Africa (with the lowest, at 25 percent).
1.3
FIGURE
Account penetration among the poorest
Adults living on less than $2 a day by whether with or without a formal account (as % of all adults)
HIGH-INCOME
ECONOMIES
EUROPE &
CENTRAL ASIA
Below $2 a day
EAST ASIA
& PACIFIC
WITHOUT
ACCOUNT
WITH
ACCOUNT
SUB-SAHARAN
AFRICA
LATIN AMERICA
& CARIBBEAN
SOUTH
ASIA
MIDDLE EAST
& NORTH AFRICA
20
0
40
60
80
100
Source: Demirguc-Kunt and Klapper 2012; Gallup World Poll, 2011.
MEASURING FINANCIAL INCLUSION
14
e dierence in length between the bars
in gure 1.4—that is, the dierence in
account penetration between income
quintiles—is a rough measure of the gap
in nancial inclusion between rich and
poor people within economies. Because
the upper limit is 100 percent, there is
little absolute dierence in length be-
tween the bars for high-income econo-
mies, showing that in these economies
on average, poorer adults are not sig-
nicantly less likely than richer adults
to have a formal account. But there are
stark dierences within some develop-
ing economies. In both Cameroon and
Nigeria about 13 percent of adults in
the poorest quintile have an account.
Yet while only 22 percent of those in
the richest quintile have an account in
Cameroon, 62 percent do in Nigeria.
ere is a strong correlation between
inequality in the use of formal accounts
and general income inequality as mea-
sured by the Gini coecient (with higher
values indicating higher income inequal-
ity). e contrasting situations in two
countries illustrate. In Sweden, which
has one of the lowest Gini coecients
(25), account penetration in the poorest
income quintile is essentially the same
as in the richest (resulting in a value of
close to 1 on the
y
-axis of gure 1.5). In
Paraguay, at the other end of the spectrum
with a Gini coecient of 52, there is a
large gap in account penetration: only 4
percent of adults in the poorest quintile
have a formal account, compared with
51 percent in the richest (resulting in a
value of about 13 on the
y
-axis).
e correlation between these two measures of nancial and economic inequality
(0.42) shows a strong relationship, which holds even when controlling for national
income. But it also suggests that there are factors beyond income inequality that
explain the large variation in the use of formal accounts. Consider the example
of the United Kingdom and the United States (gure 1.6). ese two countries
have relatively similar Gini coecients and relatively similar account penetration
among adults in the top four income quintiles (92 percent in the United States
Account penetration by within-economy
income quintile
Adults with an account
at a formal financial institution (%)
Middle East & North Africa
RICHEST
Q4
Q3
Q2
POOREST
25
7
Sub-Saharan Africa
45
12
South Asia
51
21
Latin America & Caribbean
61
21
Europe & Central Asia
58
32
East Asia & Pacific
76
33
High-income economies
91
85
Source: Demirguc-Kunt and Klapper 2012.
1.4
FIGURE
MEASURING FINANCIAL INCLUSION
15
1.5
FIGURE
A strong correlation between inequality in the use of formal accounts
and inequality in income
Account penetration in the richest quintile as a multiple of that in the poorest
Income inequality
(Gini coefficient)
More equal Less equal
1
7020 30 40 50 60
5
10
15
•
•
•
•
•
•
•
•
•
•
•
•
•
•
•
•
•
•
•
•
•
•
•
•
•
•
••
•
•
•
•
••
•
•
•
•
•
•
•
•
•
•
•
•
•
•
•
•
•
•
•
•
•
•
•
•
•
•
•
•
•
•
•
•
•
•
•
•
•
•
•
•
•
•
•
•
•
•
•
•
•
•
•
•
•
•
•
•
•
•
•
•
•
•
•
•
•
•
•
•
•
•
•
SWEDEN
PARAGUAY
Note: Data on Gini coefficients are for 2009 or the latest available year.
Source: Demirguc-Kunt and Klapper 2012; World Bank, World Development Indicators database.
and 98 percent in the United Kingdom).
But there is a sharp dierence in ac-
count penetration in the poorest income
quintile: in the United States 26 percent
of adults in this group report having
no formal account, while in the United
Kingdom only 3 percent do. A 2009 FDIC
survey found a similarly large gap in
account penetration between rich and
poor households in the United States.
7
A comparison with account penetration
in the poorest quintile in Australia and
Canada—two other countries with Gini
coecients and legal traditions broadly
similar to those of the United States—
adds further support to the suggestion
that factors beyond income inequality
help explain the variation in the use of
formal accounts.
VARIATION BY INDIVIDUAL CHARACTERISTICS
Financial inclusion also diers in important ways by individual characteristics
such as gender, education level, age, and rural or urban residence. ere are
signicant disparities in account penetration along gender lines. In developing
economies 46 percent of men report having an account at a formal nancial insti-
tution, while only 37 percent of women
do. ese shares reect the use of both
individually and jointly owned formal
accounts, as the Global Findex survey
captures the use of an account together
with a family member.
e gender gap is particularly large in
South Asia and the Middle East and North
Africa (gure 1.7). But it is relatively
small in Sub-Saharan Africa, where 27
percent of men and 22 percent of women
report that they have an account.
8
e
gender gap is statistically signicant in
all regions, even when controlling for
education, age, income, and country-
level characteristics.
e gender gap in account penetra-
tion persists across income quintiles.
In developing economies women are
Non-account-holders in the poorest quintile
in selected high-income economies
Adults in the poorest quintile without an account
at a formal financial institution (%)
UNITED
STATES
Gini = 37.8
26
CANADA
Gini = 32.4
9
UNITED
KINGDOM
Gini = 34.5
3
AUSTRALIA
Gini = 33.6
3
WITHOUT
ACCOUNT
Note: Data on Gini coefficients are for the latest available year.
Source: Demirguc-Kunt and Klapper 2012; Organisation for
Economic Co-operation and Development data.
1.6
FIGURE
MEASURING FINANCIAL INCLUSION
16
less likely to have a formal account than men across all income quintiles, with the
dierences in account penetration averaging between 6 and 9 percentage points
(gure 1.8). In high-income economies, however, the average dierence exceeds
4 percentage points only for women in the poorest income quintile.
Education level also helps explain the large variation in the use of formal ac-
counts. In developing economies adults with a tertiary or higher education are
on average more than twice as likely to have an account as those with a primary
education or less (gure 1.9). e dierence is particularly stark in Sub-Saharan
Africa: adults with a tertiary or higher
education are more than four times as
likely to have an account as those with a
primary education or less—though only
3 percent of adults in the region report
having completed tertiary education.
ese gaps underscore the importance of
education, particularly nancial literacy,
in expanding nancial inclusion—an
issue that is receiving growing recog-
nition.
9
Analysis shows that even after
accounting for national income level,
there is a strong relationship between
investment in education (as measured
by spending per student on primary
education) and account penetration.
10
Age is another characteristic that matters
for the likelihood of having an account.
In both high-income and developing
economies those ages 25–64 are more
1.7
FIGURE
Account penetration by gender
Adults with an account at a formal financial institution (%)
87
92
13
23
22
27
25
41
35
44
40
50
52
58
HIGH-INCOME
ECONOMIES
EUROPE &
CENTRAL ASIA
EAST ASIA
& PACIFIC
SUB-SAHARAN
AFRICA
LATIN AMERICA
& CARIBBEAN
SOUTH
ASIA
MIDDLE EAST
& NORTH AFRICA
FEMALE
MALE
47
FEMALE
MALE
55
Source: Demirguc-Kunt and Klapper 2012.
1.8
FIGURE
Account penetration by gender across
within-economy income quintiles
Adults with an account
at a formal financial institution (%)
RICHEST Q2–Q4
Income quintile
POOREST
HIGH-INCOME
ECONOMIES
DEVELOPING
ECONOMIES
MALE
FEMALE
MALE
FEMALE
20
40
60
80
100
Source: Demirguc-Kunt and Klapper 2012.
MEASURING FINANCIAL INCLUSION
17
likely to report having an account at a formal nancial institution than both
younger and older adults (gure 1.10). Among regions, East Asia and the Pacic
has the highest account penetration among young adults (those ages 15–24)
both in absolute terms and relative to those ages 25–64. At the other end of the
spectrum, in 29 economies—including Azerbaijan, Colombia, the Comoros, Italy,
and Jordan—young adults are less than half as likely to have a formal account as
those ages 25–64. Latin America and the Caribbean has higher account penetra-
tion among older adults (those age 65 and above) than any other region.
Age group
is a statistically signicant predictor of having an account when controlling for
gender, income, and country-level characteristics.
1.9
FIGURE
Account penetration by education level
Adults with an account at a formal financial institution (%)
HIGH-INCOME
ECONOMIES
EUROPE &
CENTRAL ASIA
EAST ASIA
& PACIFIC
SUB-SAHARAN
AFRICA
LATIN AMERICA
& CARIBBEAN
SOUTH
ASIA
MIDDLE EAST
& NORTH AFRICA
20
0
40
60
80
100
PRIMARY OR LESS
SECONDARY
TERTIARY OR MORE
Source: Demirguc-Kunt and Klapper 2012.
1.10
FIGURE
Account penetration by age group
Adults with an account at a formal financial institution (%)
HIGH-INCOME
ECONOMIES
EUROPE &
CENTRAL ASIA
EAST ASIA
& PACIFIC
SUB-SAHARAN
AFRICA
LATIN AMERICA
& CARIBBEAN
SOUTH
ASIA
MIDDLE EAST
& NORTH AFRICA
20
0
40
60
80
100
15 –24
AGE
25–64
65+
Source: Demirguc-Kunt and Klapper 2012.
MEASURING FINANCIAL INCLUSION
18
e urban-rural divide also gures prominently in the use of formal accounts in
the developing world (gure 1.11).
11
In all regions adults living in cities are signi-
cantly more likely than those living in rural areas to have a formal account—in
the Middle East and North Africa, more than twice as likely. is relationship
persists even after controlling for income and other individual characteristics.
What are the barriers
to the use of accounts?
Income levels and individual characteristics clearly help explain dierences in the
use of accounts around the world. But what are the conditions in the economy
and in people’s lives that may put up barriers to the use of accounts? Does the
relative supply of credit in an economy—its nancial depth—play a part? What do
people themselves say when asked why they do not have an account? And what
do the answers suggest about the potential for policy interventions to expand
nancial inclusion?
FINANCIAL DEPTH A FACTOR?
Large amounts of credit in a nancial system—both commercial and consumer—
do not always correspond to broad use of nancial services, because the credit
can be concentrated among the largest rms and wealthiest individuals. Indeed,
the use of formal accounts is imperfectly correlated with a common measure of
nancial depth—domestic credit to the private sector as a percentage of GDP—
particularly in the bottom half of the distribution of economies (gure 1.12).
Country examples bear this out. Vietnam has domestic credit to the private sector
amounting to 125 percent of GDP, but only 21 percent of adults in the country
report having a formal account. Conversely, the Czech Republic, with relatively
modest nancial depth (with domestic credit to the private sector at 56 percent
of GDP), has relatively high account penetration (81 percent).
1.11
FIGURE
Account penetration in urban and rural areas
Adults with an account at a formal financial institution (%)
HIGH-INCOME
ECONOMIES
EUROPE &
CENTRAL ASIA
EAST ASIA
& PACIFIC
SUB-SAHARAN
AFRICA
LATIN AMERICA
& CARIBBEAN
SOUTH
ASIA
MIDDLE EAST
& NORTH AFRICA
RURAL
URBAN
19
9
37
31
38
21
35
43
39
53
50
69
88
89
RURAL
44
URBAN
60
Source: Demirguc-Kunt and Klapper 2012.
MEASURING FINANCIAL INCLUSION
19
is suggests that nancial depth and
nancial inclusion are distinct dimen-
sions of nancial development—and
that nancial systems can become deep
without delivering access for all.
12
e
large variation in account penetration
among economies with similar levels
of national income and nancial depth
also suggests that there is likely to be
room for policy interventions to increase
nancial inclusion.
SELF-REPORTED BARRIERS
e Global Findex survey, by asking more
than 70,000 adults without a formal ac-
count why they do not have one, provides
insights into where policy makers might
begin to make inroads in improving
nancial inclusion.
Globally, the most frequently cited reason
for not having a formal account is lack of
enough money to use one (gure 1.13).
is is the response given by 65 percent
of adults without a formal account, with
30 percent citing this as the only reason
(multiple responses were permitted).
13
is segment of the population is less
likely to be bankable.
On average, respondents chose 1.7 re-
sponses, including most commonly the
lack of enough money to use an account
along with a second barrier. e next
most commonly cited reasons for not
having an account are that banks or accounts are too expensive and that another
family member already has one, a response identifying indirect users. Each of
these is cited by about a quarter of adults without an account. e other reasons
reported (in order of importance) are banks being too far away, lack of the neces-
sary documentation, lack of trust in banks, and religious reasons.
Examining these self-reported barriers by region, income group, and individual
characteristics is useful (see indicator table 4). While such analysis cannot sup-
port causal statements about what effect removing these barriers would have,
it can nevertheless help identify potential target groups for expanding the use
of accounts.
1.12
FIGURE
Use of financial services is not completely explained by financial depth
Adults with an account at a formal financial institution (%)
Domestic credit to private sector
(% of GDP)
20
2500 100 15050 200
40
60
80
100
•
•
•
•
•
•
•
•
•
•
•
•
•
•
•
•
•
•
•
•
•
•
•
•
•
•
•
•
•
•
•
•
•
•
•
•
•
•
•
•
•
•
•
•
•
•
•
•
•
•
•
•
•
•
•
•
•
•
•
•
•
•
•
•
•
•
•
•
•
•
•
•
•
•
•
•
•
•
•
•
•
•
•
•
•
•
•
•
•
•
•
•
•
•
•
•
•
•
•
•
•
•
•
•
•
•
•
•
•
•
•
•
•
•
•
•
•
•
•
•
•
•
•
Note: Domestic credit data are for 2010.
Source: Demirguc-Kunt and Klapper 2012; World Bank, World Development Indicators database.
1.13
FIGURE
Self-reported barriers to use of formal accounts
Non-account-holders reporting barrier as a reason for not having an account (%)
5
13
18
20
23
25
30
Religious reasons
Lack of trust
Lack of necessary documentation
Too far away
Family member already has account
Too expensive
Not enough money
Note: Respondents could choose more than one reason. The data for “not enough money” refer to the
percentage of adults who reported only this reason.
Source: Demirguc-Kunt and Klapper 2012.
MEASURING FINANCIAL INCLUSION
20
For example, distance from a bank is a much greater barrier in rural areas, as
expected. Technological and other innovations that help overcome the barrier
of physical distance could potentially increase the share of adults with a formal
account by up to 23 percentage points in Sub-Saharan Africa and 14 percentage
points in South Asia.
14
Among developing economies there is a signicant rela-
tionship (after accounting for GDP per capita) between distance as a self-reported
barrier and objective measures of providers such as bank branch penetration.
Tanzania has a large share of non-account-holders who cite distance as a reason
for not having an account—47 percent—and also ranks near the bottom in bank
branch penetration, averaging less than 0.5 bank branches per thousand square
kilometers.
15
Documentation requirements for opening an account may exclude workers in
the rural or informal sector, who are less likely to have wage slips or formal proof
of domicile. In Sub-Saharan Africa documentation requirements potentially re-
duce the share of adults with an account by up to 23 percentage points. Analysis
shows a signicant relationship between subjective and objective measures of
documentation requirements as a barrier to account use, even after accounting
for GDP per capita (gure 1.14). Indeed, the Financial Action Task Force, recogniz-
ing that overly cautious Anti-Money Laundering and Terrorist Financing (AML/
CFT) safeguards can have the unintended consequence of excluding legitimate
businesses and consumers from the nancial system, has emphasized the
need
to ensure that such safeguards also support nancial inclusion.
16
Aordability is another important barrier. Fixed transactions costs and annual
fees tend to make small transactions unaordable for large parts of the popu-
lation. Maintaining a checking account in Sierra Leone, for example, costs the
equivalent of 27 percent of GDP per capita in annual fees. So it is no surprise that
Objective data support perceptions of documentation requirements and cost as barriers
to use of formal accounts
Non-account-holders
citing lack of documentation as a barrier (%)
Non-account-holders
citing cost as a barrier (%)
Number of documents
required to open a checking account
Annual fees for a checking account
10
12345
20
30
40
50
10
20
30
40
•
•
•
•
•
•
•
•
•
•
•
•
•
•
•
•
•
•
•
•
•
•
•
•
•
•
•
•
•
•
•
•
•
•
•
•
•
NEGLIGIBLE LOW MEDIUM HIGH
Note: Data on number of documents required are for 2005. Data on annual fees are for 2010 and reflect scoring by the national central
bank. The sample for the left-hand panel includes 38 economies, and the sample for the right-hand panel 100 economies.
Source:
Demirguc-Kunt and Klapper 2012; World Bank, Bank Regulation and Supervision Database; World Bank Payment Systems Database.
1.14
FIGURE
MEASURING FINANCIAL INCLUSION
21
44 percent of non-account-holders in that country cite cost as a reason for not
having a formal account. Analysis nds a signicant relationship between cost
as a self-reported barrier and an objective measure of costs.
But xed fees and high costs of opening and maintaining accounts also often
reect lack of competition and underdeveloped physical or institutional infra-
structure. ese issues seem to be particularly important in Sub-Saharan Africa
and Latin America and the Caribbean, where improvements that reduce costs
could potentially increase the share of adults with a formal account by up to 24
percentage points.
17
Lack of trust in banks can be a dicult barrier to overcome. is distrust can stem
from cultural norms, discrimination against certain population groups, past epi-
sodes of government expropriation of banks, or economic crises and uncertainty.
In Europe and Central Asia 31 percent of non-account-holders cite lack of trust
in banks as a reason for not having an account—a share almost three times that
in other regions on average.
18
Religious reasons for not having a formal account are most commonly cited in
the Middle East and North Africa and South Asia. In these regions, developing
nancial products compatible with religious beliefs (Islamic nance) could pay
o—potentially increasing the share of adults with a formal account by up to 10
percentage points in the Middle East and North Africa and by up to 5 percentage
points in South Asia.
Global Findex data suggest that indirect use of an account is most common
in South Asia: 34 percent of adults in the region without a formal account cite
another family member already having one as a reason, compared with a global
average of 23 percent. Women tend to be more likely to be indirect users as well:
in South Asia and the Middle East and North Africa there is a gender gap of about
10 percentage points in citing this reason. A recent study shows that lack of ac-
count ownership (and personal asset accumulation) limits women’s ability to
pursue self-employment opportunities.
19
Such voluntary exclusion may be linked
to individual preferences or cultural norms, or it may indicate a lack of awareness
of nancial products or lack of nancial literacy more generally.
20
How—and how often—are accounts accessed?
Beyond the simple ownership of formal accounts, how frequently people access
those accounts, and the methods they use to do so, mark a stark dierence in
the use of nancial services between high-income and developing economies.
DEPOSITS AND WITHDRAWALS
In developing economies 10 percent of adults with a formal account—more than
150 million people—maintain what can be considered an inactive account: they
make neither withdrawals from nor deposits into their account in a typical month
(although they may keep a positive balance). In high-income economies only 2
percent of account holders have an inactive account.
MEASURING FINANCIAL INCLUSION
22
e majority of adults with a formal account in developing economies make
deposits or withdrawals only one to two times in a typical month (gure 1.15).
ey may access their accounts only to withdraw monthly or semimonthly wages
(deposited by an employer). In high-income economies, by contrast, more than
half withdraw money from their accounts six or more times in a typical month.
ATMs and electronic payment systems (debit cards, electronic bill payments,
and the like) facilitate more frequent access to accounts. Indeed, adults with a
formal account in high-income economies report most commonly using ATMs
for withdrawals. ose in developing economies report most commonly making
withdrawals over the counter in a branch of their bank or nancial institution
(gure 1.16).
In recent years the proliferation of “branchless banking” has received growing
attention as a way to increase nancial access in developing economies, particu-
larly among underserved groups.
21
One mode of branchless banking centers on
bank agents, who often operate out of retail stores, gas stations, or post oces.
By taking advantage of existing infrastructure and client relationships, this way
of operating makes it more cost-ecient to expand nancial access. Bank agents
can also be mobile, making daily or weekly rounds among clients. Few account
holders report relying on bank agents (whether over the counter at a retail store
or from some other person associated with their bank) as their main mode of
withdrawal or deposit. But in several Asian economies—including Bangladesh,
the Lao People’s Democratic Republic, Nepal, and the Philippines—more than
10 percent of account holders already report using bank agents, and this share
is expected to grow globally. Over time the Global Findex data can serve as a
benchmark for studies and policy interventions examining the eect of bank
agents on nancial access.
How account holders access
their accounts
Adults with a formal account by most common
mode of withdrawal used (%)
HIGH-INCOME ECONOMIES
DEVELOPING ECONOMIES
Person associated
with bank
Retail store
Do not withdraw
69
54
23
39
Financial
institution
ATM
Financial
institution
ATM
Source: Demirguc-Kunt and Klapper 2012.
1.16
FIGURE
Frequency of deposits and withdrawals by account holders
Adults with a formal account by number of transactions in a typical month (%)
Note: Because of “don’t know” and “refuse” responses, the categories do not sum to 100 percent.
Source: Demirguc-Kunt and Klapper 2012.
6 or more
Transactions
3–5
1–2
None
DEPOSITS WITHDRAWALS DEPOSITS WITHDRAWALS
DEVELOPING ECONOMIES
HIGH-INCOME ECONOMIES
100%
1.15
FIGURE