COMPARATIVE ADVANTAGE AND GREEN BUSINESS pot
Bạn đang xem bản rút gọn của tài liệu. Xem và tải ngay bản đầy đủ của tài liệu tại đây (921.32 KB, 80 trang )
Comparative advantage and green
business
25 June 2008
URN 08/1036
Ernst & Young i
Ernst & Young LLP
1 More London Place
London SE1 2AF
Tel: 020 7951 2000
Fax: 020 7951 1345
www.ey.com/uk
Mr Brian Titley
Director
Department for Business, Enterprise and Regulatory Reform
1 Victoria Street
London
SW1H 0ET
23 June 2008
Research project for the Department for Business, Enterprise and Regulatory Reform
“Comparative Advantage and Green Business”
Dear Brian
In accordance with the engagement letter dated 5
th
February 2008, we enclose our report in relation
to the analysis of “comparative advantage and green business”. Our report focuses on the evidence
on the potential business opportunities for the UK economy to move to a ‘green’ or low carbon,
resource efficient economy.
Scope of our work
This scope sets out our understanding, based on discussions with you, of your objectives, the issues
that are relevant to those objectives and the work we have agreed to perform. These Services are
based on your Terms of Reference dated 5
th
February 2008.
In undertaking our work we have based our analysis and views on publicly available information,
information provided to us by the Department for Business, Enterprise and Regulatory Reform
(BERR) and our own information sources. The scope of our work has focused on four areas:
1. Definition and characteristics of green businesses – we define what is meant by and propose a
framework of analysis for green business.
2. Assessing the UK comparative advantage – we identify sectors in which the UK has comparative
advantage through analysis of trade data and analysis of foreign direct investment flows.
3. Characteristics of successful green business models – informed by a selected number of case
studies of successful green businesses or clusters/regions, we draw out what are the key success
factors for green business.
4. Policy impact and unintended consequences – through use of the Oxford Economic model, we
illustrate the types of impact on the wider UK economy of different modes of developing green
process and products in different sectors of the economy.
Ernst & Young ii
Purpose of our report and restrictions on its use
The Report has been prepared on the specific instructions of BERR. It is our understanding that BERR
wishes to use the Report to inform the policy discussion about how to assist businesses moving to a
low carbon and resource-efficiency economy. The Report should not be relied upon for any other
purpose.
It is important to recognise that our work is limited to the scope described herein and has been carried
out over a limited period of time, and is based on publicly available industry data, information supplied
by BERR, and Ernst & Young proprietary information. It is possible that the Report, which does not
constitute an audit, may not reveal all those matters which would have been identified by a full scope
report. As a consequence, further and analysis will be required prior to relying on the information in
the Report.
Yours faithfully
Ernst & Young LLP
Ernst & Young iii
Ernst & Young LLP Disclaimer
The Report was prepared solely for the use of the Department for Business, Enterprise and Regulatory
Reform (BERR) and addressed issues specific to them. Accordingly, we may not have addressed
issues of relevance to any other party. Further, the Report was concluded on 20
th
of June, and we
have not undertaken any further work since that time. Material events may therefore have occurred
which will not be reflected in the Report. The analysis has been based on information provided by
BERR and on other publicly available sources.
Whilst we are prepared to provide access to the Report, it is only on the basis that it is acknowledged
and agree that:
1. Ernst & Young LLP (including its partners, employees, agents, subcontractors and employees
of its wholly owned company, Ernst & Young Services Limited) accepts no responsibility and shall
have no liability in contract, tort or otherwise to you or any other third party in relation to the
contents of the Report,
2. any use you make of the Report, is entirely at your own risk,
3. the terms of this disclaimer shall be governed by and construed in accordance with English law
and any dispute regarding these terms shall be subject to the exclusive jurisdiction of the English
courts.
BERR disclaimer
The views expressed within this Report are those of the authors and should not be treated as
Government policy. The authors worked solely on our instructions and for our purposes. The Report
may have not considered issues relevant to third parties. Any such third parties may choose to make
use of the Report or extracts from it entirely at their own risk and neither the authors nor ourselves
shall have any responsibility whatsoever in relation to any such use.
We welcome feedback on the issues raised by this BERR commissioned study and comments should be
sent to:
Ernst & Young i
Executive summary
Climate change is recognised by most governments as a serious global threat that demands
an urgent and collective global response. In response to such a threat, over the next 20
years there will be a shift towards a low-carbon, resource efficient economy and whilst this
will inevitably be costly, there will also be considerable business opportunities and
economic benefits to be gained.
The UK government has taken a lead in responding to the challenge of climate change and
is driving the international debate on the issue, and has recently defined, through the
Energy White Paper and the Climate Change Bill a clear framework to tackle such a
challenge. It is crucial, however, that this is done in the most cost-effective way and that,
in the process, economic growth, competitiveness, and job creation are stimulated. There
is a need therefore to identify the sources of comparative advantage for one country and
the potential business opportunities in a low-carbon or green economy. Comparative
advantage in ‘green business’ (intended as low-carbon, resource efficient business) is
therefore critically important to the UK sustainable development and is highly relevant to
Government’s commitment of ensuring business success in an increasingly competitive
world.
In this context, the Department for Business, Enterprise and Regulatory Reform
commissioned this study to gather evidence on the potential business opportunities for the
UK economy to move to a ‘green’, or low carbon, resource efficient economy, and to inform
the policy discussion about how to assist businesses to make that transition.
There are four key findings from this study:
1. A green economy will be one in which lower carbon and resource efficiency will
permeate all products and services throughout the entire economy, and we propose a wider
definition and measure of green business to include all sectors of the economy;
2. More focus should be given to identify specific opportunities in the key sectors
where the UK currently has comparative advantage, in order to stimulate green products
and services;
3. The key success factors in a ‘green business model’ are entrepreneurship and
innovation which seem to enable the development of green businesses that are likely to be
more sustainable than through direct policy support, seeking to bestow comparative
advantage in green business where no such advantage naturally lies;
4. The impact at a sectoral level is likely to be highly varied, not just in outcome but
also in different types of transmission (from action to outcome). Spillover effects in some
types can be significant, and therefore, under these conditions, our simulations indicate
that while some developments could boost UK GDP others could have a negative impact on
GDP – particularly for some sectors.
Taking each of the four points in turn we summarise how we came to our conclusions:
1. We propose a wider definition and measure of green business to include all sectors
of the economy
The traditional definition of Environmental Goods and Services (EGS) is not sufficiently
broad to assess the opportunity for comparative advantage in green business. Green
business itself is a very loosely defined term, which in our definition in Paper 1 allows
expansion of green business to include businesses in, potentially, all sectors of the
economy. We continue to recognise that some sectors will be able to transition to a green
economy more readily than others, and so define a third set of sectors or businesses which
Executive summary
Ernst & Young ii
are expected to be reactive rather then proactive in their adoption of solutions to shift to a
low carbon economy.
We believe this definition enables businesses to consider how they create value – and
contribute to comparative advantage – through addressing the climate change agenda
directly or by having a greener business than their competitors in historically non-green
sectors. We have proposed a supply-chain benchmarking tool which could be developed
further by government or industry to help organisations assess how green their businesses
are compared to their peers in the UK and internationally.
2. Focus should be given to the sectors where the UK currently has comparative
advantage
Businesses can gain comparative advantage in green business through two possible routes
(depicted in Figure 1 of the main report). Route A stimulates comparative advantage in
sectors and activities currently considered green or where there is an expectation of a
significant green opportunity, but where the UK has little comparative advantage. Route B
stimulates green products and services in areas where the UK already has comparative
advantage.
In assessing Route B, we identify in Paper 2 eight sectors where there is evidence, based
on trade and investment data, that the UK has comparative advantage. These sectors are
then combined with the green business definition presented in paper 1, to identify the key
sectors where the UK currently exhibits comparative advantage and could develop green
business opportunities in specific sub-sectors; software, electronic equipment, business
services, financial services, and machinery equipment.
In addition to the five sectors identified above, other sub-sectors have the potential to
demonstrate comparative advantage. However, further work is required to define clearly
these sub-sectors and their current and potential comparative advantage. We recommend
further, more detailed, sub-sector analysis to identify specific areas of long term
comparative advantage and consider ways in which to enable their more rapid transition to
becoming low carbon, resource efficient green businesses.
Evidence suggests that policy drivers, whilst potentially widening the range of economic
activities and opportunities in specific sectors, do not, on their own, and in the long run,
yield sustainable improvement in comparative advantage, particularly when the full impact
on the whole economy is considered. Therefore, more focus should be given to
understanding the drivers of comparative advantage at a sub-sectoral level, and enabling
businesses to develop green products and services in those sectors at which they excel.
3. The key success factors are entrepreneurship and innovation
Our case studies focused on a number of businesses and economies and how they have
successfully developed comparative advantage in green business. The analysis presented
in Paper 3 suggests that the drivers that spur a company or sector to become green (i.e.,
develop low carbon or resource efficient products) comes from demand side factors, either
through policy measures (particularly regulation) or through a change in consumer
behaviour; more specifically, in many cases, the anticipation of a change in regulation or
consumer behaviour is the key driver for the most successful businesses. However, the key
necessary success factors that enable businesses to successfully respond to such drivers
seem to lie on the supply side, in creating the right conditions for the investment in and
development of low carbon, resource efficient products.
We recognise that the key supply side success factors, such as access to capital, high level
of investment in R&D, and a skilled labour force, are factors that support successful
business in all high tech sectors, not only green or clean tech sectors. This suggests that
policy makers should consider how to best align the demand factors, which can be
influenced through regulation, and supply side factors, which can be influenced through
Executive summary
Ernst & Young iii
business support policies, in order to encourage businesses to adopt such factors in
implementing their green business strategies.
There is also evidence to suggest that while demand and supply side factors act together
and reinforce each other to create specific successful green businesses such as in the
Danish wind sector, in future the twin effects of global competition and adoption of green
products and services beyond first mover markets, may make the support of supply side
factors dominant over the demand side. The recent emergence and dominance of the US
clean technology sector is taken as evidence of this future trend. The position of the UK as
the most attractive location for venture capital investment in clean technology in Europe
also tends to support the argument that a flexible and conducive environment to
investment is a key to develop and support new technologies. Further and more detailed
analysis of the trends and patterns for the particular sub-sectors of the clean technology
market (particularly a comparative analysis of the UK versus the other largest European
countries) might be appropriate to provide a clearer picture of the factors that will become
critical over time in supporting investments in a low carbon economy.
4. The impact at a sectoral level is likely to be highly varied
In order to identify how the development of comparative advantage in green business
might impact the UK economy, Oxford Economics have undertaken analysis using their
proprietary general equilibrium Oxford Energy Industry Model which is presented in Paper
4. Four simulations of how developing green business in sectors where the UK currently
has comparative advantage would impact on the wider UK economy have been developed.
The fours simulations are:
1. On the supply side, a technology innovation yields both a greener and larger economy.
A simulation is made of this occurring in the manufacturing sector;
2. On the supply side, a policy results in a greener but smaller economy. A simulation is
made of this occurring in the renewable energy sector;
3. On the demand side, consumer preference creates the opportunity for a UK industry
to develop a non-price comparative advantage related to greener production. A
simulation is made of this occurring in the chemical sector; and
4. On the demand side, policy creates a new market in an area where the UK already has
a comparative advantage. A simulation is made of this occurring in the carbon trading
markets.
We have used conservative input assumptions in order to assess the impact on the wider
UK economy in a highly controlled and constrained methodology. Even under these
conditions, our simulations indicate that while some developments could boost UK GDP
others could have a negative impact on GDP. Furthermore, the impacts within different
sectors can vary significantly, and spillovers from one sector to another can be
appreciable, particularly for enabling technologies. Further work might be required at a
sectoral level to understand the strength of the various success factors and the relative
relevance of policies for particular sectors.
In reality, input assumptions may turn out to be much stronger, and the transmission
mechanisms likely to be less constrained, occurring in series or sequence. We recommend
that the preliminary analysis undertaken here be extended using all four identified
transmission modes in combination across many or all sectors of the economy, to assess if
the aggregate impact on economic growth may be expected to materialise. We also note
that traditional economic analysis of the type we have undertaken might not reflect the
nature of a significant discontinuity such as climate change. Complimentary approaches
may wish to be considered, such as analysis of how the UK created comparative advantage
from other discontinuities such as the development and expansion of the internet.
Ernst & Young i
Introduction
In his review of the economics of climate change, Sir Nicholas Stern concluded that the
scientific evidence about climate change and the effect of global warming was now
overwhelming. Climate change is a serious global threat that demands an urgent, collective
global response. He was clear that the benefits of effective, early action on climate change
far outweigh the costs and also estimated that the low-carbon energy product market could
be worth over $500 billion per year by 2050
1
. Over the next 20 years there will be a shift
towards a low-carbon, resource efficient economy and whilst this will inevitably be costly,
there will also be considerable business opportunities and economic benefits to be gained.
The terms of reference for this study are to gather evidence on the opportunities for the
UK economy to move to a ‘green’, or low carbon, resource efficient economy, and to inform
the policy discussion about how to assist businesses to make that transition. We present
our work in a series of four papers which analyse the key aspects of the issue as follows:
1. Paper 1: ‘Definition and characteristics of green businesses’. In order to guide
government policy and clearly understand what is being measured and incentivised,
we first define what is meant by green business. A traditional, narrow definition of
‘green’ business has given way in recent years to a much wider range of businesses
claiming ‘green’ to be part of their offering, and this paper explores this recent change
and proposes a framework of analysis for green business which captures that recent
change.
2. Paper 2: ‘Assessing the UK comparative advantage’. We identify sectors in which the
UK has comparative advantage through analysis of trade data and analysis of foreign
direct investment flows. We also undertake an analysis of sub-sectors where the UK
has comparative advantage and identify potential opportunities to build on that
existing comparative advantage to develop green businesses. We find that developing
comparative advantage in a green business where none currently exists seems more
difficult than to exploit green opportunities where comparative advantage already
exists.
3. Paper 3: ‘Characteristics of successful green business models’. Informed by a
selected number of case studies of successful green businesses or clusters/regions,
we draw out what are the key success factors for green business. We identify the
factors which drive companies to adopt green opportunities and provide an overview
of the types of policies which have been introduced elsewhere to help such movement.
4. Paper 4: ‘Policy impact and unintended consequences’. Finally, we determine the
sectors which offer the best opportunities to develop a green business. Through use of
the Oxford Economic model, we illustrate the types of impact on the wider UK
economy of different modes of developing green process and products in different
sectors of the economy.
Our work has been informed by a series of workshops both with BERR and other
government stakeholders such as DEFRA, as well as an industry workshop involving
companies from a wide range of sectors.
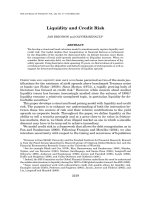
In achieving UK comparative advantage in green business, there are two routes to success,
as shown schematically in the following diagram. Route A stimulates comparative
advantage in sectors and activities currently considered green or where there is an
expectation of a significant green opportunity, but where the UK has little comparative
advantage. Route B stimulates green products and services in areas where the UK already
has comparative advantage. Our study undertakes analysis of both routes. We estimate
where the UK already has comparative advantage and identify opportunities to develop
1 See Stern Report at: -
treasury.gov.uk/independent_reviews/stern_review_economics_climate_change/sternreview_index.cfm
Introduction
Ernst & Young ii
green business in those sectors. We also assess how to create comparative advantage from
green businesses where the UK does not currently have comparative advantage could be
made to have so.
Figure 1: Comparative advantage and green business – routes to success
Source: EY analysis
Low High
UK comparative advantage
Green Business
Chemicals
Pharmaceuticals
Electronic equipment
Aircraft
Financial services
Transportation
technologies
Business servicesIndustrial products
Water
Generation technologies
Alternative fuels
Route A
Route B
The chart illustrates the two different routes towards developing successful comparative
advantage in green business: either through gaining comparative advantage in existing
green business (those sectors high on the y axis) or by developing green products in those
business that already enjoy comparative advantage (those sectors to the right in the x
axis).
2
We avoid attempting to pick winners in this analysis, as by its very nature, innovation is
unpredictable on where and how specific products and services are developed. Instead, we
highlight the sectors where the UK currently has comparative advantage and where it
seems to us that efforts to spur green business would best be directed. We see potential
economic benefit in applying the principles of green business to sectors where the UK
currently has comparative advantage. We have undertaken analysis to identify such sectors
and describe the net economic impacts of the development of potential green processes or
products that these sectors might deliver.
Our analysis is necessarily high level, as it focuses on the sector level which can therefore
miss pockets of comparative advantage in specific sub-sectors. We acknowledge that the
opportunities for developing comparative advantage in green business are not exhaustively
listed here, and real opportunities may lie in areas not identified in this analysis. However,
for the purposes of informing government policy and guiding investment decisions, we
believe the approach adopted here is robust at the macro-economic level.
We also note that this analysis is not directed at addressing how the UK economy can reach
its carbon or environmental targets, but rather the potential opportunities that lie for UK
businesses from shifting to a low carbon and resource efficient economy.
2
The x axis illustrates the degree of comparative advantage for each sector – metric used to approximate this is
the specialisation index (or measure for Revealed Comparative Advantage) explained later in paper 2. The y axis
illustrates the degree of ‘greenness’ of the different sectors – metrics used is explained in paper 1, and include the
energy intensity and carbon intensity of a sector as an example.
Ernst & Young i
Contents
1. Paper 1: Definition and characteristics of green businesses 2
1.1 Executive summary 2
1.2 Introduction 2
1.3 What do we mean by green business? 3
1.4 A framework to assess green business 4
1.5 Transition to a low carbon economy – opportunities for green business 8
1.6 Annex 1 17
2. Paper 2: Assessing the UK comparative advantage 18
2.1 Executive summary 18
2.2 Introduction 18
2.3 Definition of comparative advantage 19
2.4 Revealed comparative advantage 19
2.5 UK’s comparative advantage in goods producing sectors 19
2.6 Investment flows 22
2.7 Comparative advantage and green business 24
2.8 Conclusion 28
2.9 Annex 1 30
2.10 Annex 2 31
2.11 Annex 3 35
3. Paper 3: Characteristics of successful green business models 38
3.1 Executive summary 38
3.2 Case studies 38
3.3 Green business model success factors 38
3.4 Basic requirements – supply side factors 39
3.5 Drivers of green business 40
3.6 The role of early development and involvement in innovative areas 44
3.7 Conclusion 46
3.8 Annex 1 48
4. Economic benefit of supporting development of green business 53
4.1 Executive summary 53
4.2 Introduction 53
4.3 The Oxford Energy Industry Model 55
4.4 Simulation 1: Increased manufacturing R&D yielding “greener” products 57
4.5 Simulation 2: 15% of energy from renewables by 2020 – winners and losers 60
4.6 Simulation 3: Chemicals – shift to greener production processes builds non-price competitive
advantage 64
4.7 Simulation 4 – Financial services, impact of carbon trading 68
4.8 Conclusions 70
1. Paper 1: Definition and characteristics of green businesses
Ernst & Young 2
1. Paper 1: Definition and characteristics of green
businesses
1.1 Executive summary
As the debate around how to address the climate change challenge intensifies, a large
number of companies in all sectors – from supermarkets to car manufacturers – are
beginning to adopt green products and solutions. Many if not most companies are keen to
re-define themselves as ‘green business’. The traditional definition of ‘green business’ as
Environmental Goods and Services (EGS) therefore no longer fully captures the range of
companies and sectors active in what we can call ‘green activities’. This paper proposes a
wider definition of the characteristics of green businesses in order to capture more
comprehensively the dynamics and drivers of green business. We recognise that some
sectors will be able to transition to a ‘green’ economy more readily than others, and so in
our definition we separate those sectors or businesses which are expected to be reactive
from those that are being proactive in implementing green practices.
We believe this definition enables businesses to consider how they create value – and gain
comparative advantage – through addressing the climate change agenda directly and so
developing a ‘greener business’ than their competitors in historically non-green sectors.
We have proposed a supply-chain benchmarking tool which could be developed further by
government or industry to help organisations assess how green their businesses are
compared to their peers in the UK and internationally. We apply our methodology to a
worked example to show how a company active in a non-traditional green sector can be
influenced by demand and supply side factors to become greener compared to a
benchmark level.
The second part of the paper then looks at the specific areas where green business
investment opportunities lie. We take as a proxy for green business opportunities, the
breakdown of venture capitalist investment in the clean technology sector. The UK
emerges as one of the leading countries in Europe in attracting venture capital in clean
technology. The bulk of clean technology investment is currently directed at energy
generation technologies, where the UK is still attracting most investment in Europe.
However, in other sectors such as the emerging clean transport technology, the UK’s lead
is being eroded by other European countries as well as the recent and growing dominance
of the US in the sector.
The analysis, therefore, suggests that venture capital investment, and by extension green
business investment, might not be strongly correlated to strong regulatory support or
subsidy in particular geographies. Green business investment is rather based on the
assessment of rational investment opportunities which will occur wherever there is strong
suitable technological specialisation and a strong innovation and entrepreneurial business
culture – witness the leading role in cleantech investment currently occupied by the US.
1.2 Introduction
‘Green business’ is a relatively recent and not well defined term which can be interpreted in
different ways by different people and organisations. What is considered green by one
organisation may not be by others. Furthermore, the definition of green business is
becoming undermined by a proliferation of green labelling and standards which is leading
some consumers to consider ‘green labels’ to simply be a marketing tool with little
substance behind it.
Nevertheless, the basic premise of a green business as one which is focused on
sustainability, in environmental and resource terms, is well understood by business and
1. Paper 1: Definition and characteristics of green businesses
Ernst & Young 3
consumers alike. While there is a difference in how rigorously that is applied, in practice,
the value of labelling a business as green is clear and cannot be ignored, as numerous
surveys of consumers and business executives show. In particular, business’s decisions to
adopt green practices is not purely altruistic or selfless, rather it is based on good business
sense – in fact, enhanced profits or revenues are expected to accrue from adopting green
business practices.
However, it is important to be able to categorise and measure green business if it is to be
encouraged and promoted. This paper proposes a working definition of green business to
assess, based on a common understanding, the current and future comparative advantage
in green business for the UK economy. We build on existing definitions and broaden these
definitions out to reflect the range of opportunities for green business. We then develop a
framework to assess green business based on the examination of a business’s supply chain.
1.3 What do we mean by green business?
1.3.1 Existing studies
The traditional definition in most studies of environmental markets has focused on the
Environmental Goods and Services (EGS) sector which covers activities ranging from
pollution control to the development of cleaner processes, environmental consultancy and
renewable energy. This definition and related classification of particular sub-sectors (see
box 1 below) has been used in the CEMEP report,
3
and by the UK CEED (Centre for
Economic and Environmental Development).
4
The European Commission in its study of
opportunities for Eco-Industry focused on a very similar list of sub-sectors (see box 2).
5
Box 1
CEMEP and UK CEED classification of environmental markets
The environmental goods and services (EGS) industry is hugely diverse, comprising a number of sub-sectors,
some of which have their roots in some long established sectors, notably in the areas of drinking water supply,
waste water treatment, and solid waste management. The sector has expanded significantly as the need for more
sustainable products and services has grown and now encompasses high growth activities such as environmental
monitoring, renewable energy and clean technologies. Environmental Goods and Services Sub-sectors cover:
► Air pollution control
► Cleaner technologies & processes
► Decommissioning/decontamination of nuclear sites
► Environmental consultancy
► Environmental monitoring, instrumentation and
analysis
► Energy management/efficiency
► Marine pollution control
► Noise and vibration control
► Remediation and reclamation of land
► Renewable energy
► Waste management, recovery and recycling
► Water supply and wastewater treatment
3
Available at
4
Available at
5
Available at
1. Paper 1: Definition and characteristics of green businesses
Ernst & Young 4
Box 2
EU and OECD definition of Eco-industry
As defined by the OECD and Eurostat, eco-industries are “activities which produce goods and services to measure,
prevent, limit, minimise or correct environmental damage to water, air and soil, as well as problems related to
waste, noise and eco-systems. This includes technologies, products and services that reduce environmental risk
and minimise pollution and resources.” The sectors fall into two general categories, pollution management and
resource management.
Pollution management consists of nine eco-industry sectors:
► Solid waste management & recycling
► Wastewater treatment
► Air pollution control
► General public administration
► Private environmental management
► Remediation & clean up of soil & groundwater
► Noise & vibration control
► Environmental research & development
► Environmental monitoring & instrumentation
Resource management includes five eco-industry sectors that take a more preventive approach to managing
material streams from nature to the technosphere:
► Water supply
► Recycled materials
► Renewable energy production
► Nature protection
► Eco-construction
However, as acknowledged in the CEMEP report, “environmental markets are about much
more than just the suppliers of environmental goods and services. There are opportunities
for all business, and environmental markets increasingly pervade the whole economy”. In
fact, the report went on to state that “the transition to a low-carbon, resource-efficiency
economy will see the emergence of new technologies and innovations that will stimulate
new business models, products and services, transform existing sectors of the economy and
create entirely new industries”.
6
The Carbon Trust, for example, in its work considers the entire energy sector and those
products and services that enter the energy supply chain. The Carbon Trust states that it
“supports innovation in the larger ‘ecosystem’ of clean energy products and services, not
only renewable energy generation. Clean energy companies are those operating within the
energy system or supply chain that have the potential to reduce carbon dioxide emissions
and other green house gases. Improvements in each of these energy supply chain phases
can have system-wide impacts that help to reduce carbon emissions, improve their
environmental performance and increase efficiency and productivity for end users”.
7
In the context of this study, therefore, we provide a broader definition of environmental
markets or ‘green businesses’. In discussion with BERR and industry participants, we have
thus defined Green Business as “those business that, across the whole economy, have
made efforts to introduce low-carbon, resource efficient, and/or re-manufactured
products, processes, services and business models, which allow them to operate and
deliver in a significantly more sustainable way than their closest competitors”.
1.4 A framework to assess green business
The purpose of the framework is to identify and codify how businesses incorporate green
principles and practices into their business model.
6
CEMEP report, 2007, page 15.
7
Available at
1. Paper 1: Definition and characteristics of green businesses
Ernst & Young 5
1.4.1 Supply chain focus
Our approach is to look at the entire supply chain of a business and the way decisions about
green inputs, processes, and products have changed it. In this context, we have identified
five key steps in the supply chain: inputs, process, outputs, environmental externalities and
marketing.
8
Within this framework we look at how a business adopts green principles in its
procurement decisions, operational, sale or purchase activities. To be successfully green,
businesses need to not only implement cleaner business practices and, for example, reduce
their carbon footprint, but also have better communications with their customers in order
to establish their brand and capture market share for green products.
The strategy of a firm is therefore based not only on the concept of productivity but also on
the assessment of the life-cycle of products and services. Such fundamental change helps
both improve the process by which a product is developed, therefore enhancing a firm’s
productivity, and change the way a business presents itself to customers, therefore
enhancing the reputation and improving services provided to customers. In figure 2 below
we show the supply chain approach and suggest for each of the five steps two criteria that
can help measure the degree to which a business has adopted green business practices.
Figure 2: Supply chain framework
Renewable sources
Recycled materials
Energy intensity
Resource intensity
Green product
Green services
Green labels
Voluntary standards
Carbon (and GHGs) emissions
Waste
Inputs Process Output Marketing
Environmental externalities
Renewable sources
Recycled materials
Energy intensity
Resource intensity
Green product
Green services
Green labels
Voluntary standards
Carbon (and GHGs) emissions
Waste
Inputs Process Output Marketing
Environmental externalities
1.4.2 Classifying green business
Using this green business typology and applying the necessary subjective judgement
around some of the criteria identified above can lead to the potential scoring and
attribution of different degrees of ‘greenness’ to different businesses. The aim of this
exercise would be to sub-divide all businesses of the economy in three broad classifications
represented by the circles below:
► Circle 1: Firms whose activity is to produce environmental goods and services (the
traditional’ ‘Environmental Goods and Services’ sector)
► Circle 2: Firms which have taken active and identifiable steps to change their products
and/or process to take sustainability agenda into account.
► Circle 3: All other firms which have taken some steps to improve process efficiency or
change their brand image
8
Throughout the rest of this study we will use the term ‘green business’ to capture the broader definition of
environmental markets beyond the narrow limits of the environmental goods and services sector
1. Paper 1: Definition and characteristics of green businesses
Ernst & Young 6
Figure 3: Green business definition
Circle 1
Environmental
Goods
and Services
Circle 2 –‘green businesses’
Circle 3 –firms adopting green solutions
Companies classified
as ‘green according to
criteria in typology
Companies which, though
not classified as green,
have nevertheless taken
some measures to become
more green
1.4.3 Using the framework for scoring green business
For each of the criteria we identify a particular metric
9
. We would then need to identify a
scoring and ranking mechanism that would assign a value of 1 to 5 for each element. The
score will reflect the environmental performance of a company across the lifecycle of
producing its goods and services. This would then be combined together in a final score –
the weighting of the different elements within the supply chain would of course be a key
variable. Finally a benchmark for green business would be identified so that if the score for
a particular company is higher than the benchmark, then the firm would be classified as
green.
The framework for a quantitative assessment of green business would look like the diagram
below:
9
For example for energy intensity, we could use the amount of energy used by a firm in mtoe (million tonnes of
oil equivalent) per year over the annual revenue.
1. Paper 1: Definition and characteristics of green businesses
Ernst & Young 7
Figure 4: Green business framework assessment process
Input Process
Environmental
externalities
Output Marketing
► Renewablessources
► Recycled materials
► Energy intensity
improvement
► Resource intensity
improvement
► Green products
► Green services
► Carbon and HGHs
emissions reduction
► Waste management
► Green labels
► Voluntary standards
Green Business ‘Matrix’
Circle 1 Circle 2 Circle 3
Products
EGS
Score
> X
Score
> X
Green business
We provide a worked example below for a single company, to illustrate how the above
methodology would work in practice. We have chosen to apply the methodology to one of
the worlds’ leading chemical companies, which has been recognised as a leader in its sector
in taking early action with regard to climate change. We have not, as part of this study,
applied the methodology to a complete range of sectors or companies, which would be the
logical next step in the development of this methodology. In fact, it is not within the scope
of this study to provide a detailed collection of all the information and data for the various
components of the supply chain related to particular business or to provide an assessment
of what the green business threshold or benchmark is. We recognise that a significant
amount of work is required to establish a workable set of criteria and benchmarks which
can be applied transparently and fairly in practice.
The proposed framework is comparative, so it would rank particular companies or sectors
against a benchmark to assess its comparative ‘greenness’ using a consistent set of metrics
which are intended to cover the entire range of activities of the company or sector. The
benchmark value for the company or sector can be the industry average, a target set by
regulation, or others as appropriate (in our example we have used official national targets
for the UK as illustrative benchmarks
10
). Its purpose is to determine, on a consistent basis,
whether a company is an outlier (a leader or follower) compared to its competitors. While
a certain degree of subjective judgment will need to be applied at each stage of the
process, we have nevertheless attempted to make the measurement criteria as numerically
based as possible. In this example, which we have based on publicly available sources for
the selected company, the score suggests that this company has ‘green’ characteristics and
can therefore be classified as ‘green business’ according to our previous definition.
10
For example, we used the 2010 renewable target as benchmark for renewables input; the EU energy efficiency
target as benchmark for efficiency; the EU GHG target as benchmark for environmental externalities.
1. Paper 1: Definition and characteristics of green businesses
Ernst & Young 8
Figure 5: Green business supply chain scoring table example – Leading chemical company
Source: Leading chemical company’s accounts and reports, Ernst & Young analysis
Company performance Benchmark
Green
scoring
Input
Renewable sources 5.50% with Target of 10% by 2010 10% of energy input 0.5
Recycled materials n/a 10% of materials
input
0
Process
Energy intensity 47% 20% from 1990
levels
1
Resource intensity Reduced water use and energy use 20% from 1990
levels
0.5
Output
Green product No Yes 0
Green service No Yes 0
Environmental externalities
Carbon and GHGs emissions
reduction
60% 20% from 1990
levels
1
Waste management 52% 20% from 1990
levels
1
Marketing
Green labels Subscribe to Global Reporting
Initiative Format and Carbon
Disclosure Program
1
Voluntary standards Set internal targets for energy use,
carbon emissions, ands renewable
energy use
1
Total 5 6
Note: a score of 1 has been given if the stated target is achieved; 0.5 if the target was not achieved but
considerable effort was made (for example 50% of target); 0 if target was missed or if the company has no
stated target for the area.
1.5 Transition to a low carbon economy – opportunities for green
business
The definition of green business we provided above is not, however, a static one. Over time
certain businesses that in the current economy are not yet perceived as green, can be
expected to become green as they increase their efforts to improve energy efficiency
and/or reduce their carbon emissions. In addition, certain sectors, which have not yet
adopted green practices across the supply chain, may be expected to increasingly do so
over the coming years. On the other hand, sectors which are considered green today may
fall behind whilst others may still offer considerable opportunities for further improving
energy efficiency and reducing carbon emissions. It is, therefore, the potential prospect for
improving resource efficiency or reducing its carbon footprint (both in sectors that would
be classified as green today, but particularly in those that would not be classified as green
today) that offer the greatest opportunities for the development of comparative
advantage in green business.
The CBI Climate Change Task Force in their latest report ‘Climate Change: everyone’s
business’
,
11
highlighted four areas that offer the biggest scope for carbon abatement in the
period to 2030: emissions reduction in buildings (through improvement in residential
buildings); power sector; (through use of low carbon technologies such as wind, CCS and
nuclear); transport technologies (through improvement in engine efficiency and biofuels
use); and industry (through improving manufacturing processes, and using low carbon
sources of energy).
11
Available at
1. Paper 1: Definition and characteristics of green businesses
Ernst & Young 9
► Emissions reduction in the buildings area can be helped by both a change in domestic
energy use but also by the development of new products and services – for example
products or services for the design and building of eco-friendly building.
► Low carbon generation technologies such as renewables, CCS and nuclear can help
reduce emissions from the power sector. Reduction in power sector emissions will be
costly but can yield direct benefits in terms of revenues from tradable permits, and
also indirect benefits in terms of new technology exports (the physical technology and
also the know-how).
► Transport technologies could provide substantial opportunities for emissions
reduction, for example through development of hybrid technologies or biofuels.
► Improvement in the industrial sector will come from the development of new
technologies which will allow lower use of energy and lower emissions – such as
products used in industrial processes for environmental benefit, including building
controls, sensors, components and cleaning products or new materials used in energy
products, including nanotechnology, new alloys, thin film, plastics, or chemicals.
According to ONS data on sectors energy use and carbon emissions, most sectors
have already reduced energy and carbon intensity considerably (manufacturing
emissions are down 15% since 1990 and services emissions are down 4.5%), though
the potential for further reductions is still significant.
The CBI analysis of the abatement cost curve for the UK estimate the potential savings
delivered through these technologies. These measures could deliver around 232mtCO2 by
2030 at a cost of around €40 to €90 per tCO2. This, according to the CBI estimate
translates into an investment of around £100 a year per household by 2030 (or just under
1% of GDP).
The potential for emissions reduction is therefore quite significant and so are the costs to
move to a low carbon economy (Sir Nicholas Stern estimated around 1% of GDP).
However, the investment in green business (or low-carbon, clean technology) will also be
considerable, holding opportunities for business that can develop new, clean solutions and
capture the increasing demand for it – i.e. in our diagram above, those business who can
manage to move from circle 3 to circle 2 ahead of key competitors and therefore gain
increased revenue or profit margin through enhanced reputation, experience or leading
position in the market. In 2006 alone, for example, the carbon market for EU ETS credits
topped €35 billion in terms of trading certificates value,
12
whilst the value of global carbon
trading in 2007 was estimated at $60 billion with expectation to reach $200 billion by
2015.
13
Recent estimates put the total investment into renewable generation technologies
at around $38 billion (in 2005); investment in biofuels similarly is estimated to have
increased to around $38 billion in 2005 from $5 billion in 1995.
14
In some circumstances,
geographical location might dictate where investment in abatement or clean technologies
will occur (some countries might be better place to invest in wind or solar due to weather
condition or in biofuels due to land availability). However, in most cases, the what, where
and when will depend on specific government policies and/or business investment
decisions.
1.5.1 Investment trends in low carbon and clean technology
To assess the dynamics involved in the shift to a low carbon economy, the trends, and
where opportunities in new technologies are likely to develop, we use investment flows
data in clean technology
15
. Whilst recent estimates put the total investment into clean
12
FSA estimate in recent report, “The emissions trading market: risks and challenges”, March 2008
13
EY analysis
14
The Economist, 28/03/2008.
15
In the remaining part of this paper we use the term clean tech as proxy for ‘green’ business. This is to remain
consistent with the definition used in the dataset.
1. Paper 1: Definition and characteristics of green businesses
Ernst & Young 10
technologies at over $45 billion per annum,
16
for our analysis we use a smaller set of the
entire investment capital, in particular that of venture capital investment.
17
We make use
of venture capital data because is more readily available, and because it offers a very good
picture of the size and location of the new clean tech projects at an early stage of
development and therefore provides a good indication of the trend in future investment
opportunities. In fact, whilst most of the investment in clean technology still comes from
corporate investment in large projects, the activity of venture capital market in clean
technology provides an indication of the particular products, technology and businesses
that are expected to generate high growth and returns. Observing venture capital
investment in clean technology can therefore be used as a proxy for determining the type
and location of future ‘green’ opportunities.
We use data from the DowJones Venture One database to present recent venture capital
investment activity in the European and American markets. In this context we define Clean
Tech as “products and services that optimise the use of natural resources or reduce the
negative environmental impact of their use while creating value by lowering costs,
improving efficiency, or providing superior performance.” The type of products and
technologies included in the database and defined as clean tech are grouped in categories
(annex 1 shows full list of products and technologies included in the database):
► Energy generation
► Energy storage
► Treatment and reuse
► Energy efficiency
► Industry focused products and services
Investments in clean technology are growing globally, led by the United States, and to a
lesser extent the EU (figure 6). Total US and EU venture capital investments in clean
technology surged to almost US$3 billion in 2007 with the large majority (over 80%) being
invested in the US. Venture capital investments overall have also been growing rapidly in
recent years and therefore, whilst clean technology is gaining global share among total
venture capital investments, the category still remains relatively small. Nevertheless, the
sector’s share has more than doubled in all regions, led by the US. In 2007, clean tech
accounted for about 5.4% of US venture capital investment, and 4.4% of European venture
capital investment (figure 7).
16
Approximately 103 global clean tech deals raised around $49 billion in 2007 (EY analysis)
17
Venture capital is used as a financial tool for development, particularly for small and medium enterprises
(SME) finance, by facilitating access to finance for small and growing companies. It plays a key role in business
start-ups, and the growth of existing small and medium enterprises.
1. Paper 1: Definition and characteristics of green businesses
Ernst & Young 11
Figure 6: Investment in clean tech (US and EU)
0
500
1000
1500
2000
2500
3000
2001 2002 2003 2004 2005 2006 2007
$ million
US EU
Figure 7: Share of investment in clean tech as a percentage of all venture capital invested
Source: DowJones Venture One
Year US EU
2001 1.40% 1.60%
2002 1.40% 1.50%
2003 1.80% 1.80%
2004 2.50% 2.20%
2005 3.00% 1.80%
2006 3.70% 3.50%
2007 5.40% 4.40%
For the clean technology industry to continue to grow there will need to be more sources of
capital, specifically from large corporate companies. There are signs that the focus for
large corporations has started to shift towards the clean technology with these issues
being on the agendas of many CEOs. According to a survey of senior executives (in
technology industries) conducted by the Economist Intelligence Unit (EIU), about 61% say
that it is very important or important to take measures to reduce or minimise
environmental impact
18
. In a separate survey conducted by McKinsey about 60% of global
corporations’ executives consider climate change issues as important or very important in
setting the overall corporate strategy (53% consider it important when making investment
decisions).
19
This suggests that, as the importance of environmental factors rise, in
particular in policymakers and consumers priorities, other sources of capital are likely to
become available to clean technologies which will allow clean tech companies to sustain
and strengthen their recent growth in activities.
1.5.2 Clean tech Investment in Europe
As of today, the clean tech market is becoming global in nature, matching the global nature
of the climate challenge. North America and Europe will probably remain the primary
providers of innovative technology for the near future, but demand will increasingly come
18
See report “Going green: Sustainable growth strategies*, PWC, 2008
19
See “How companies think about climate change: A McKinsey Global Survey”, McKinsey, 2007
1. Paper 1: Definition and characteristics of green businesses
Ernst & Young 12
from around the globe. It is thus expected that investment in clean technologies will
continue to grow not only in the developed markets but also in the developing markets,
mainly China and India.
The United States has become the largest investor in clean technologies over the past
three years, with investment focused on relatively late-stage, capital investment in global
markets where government intervention is driving demand. The United States’ leading
position is in large part due to the considerably larger amount of funds that the US capital
markets can direct at the sector, but also due to the strength of the high-tech sector, in
terms of knowledge base, entrepreneurial skills, and experience of innovation in new
technologies.
20
On the other hand, until 2004, Europe had traditionally been the vanguard of clean tech,
with more stringent national and European Union environmental regulation and stronger
consumer awareness to green issues. Regulation in particular has been one of the key
drivers of the early development of the clean tech sector in Europe. And the government
role in the development of clean tech industry has not been limited to the setting of
regulation; the market for investment in early-stage of development products is in fact
dominated by government-backed funds. According to a study by Library House and
Carbon Trust, the public sector participates in 45% of all clean tech deals in the United
Kingdom and 15% in the rest of Europe.
21
However, over the past three years Europe has fallen behind the US both in the number of
clean tech deals and the amount of investment in the sector. Nevertheless, and although
Europe hasn’t shown the same growth curve in clean technology investment as the US,
investment in the sector in 2007 has exceeded 2006 levels. Based on the VentureOne
database of projects, in 2007, venture capital investors injected more than US$200 million
into 19 European companies.
Over recent years, investment has been channelled primarily to energy generation
technologies. Data shows that in the EU energy generation technologies have accounted
for around 37% of the invested capital in clean technologies (between 2001 and 2007).
There has been, however, a large rise in investment going into industry focused products
and services. In 2007 capital invested in industry focused products and services increased
by €58 million (250%) to €81.1 million, meaning it accounted for 30% of the total amount
invested during the year. Figure 8 shows the relative proportions of different investment
segments between 2001 and 2007.
20
The experience of the California clean tech boom is an example of the importance of clusters and transferable
experience (from other high tech sectors) – see paper 3 for more details.
21
See “Cleantech goes mainstream”, Library House, 2007
1. Paper 1: Definition and characteristics of green businesses
Ernst & Young 13
Figure 8: European Clean Technology Investment by segment
Source: DowJones Venture One
In the energy generation sector, solar activity has been historically strongest, accounting
for 67% of the €99 million invested in 2007 (see figure 9) - this area was dominated by
German companies due to the attractive regulatory environment aimed at growing the
German solar industry. An analysis of industry focused products and services show that the
investment in different sub-categories has varied considerably in recent years. However in
2006 and 2007 there has been a distinct trend towards investment in transportation. In
the most recent data for 2007, 91% (€74 million) of the total investment in the sector was
involved in transportation clean technology (primarily focused around development of
components for hybrid and electric cars).
Figure 9: European Clean Technology Investment in energy generation
Source: DowJones Venture One
0
20
40
60
80
100
120
2001 2002 2003 2004 2005 2006 2007
Year
Amount invested (€m)
Gasification Hydro Solar Tidal/Wave Wind Other
0
50
100
150
200
250
2001 2002 2003 2004 2005 2006 2007
Alternative Fuels Energy Efficiency
Energy Storage Energy/Electricity Generation
Environment Industry Focused Products and Services
Water
Amount invested (€m)
1. Paper 1: Definition and characteristics of green businesses
Ernst & Young 14
Figure 10: European Clean Technology Investment in industry
Source: DowJones Venture One
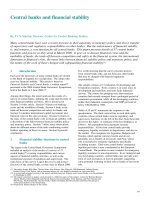
1.5.3 Clean tech investment in the UK
The UK, Germany and France host the largest numbers of clean technology companies in
Europe that are supported by venture capitalists (see figure 11 below). The UK hosts 34
private venture capital backed clean technology companies with a cumulative €186 million
invested in them. Germany follows with 25 companies with €123 million of cumulative
investment. For France, the figures are 12 companies with €30 million invested. The UK
does however seem to be lagging in clean transportation projects and also in clean tech
industrial products.
Figure 11: European Venture capital clean technology Portfolio
0
20
40
60
80
100
120
140
160
180
200
UK France Germany
€million
Energy generation Energy Storage Energy efficiency Industry Treatment and re-use
In the UK, the largest clean tech venture capital market in Europe, the focus has been on
generation and energy storage technologies and alternative fuels. One of the key reasons
0
10
20
30
40
50
60
70
80
90
2001 2002 2003 2004 2005 2006 2007
Industry: Agriculture Industry: Construction Industry: Consumer Products
Industry: Materials Industry: Transportation
Amount invested (€m)
1. Paper 1: Definition and characteristics of green businesses
Ernst & Young 15
of success for the UK has been the strength of its financial sector, which allows easy access
to capital, and the creation of clusters of activity around both key companies’ headquarters
and key scientific centres located in high quality universities.
Figure 12: UK Private clean technology Portfolio (2007)
Source: DowJones Ventureone
Cumulative capital invested (€million)
0 10 20 30 40 50 60
Other alternative energy production
Fuel cells
Solar
Business management services
Water/Fluids
Recycling
Alternative fuels
Waste
Agriculture
Industrial products
Transportation
Consumer products and services
Wind
Air
Construction
In fact, numerous studies have shown that clusters, classically in Silicon Valley, Boston
(USA) or Cambridge (UK), are instrumental in the growth of new industries. The Carbon
Trust in their report, ‘Investment trends in UK clean technology 2000-2004’, identified
mini-clusters around the standard UK technology hotspots, i.e., London, Cambridge,
Oxford, Southampton, Bristol, Cardiff, Chester/Manchester, Newcastle/Middlesbrough,
Aberdeen and Edinburgh. Around 18% of clean tech companies in the UK originate from UK
universities, the largest number coming from Cambridge, Imperial College, and Cardiff.
1.5.4 Conclusion – Future outlook
Based on our framework, we showed that there are opportunities for green business in
many sectors of the economy. The typology we identified can help classify business from
those that are already actively taking action to capture such opportunities to those that
have taken less or little action yet. This does not imply that such business or sectors yield
no opportunities for the development of green products and services. In fact, the analysis
of a particular class of green products, those classified as clean tech, shows that there are
investment opportunities in many sectors which are not traditionally associated with green
products (for example, in construction, materials or industrial products, such as sensors or
cleaning components) Overall though, the analysis show that the majority of investment in
clean tech products is still concentrating in two areas: energy generation and
transportation/fuels – though investments have also gone into products and materials
along the supply chain for energy generation and transportation projects.
Overall, the analysis of venture capital investment points to a rapidly growing market
(more than 30% annual growth), increasingly dominated by investment in the US, which
has rapidly and extensively outstripped Europe in terms of investment available – despite
the different regulatory environment in place (currently more favourable in Europe). It is
1. Paper 1: Definition and characteristics of green businesses
Ernst & Young 16
important to note that difference in the financial market structure is also responsible for
the larger amount of venture capital investment in the US compared to Europe and
therefore the amount of funds available to invest in the general high-risk investment in
small, technology-based firms, which are often passed over by traditional financial
institutions.
22
Nevertheless, venture capital investment in clean tech is increasing in Europe as well, with
electricity generation technologies attracting the bulk of the investment. Alongside the
energy generation sector, the industry products sector, particularly in relation to transport
technologies, is the fastest growing areas. Therefore, in the near future technologies
aimed at producing low-cost sustainable fuels will continue to attract investment. Similarly
investment in alternative generation technology, including wind and wave power, will
continue to grow.
Based on the current pattern of clean tech investment in the UK, it seems that the UK could
be well placed to take advantage of such opportunities, as it has attracted the most of such
venture capital investment amongst EU countries in the past five years (see UK share in
table below). In 2007 alone, the UK attracted about 30% of all European Clean Tech
investment. The areas that are most likely to receive attention are alternative electricity
generation technologies, including wind but particularly wave and tidal power, and energy
storage technologies such as fuel cells.
Finally, the analysis of venture capital investment suggests that green business investment
might not be strongly correlated to strong regulatory support or subsidy in particular
geographies. Green business investment is rather based on the assessment of rational
investment opportunities which will occur wherever there is strong suitable technological
specialisation and a strong innovation and entrepreneurial business culture.
Figure 13: European Venture capital investment in clean tech product (2001-2007)
Capital invested (€m) UK Share (%) Trend (growth over
2005-2007)
Electricity generation 390 19.2% 49.9%
Energy efficiency 44 18.3% 50.1%
Energy storage 147 24.4% 12.1%
Transportation 178 18.5% 278.2%
Industrial products 62 16.1% 39.8%
Recycling 170 10.7% 20.2%
Water 50 11.9% 30.2%
Total investment 1044 17.8% 42%
22
In fact, among the OECD countries, the venture capital industry is most well-established in the United States,
where it is oriented to technology-based sectors and consists of a range of investors, including pension funds,
insurance companies and private individuals. In the more highly regulated European market, the venture capital
industry is younger, oriented to mainstream rather than high-risk sectors and dominated by banks. The creation of
secondary or over-the-counter stock markets for small, growing companies is also important to the supply of
venture capital. See Regulatory Reform And Innovation, OECD paper