LCRA FY 2013 Business and Capital Plans pdf
Bạn đang xem bản rút gọn của tài liệu. Xem và tải ngay bản đầy đủ của tài liệu tại đây (2.04 MB, 66 trang )
LCRA FY 2013 Business
and Capital Plans
LCRA Board of Directors
Timothy Timmerman, Chair
Rebecca A. Klein, Vice Chair
Kathleen Hartnett White, Secretary
J. Scott Arbuckle
Steve K. Balas
Lori A. Berger
John C. Dickerson III
John M. Franklin
Raymond A. “Ray” Gill Jr.
Jett J. Johnson
Sandra Wright Kibby
omas Michael Martine
Michael G. McHenry
Vernon E. “Buddy” Schrader
Franklin Scott Spears, Jr.
e Board of Directors is composed of 15 members appointed by the governor. Directors
represent counties in the electric and water service areas. e directors meet regularly to
set strategic corporate direction for the general manager and sta, to approve projects
and large expenditures, and to review progress on major activities and industry issues.
General Manager
Becky Motal
General Counsel
John W. Rubottom
General Auditor
W. Charles Johnson, Jr.
Chief Financial Ocer
W. Brady Edwards
Treasurer
James Travis
LCRA FY 2013 Business Plan Contents
Table of Contents
LCRA FY 2013 Business Plan Addresses Unique Challenges and Opportunities 1
A New Structure and a New Approach 1
Challenges Ahead 1
Key Facets of LCRA Operations 2
Recent Events Affecting LCRA 3
LCRA Strategic Goals FY 2013 – 2017 5
Strategic Goal 1: Water Supply 5
Strategic Goal 2: Cost Management 5
Consolidated Look at Revenues and Expenses 6
Generation 8
Transmission 10
Raw Water 13
Water and Wastewater Utilities 15
Enterprise Costs 16
Cost Drivers 17
Compensation and Benefits 17
Fuel 17
Debt Service 17
Public Service Fund 18
Public Service Fund Activities 19
Departmental Analysis 20
This Business Plan presents a long-term vision for LCRA and affiliates and a summary of their operational plans.
The Business Plan should not be used as a basis for making a financial decision with regard to LCRA or any of its securities or other
obligations. This Business Plan is intended to satisfy the official intent requirements set forth in Section 1.150-2 of the Treasury
Regulations. For more complete information on LCRA and its obligations, please refer to LCRA’s annual financial report, the official
statements relating to LCRA’s bonds, and the annual and material event disclosures filed by LCRA with the nationally recognized
municipal securities information repositories and the State Information Depository pursuant to Rule 15c2-12 of the Securities and Exchange
Commission. The information in this report and each of the documents referred to speaks only as of its date. The Business Plan includes
forecasts based on current assumptions that are used for planning purposes only and are subject to change. Copies of the documents referred
to above or elsewhere in this report may be obtained from James Travis, Treasurer, LCRA, 3700 Lake Austin Boulevard, Austin, Texas
78703.
LCRA FY 2013 Business Plan Mission
LCRA Mission
The Lower Colorado River Authority provides reliable, cost-effective electric, water and other
public services of value and is a responsible steward of the river and the basin’s natural resources.
LCRA Vision
We will manage the river and lakes to provide a safe and reliable water supply for the lower
Colorado River basin.
We will provide reliable energy and other public services to our customers and our region.
We will manage our lands and the river to preserve the resources of which we are stewards.
We will provide the services in a cost-effective manner, using sound business practices, and in
collaboration with our customers and communities to enhance the economic health and well-being
of our region.
Foundation Values
LCRA’s work and culture are shaped by five foundation values that serve as guiding principles for
how we conduct our business:
Safety: Safety always comes first at LCRA. We develop and improve processes to promote the
safety of all employees and all others affected by our operations.
Customer Service: We listen and respond to external and internal customers, business partners
and the communities we serve, seeking to understand and consider their needs and interests in
conducting our business.
Employee Focus: We attract, engage and retain quality employees by providing opportunities for
professional and personal development and by offering competitive compensation and benefits.
Diversity: We provide a diverse workplace in which all employees and business partners are
respected and valued as we work together to accomplish our mission and goals and continually
improve our business.
Environmental Leadership: LCRA seeks to lead by example in protecting the Colorado River
basin’s natural resources.
LCRA FY 2013 Business Plan Page 1
LCRA FY 2013 Business Plan
Addresses Unique Challenges and Opportunities
LCRA’s FY 2013 Business Plan represents a new
direction for LCRA. This plan is a step toward addressing
several challenges that lay ahead in the next few years:
Extreme drought (sometimes exceeding the intensity
of historic droughts) and the growing demands of our
region have pointed to the need for LCRA to
consider additional water supplies.
LCRA could lose as much as half of its current
electric load by FY 2017, due to the departure of
some wholesale customers as well as contract options
that allow the remaining customers to place a portion
of their load with other utilities.
Retail electric providers are under pressure to keep
rates as low as possible. LCRA must likewise lower
its costs and keep its wholesale generation rates flat
for the next few years.
The outcome of these challenges will strongly influence
the kind of organization LCRA will be in FY 2017. While
formidable, we believe those challenges will be met
through the achievement of our strategic goals of
increasing our water supply by 100,000 acre-feet, and
keeping our nonfuel generation rates flat. (See “LCRA’s
Strategic Goals: FY 2013-2017” on page 5.)
Meeting these goals is the focus on this Business Plan.
A New Structure and a New Approach
The FY 2013 Business Plan reflects the new management
structure and approach implemented by General Manager
Becky Motal to make LCRA more flexible and proactive
in decision-making and running its operations.
One of the more significant results of these changes is the
commitment to “rate-based” budgeting, which is reflected
in this plan. Using this approach, revenues available under
specific rate assumptions are known and the organization
will prioritize expenditures accordingly. This directly
supports LCRA’s strategic goal of keeping its nonfuel
generation rate flat through FY 2017. Under this approach
firm raw water rates are assumed to remain flat while
LCRA analyzes ways to pay for the addition of new water
supplies. Transmission Services is also managing costs
and projected rate increases resulting from its ongoing
capital expansion projects.
To support these rate goals, LCRA’s reporting structure
has been reorganized by consolidating similar processes
and positions that were isolated under the old structure.
These and other realignments have eliminated processes
and positions that were redundant, consolidated debt-
service costs for similar business processes, and created
opportunities for synergy among different operations that
serve our same customers. That, in turn, has enabled
managers to achieve cost efficiencies that are required by
the budgeting approach reflected in this plan.
Challenges Ahead
The FY 2013 Business Plan lays the groundwork for
meeting these long-term challenges:
This plan reflects an organization that is structured to
deliver immediate cost savings and, over the long
term, provide greater flexibility in limiting or
offsetting potential cost increases. This strategy will
help us reach our goal in keeping LCRA’s nonfuel
rates flat.
Nearly everybody agrees that our basin needs
additional water supplies. Options for the additional
water include, building off-channel reservoirs to store
Colorado River floodwaters, groundwater, aquifer
storage and desalination. The challenge will be
providing that supply at a cost-effective price.
These challenges are not simple, but they are achievable.
In perspective, they are no more daunting than LCRA’s
original challenges of building the chain of Highland
Lakes dams and establishing a public-power generation
and transmission network. LCRA met those challenges
and created a water and electric infrastructure that has
served the region well for more than 70 years.
This Business Plan will carry forward that success and
reaffirm LCRA’s reputation as a valued partner to the
people we serve.
Page 2 LCRA FY 2013 Business Plan
Key Facets of LCRA Operations
LCRA is governed by a 15-member Board of
Directors appointed by the governor and
confirmed by the Texas Senate. LCRA is
accountable to its customers and a number of
stakeholders, including the Texas Legislature that
created it. The Board chair is selected by the
governor and communicates regularly with state
policymakers and stakeholders. LCRA’s energy,
water and public services activities fall under a
variety of state, federal and local regulatory
authorities. As a public entity, LCRA conducts its
business and sets policies in open meetings and is
subject to public information laws.
LCRA is a wholesale provider of electricity and
raw water, with a focus on providing these services
reliably and at the most economical cost possible, as
well as planning for long-term power generation,
transmission and water-supply needs. LCRA also has
responsibilities to provide certain public services as
spelled out in its enabling legislation.
LCRA neither collects nor receives taxes but must
operate on the rates and fees it charges for its
services. Most of LCRA’s revenues come from its
electric generation and transmission operations.
A small portion of LCRA’s electric and water
revenues helps fund its public service activities.
This enables LCRA to carry out these services that
have been authorized or mandated in LCRA’s
enabling legislation. These services include economic
and community development, parks and recreation,
land conservation and public safety on waters and
lands managed by LCRA; they do not generate
enough revenues to cover their costs. Because LCRA
has no taxing authority and does not receive state
appropriations, it uses a small portion of its electric
and water revenues to pay for these services. LCRA’s
enabling statute and related laws allow LCRA to fund
these activities in this manner.
Two LCRA-related organizations pay taxes. While
LCRA, as a political subdivision of the state, is
exempt from paying state and local taxes, its energy
affiliate and nonprofit transmission corporation pay
state and local sales and property taxes. GenTex
Power Corporation, which owns the Lost Pines 1
Power Project in Bastrop County, and LCRA
Transmission Services Corporation, which owns and
develops all LCRA-related transmission operations
and infrastructure, through December 2011 have paid
more than $137 million in state and local sales and
property taxes since inception.
LCRA Transmission Services Corporation works
with other transmission providers, distribution
providers and electric generators to provide
reliable and cost-effective electric transmission
services in Central Texas and throughout the Electric
Reliability Council of Texas (ERCOT) region.
LCRA FY 2013 Business Plan Page 3
Recent Events Affecting LCRA
Here is a summary of recent major events that will play a
role in LCRA’s operations and the development of the FY
2013 Business Plan:
Wholesale Power Agreements: As of July 2011, 33
of LCRA’s 43 wholesale electric customers had
extended their wholesale power agreements though
June 2041. These customers represent about 64
percent of LCRA’s total energy sales. LCRA will
continue to serve the remaining 10 customers through
their existing agreements that will terminate in 2016.
The Drought: Calendar year 2011 was the driest
year and second hottest year on record for Texas,
according to the National Weather Service. That year
saw record low inflows into the Highland Lakes. By
the end of the year, combined storage in lakes Travis
and Buchanan, LCRA’s water-supply reservoirs, had
dropped to 37 percent. Rains in early 2012 provided
much needed water and raised the combined storage
to 49 percent; but as of late March, much of the lower
Colorado River basin remained in moderate or severe
drought conditions, according to the U.S. Drought
Monitor.
Water Curtailments: Most coastal farmers will not
receive supplies of “interruptible” water for irrigation
this year, the result of a state-approved emergency
drought relief order, which amends LCRA’s Water
Management Plan. Under the order, LCRA halted
such shipments to most farmers because combined
storage in lakes Travis and Buchanan was below
850,000 acre-feet on March 1. (The highest amount
in the two lakes that day was 847, 324 acre-feet.) The
emergency relief was sought after LCRA staff
collaborated with stakeholders representing LCRA’s
water customers, lake and environmental interests.
Curtailments to LCRA’s firm water customers are
possible if dry condition return and LCRA’s
combined storage from lakes Travis and Buchanan
drop below 600,000 acre-feet. Contingencies include
pro rata curtailments to its firm water customers in
accordance with LCRA’s state-approved Water
Management Plan.
Water Resource Management and Planning:
In February 2012 LCRA’s Board of Directors
approved a revised Water Management Plan that will
provide LCRA greater flexibility in managing the
water supply in lakes Travis and Buchanan,
especially during drought conditions. The revision,
which was developed by LCRA staff with input from
a stakeholder advisory committee, awaits approval by
the Texas Commission on Environmental Quality.
The Board also unanimously approved a resolution to
increase LCRA’s water supply by at least 100,000
acre-feet within five years, supporting a key LCRA
strategic goal (See “LCRA Strategic Goals: FY 2013-
2017,” page 5).
Water and Wastewater Utility Divestitures: As of
April 2012, LCRA had reached agreements to sell 29
of its 32 water and wastewater utilities, carrying out a
November 2010 directive from the LCRA Board of
Directors. Corix Infrastructure Inc., which operates
more than 220 water and wastewater systems in
North America, had agreed to purchase 20 of the
utilities, while local customers and communities had
agreed to purchase nine utilities. On March 19,
LCRA transferred operations of the West Travis
County Regional Water and Wastewater systems to
the West Travis County Public Utility Agency. All
of the buyers satisfied criteria set by LCRA of being
able to (1) provide reliable, quality utility services;
(2) invest capital for additional necessary water and
wastewater utility infrastructure; (3) meet applicable
regulatory requirements; and (4) compensate LCRA
for its investments in the systems.
Transmission Rate Case Settlement:
LCRA Transmission Services Corporation (LCRA
TSC) officially settled its rate case in March 2012 by
unanimous consent of the Public Utility Commission
of Texas. The settlement enabled LCRA TSC to
recover much of the $306 million in expenses that
had been requested in the November 2011 filing and
also enabled LCRA TSC to implement the new rates
two months earlier than originally anticipated.
This will provide LCRA TSC with adequate and
effective cost recovery and financial performance and
is consistent with established long-term rate goals.
Voluntary Employee Severance Program:
In November 2011, LCRA offered voluntary
severance packages to employees. Roughly 130
employees accepted the offer, reducing LCRA’s head
count and lowering related labor costs by an
estimated $20 million for FY 2013.
LCRA Reorganization: During FY 2012 LCRA
reorganized into nine executive departments from
five distinct business units. This organizational
change was made to eliminate redundancies, and
Page 4 LCRA FY 2013 Business Plan
increase LCRA’s efficiency in serving its customers.
Resulting key changes include:
o Hydroelectric activity is now part of LCRA’s
operations department and is managed as part
of LCRA’s generation portfolio. As a result,
hydroelectric activities are no longer accounted
for as an intracompany transaction but remain a
component of the wholesale electric generation
rate.
o Raw water activities now directly include
irrigation operations. This change is driven by
the fact that these irrigation assets were
acquired in most cases largely for their
associated water rights which provide a long-
term benefit for all users within the basin. Raw
water rates are developed to charge wholesale
water customers for either noninterruptible or
interruptible water supply. Transportation rates
are charged to interruptible water supply
customers and some firm customers who
receive delivery through LCRA’s canals.
o Shared support activities and associated
expenditures are no longer identified as
“corporate” but are now included in several of
the newly formed departments. Additionally,
support functions that were spread throughout
the organization have been directly assigned to
a specific department. This approach has
eliminated redundant support costs and
increased effectiveness of those activities.
LCRA FY 2013 Business Plan Page 5
LCRA Strategic Goals FY 2013 – 2017
Strategic Goal 1: Water Supply
Develop and begin implementation of projects by the
end of fiscal year 2017 to secure 100,000 acre-feet of
additional firm water supply.
The additional water would supplement what LCRA
draws from lakes Travis and Buchanan, its major supply
reservoirs, and its other water rights, to meet growing
demands from customers and other stakeholders
throughout the lower Colorado River basin, especially
during drought periods.
Strategies include:
Build new storage capacity.
Develop strategies for conjunctive use of
groundwater and surface water supplies.
Develop aggressive conservation strategies.
Evaluate desalination and other new technologies.
Develop new water funding strategies.
Develop priorities for new supplies.
Goal Achievement:
Making funding available for additional water supply
project(s) is a primary focus in FY 2013. This plan
provides that initial funding through two different
sources, Raw Water revenues and LCRA’s Infrastructure
Reserve. Under assumptions in this plan, $8.7 million has
been identified in FY 2013 as available for funding for the
evaluation and implementation of new water supplies.
Raw Water revenues represent $2 million of this amount
(see page 14) and will be deferred until the revenues are
used. The remaining $6.7 million originates from
contributions to the Infrastructure Reserve by the LCRA
Public Service Fund (see page 18). As presented in this
plan, these annual sources can support the estimated debt
service on a $125 -$150 million capital project. These
capital expenditures will serve as the initial step in
meeting this goal.
Strategic Goal 2: Cost Management
Manage LCRA's costs to achieve a nonfuel wholesale
electric rate that is at the FY 2012 level through FY
2017.
Managing its costs and maintaining a flat nonfuel electric
rate will enable LCRA to provide electricity at
competitive prices and demonstrate to current and
potential customers that it offers valued, cost-effective
services.
Strategies include:
Optimize plant operations (construction and
maintenance) to provide maximum long-term value
to LCRA's customers.
Determine which LCRA programs and services can
be eliminated or outsourced.
Streamline and standardize processes, reporting and
systems across LCRA for most efficient and
consistent operations.
Assess LCRA's capital program for affordability and
rate impact.
Continue ongoing assessment of staffing needs and
take appropriate action.
Goal Achievement:
The FY 2013 budget and its inherent assumptions
establish the foundation for achievement of this long-term
goal. Current cost reductions and ongoing evaluation of
operational activity across the organization have produced
the opportunity to reduce electric nonfuel rates for the
upcoming fiscal year when compared to the nonfuel rates
that had been previously forecast for FY 2013.
Additionally, it provides LCRA the opportunity to take
prudent actions to ensure the long-term financial health of
the organization.
Page 6 LCRA FY 2013 Business Plan
Consolidated Look at Revenues and Expenses
LCRA and Affiliates Consolidated Financials
(Dollars in Millions) Budgeted Proposed
FY 2012 FY 2013 FY 2014 FY 2015 FY 2016 FY 2017
Revenues
1
Generation $ 858.1 827.0 883.0 924.5 972.7 691.7
Transmission 290.9 325.0 349.7 378.8 384.6 390.4
Water 103.4 40.4 43.4 38.5 43.3 39.6
Other 8.2 8.9 8.8 9.0 9.1 9.3
Less Intracompany Eliminations (34.3) (6.9) (6.9) (6.9) (6.9) (6.9)
Sub-Total Net Revenue 1,226.4 1,194.4 1,278.1 1,343.9 1,402.8 1,124.1
Revenues Deferred for Debt Paydown 0.0 24.2 18.4 15.6 11.6 6.0
Total Net Revenue 1,226.4 1,218.6 1,296.5 1,359.6 1,414.5 1,130.3
Expenses
1
Fuel and Power Cost Recovery (F&PCR) 492.6 468.5 509.3 539.0 573.8 372.5
Operations and Maintenance 296.7 281.0 297.4 314.7 324.0 314.6
Total Net Expense 789.2 749.4 806.7 853.7 897.9 687.1
Net Available for Debt Service 437.2 469.2 489.8 505.9 516.6 443.2
Coverage Adjustments
2
3.3 24.9 19.9 16.0 12.0 6.2
Adjusted Net Revenues Available 433.8 444.3 469.9 490.0 504.6 437.1
Debt Service 321.1 326.8 345.5 356.7 365.6 306.8
Debt Service Coverage, Adjusted 1.35x 1.36x 1.36x 1.37x 1.38x 1.42x
Net Revenues After Debt Service
3
116.1 118.2 125.9 133.7 139.5 130.4
Less:
Operating Reserves 11.1 11.5 26.3 18.2 11.3 1.6
Infrastructure Reserve 4.5 6.7 5.8 9.0 9.1 10.0
Revenue Funded Capital 94.5 97.1 90.6 104.1 108.9 100.2
Noncash Revenues 2.9 3.1 3.2 3.3 3.4 3.6
Restricted for Capital/Debt Retirement 0.6 1.2 2.1 2.1 10.7 19.6
GenTex Price Stabilization Reserve Fund 1.5 0.0 0.0 0.0 0.0 0.0
PSF Activities Net Proceeds and Grants 1.0 1.0 1.0 1.0 1.0 1.0
Water/Wastewater Divestiture Funding 0.5 0.0 0.0 0.0 0.0 0.0
Plus:
Amortization of Enterprise/Minor Capital
4
0.5 2.4 3.1 4.2 5.0 5.6
Net Cash Flow 0.0 0.0 0.0 0.0 0.0 0.0
Capital Expenditures
Revenue Funded 94.5 97.1 90.6 104.1 108.9 100.2
Debt Funded 484.8 488.8 166.4 61.9 10.1 8.3
Third Party / Proceeds Funded 5.3 15.9 0.4 5.4 5.4 0.0
Total Capital $ 584.6 601.8 257.4 171.4 124.4 108.5
1
Total Net Revenues and Total Net Expenses are net of intracompany transfers. Total Revenues include interest income. Operations and
maintenance expense excludes the TSC Capital Charge, which is a capital expense for LCRA consolidated.
2
Includes adjustments related to GenTex 1 Capital Funding and Reserve Funding as w ell as deferred revenue for Generation and Water.
3
GenTex 1 Capital Funding and Reserve Funding are available after debt service and used for that purpose.
4
In FY 2012, Transmission Services began funding minor capital and its share of Enterprise Capital with current year revenues, but w ill
include an amortization of the amount in each year to recover in rates.
Forecast
LCRA FY 2013 Business Plan Page 7
Key Points
Total LCRA Revenue decreases from the FY 2012
budget. Fuel revenues decrease by $24.1 million (4.9
percent), and nonfuel revenues increase by $16.3
million (2.2 percent), Nonfuel revenues reflect the
addition of deferred revenues for Generation and
Water, increased debt service of $5.7 million, offset by
the divestiture of water and wastewater utility systems,
curtailment of interruptible customers, and reductions
in operations and maintenance expense.
Total expense decreases by $39.8 million (5 percent),
due to a reduction in fuel expense of $24.1 million (4.9
percent) and $15.7 million (5.3 percent) in reductions to
nonfuel Operations and Maintenance expense
achieved mainly through labor cost reductions.
Debt service coverage, a widely used measure of
financial performance, is forecast to be 1.36x in FY
2013 and increasing to 1.42x in FY 2017.
Net Revenues After Debt Service are projected to be
$118.2 million. Of this, $11.5 million is for liquidity
reserves, which are used to pay expenses if revenues
are interrupted.
Capital Project Expenditures are funded by two major
sources – Current Revenues ($97.1 million) and
Borrowed Funds ($488.8 million) – to pay for projects
that will last decades. Another $15.9 million is capital
projected to be funded by reserves from previous
years or entities other than LCRA.
The chart on the left summarizes the sources of LCRA’s
total projected revenues for FY 2013 and how they will be
used during the fiscal year. The total sources include
Total Net Revenue plus the Amortization of
Enterprise/Minor Capital for LCRA Transmission
Services Corporation.
The graph on the right also reflects revenues and expenses
for FY 2013, but it excludes fuel and purchased power
revenues and expense. This provides a more detailed look
at nonfuel expenses forecast for the upcoming fiscal year.
LCRA Sources and Uses
FY 2013 (Dollars in Millions)
LCRA Sources and Uses, Nonfuel Only
FY 2013 (Dollars in Millions)
Sources $1,221
Sources $753
Uses $1,221
Uses $753
Generation,
$849 , 69%
Transmission ,
$325 , 27%
Water, $35 ,
3%
Other, $12 ,
1%
Generation,
$381 , 51%
Transmission,
$325 , 43%
Water, $35 ,
5%
Other, $12 ,
1%
Operations and
Maintenance,
$281 , 23%
Fuel and
Purchased
Power, $468 ,
38%
Debt Service,
$327 , 27%
Revenue
Funded Capital,
$97 , 8%
Other, $36 ,
3%
Reserves, $12 ,
1%
Debt Service,
$327 , 43%
Labor & Benefits,
$157 , 21%
Revenue Funded
Capital, $97 ,
13%
Outside Services,
$59 , 8%
Other Non-Labor
O&M, $65 , 9%
Other, $36 , 5%
Reserves, $12 ,
1%
Page 8 LCRA FY 2013 Business Plan
Generation
Generation
LCRA combines both fuel and nonfuel rates into a time-
of-use pricing structure. This pricing structure is designed
to recover LCRA’s reasonable and necessary costs of
providing services to all wholesale customers while
ensuring the long term financial health of LCRA. Each
customer pays the same price for energy based on when it
is used (more for peak times such as summer afternoons,
less for off-peak times such as the middle of the night).
Fuel Rate
Covers costs including:
Fuel (natural gas and coal) used to generate
electricity
Managing and transporting fuel to power plants and
fuel storage facilities
Purchased power
ERCOT market settlement
Labor for fuel-related activity, power sales and
purchases, and risk management
LCRA adjusts the fuel rate periodically to reflect
changing fuel, fuel transportation and purchased power
costs.
Nonfuel Rate
Covers costs including:
Labor for nonfuel-related activity
Operations and maintenance, including hydroelectric
operations.
Debt service, debt service coverage, and debt
retirement.
Assigned Enterprise costs
Contributions to Public Service Fund
Other nonfuel costs
Financial Summary
In FY 2013, the generation revenue requirement of $849
million is $7.5 million, or 1 percent, lower than last year’s
budget. This decrease reflects a fuel revenue decrease of
$24.1 million and a nonfuel revenue increase of $16.5
million, including $22.2 million of deferred revenues for
the paydown of long-term debt. For the FY 2014 to 2016
horizon, fuel revenue increases are primarily a product of
forecasted higher market prices for fuel and purchased
power. Nonfuel revenue increases over this same period
are the result of increasing operations and maintenance
expense and debt service attributed to projected capital
spending in generation.
Operating expenses in FY 2013 of $571 million are $60
million, or 9.5 percent, lower than last year’s budget, and
debt service payments of $164.1 million are $21.2
million, or 14.8 percent, greater than last year’s plan.
Nonfuel operations and maintenance expenses decreased
26 percent from last year’s budget. Fuel expense and
purchased power decreased $24.1 million due primarily to
lower fuel prices. Increases in debt service payments
throughout this business plan horizon reflect capital
spending associated with LCRA’s investment in the
Sandy Creek Energy Station and the Ferguson
LCRA FY 2013 Business Plan Page 9
Replacement Project. Additionally, debt service coverage
is included in the nonfuel revenue requirement to achieve
a targeted 1.25x debt service coverage level. Some
revenues are budgeted to be deferred to pay down or
avoid future debt in order to preserve LCRA’s balance
sheet and ensure its long term financial health. Projected
capital expenditures for FY 2013 are $279.5 million and
$530.6 million over the five-year plan period.
LCRA will continue long-term generation resource
planning to analyze and improve LCRA’s competitive
position in the ERCOT system. While investments in
projects like the replacement of the Thomas C. Ferguson
Power Plant increase nonfuel revenue requirements,
management believes this investment helps LCRA
improve its competitive position over the long term, as a
new power plant is anticipated to burn less fuel, produce
fewer emissions and require fewer near-term maintenance
outages.
Generation Financial Summary, FY 2012 – 2017
1
(Dollars in Millions) Budgeted Proposed
FY 2012 FY 2013 FY 2014 FY 2015 FY 2016 FY 2017
Revenues
Nonfuel Revenues $ 364.1 358.4 373.0 380.5 393.7 314.2
Fuel Revenues 492.6 468.5 509.3 539.0 573.8 372.5
Sub-Total Fuel and Nonfuel Revenues 856.6 826.9 882.4 919.5 967.5 686.8
Revenues Deferred for Debt Paydown 0.0 22.2 15.4 9.5 9.5 0.0
Total Revenue 856.6 849.1 897.8 929.0 977.0 686.8
Expenses
Net F&PCR and Affiliate Fuel Expenses 492.6 468.5 509.3 539.0 573.8 372.5
Total Nonfuel Operations and Maintenance 138.7 102.5 108.4 121.8 122.7 107.4
Total Wholesale Power / Affiliate Expense 631.2 571.0 617.7 660.8 696.5 479.9
Net Operating Margin 225.4 278.1 280.0 268.2 280.5 206.9
Add: Interest Income 1.5 0.1 0.7 5.0 5.1 4.9
Less: Assigned Enterprise Expense 20.7 25.5 27.1 29.4 30.8 31.3
Public Service Fund - Generation 24.1 24.7 25.9 26.5 27.2 27.8
Net Revenues Available for Debt Service 182.0 228.0 227.6 217.3 227.6 152.7
Less:
Revenues Deferred for Debt Paydown 0.0 22.2 15.4 9.5 9.5 0.0
Coverage Adjustments (GenTex) 3.3 0.7 1.5 0.5 0.5 0.2
Adjusted Net Revenues Available 178.7 205.1 210.7 207.4 217.6 152.5
Total Debt Service 142.9 164.1 166.9 165.2 172.9 121.6
Debt Service Coverage 1.25x 1.25x 1.25x 1.25x 1.25x 1.25x
Net Revenue After Debt Service 39.1 41.7 45.3 42.6 45.2 31.1
Less:
Operating Reserves 0.0 0.0 12.1 11.3 9.3 0.7
Assigned Enterprise Capital 4.1 3.6 10.1 4.8 4.1 2.3
Revenue Funded Capital 33.4 38.1 23.1 26.4 23.2 24.2
GenTex Rate Stabilization Fund 1.5 0.0 0.0 0.0 0.0 0.0
Debt Paydown - 0.0 0.0 0.0 8.6 4.0
Net Cash Flow 0.0 0.0 0.0 0.0 0.0 0.0
Capital Expenditures
Revenue Funded 33.4 38.1 23.1 26.4 23.2 24.2
Debt Funded 254.4 241.4 122.6 20.7 0.0 0.0
Third Party / Proceeds Funded - 0.0 0.0 5.4 5.4 0.0
Total Capital $ 287.8 279.5 145.7 52.6 28.6 24.2
1
Includes affiliate GenTex Power Corporation.
Forecast
Page 10 LCRA FY 2013 Business Plan
Transmission
Transmission Rates and Revenues
LCRA Transmission Services Corporation (LCRA TSC)
is regulated by the Public Utility Commission of Texas
(PUC). Accordingly, the PUC administers the rate-
making and rate-approval processes for LCRA TSC and
all other transmission service providers (TSPs) in
ERCOT.
Transmission Rate
The PUC establishes rates for 37 ERCOT TSPs based on
prior expenses. The rate-making process requires the TSP
to provide the PUC with a transmission cost of service
(TCOS) - the actual, historical cost of owning, operating,
maintaining and financing its transmission facilities for a
recent 12-month period. The PUC scrutinizes the TCOS
expenses and must find them “reasonable and necessary”
for them to be recoverable costs.
Transmission rates are determined by dividing the TSP’s
approved TCOS by the “4CP” in effect at the time of the
TCOS filing. The 4CP, or four-month coincident peaks, is
the average of the peak ERCOT electrical demands
(measured in kilowatts) during the most recent June, July,
August and September calendar months. The PUC
averages these four ERCOT system peaks each year to
establish a 4CP for the following calendar year.
Dividing LCRA TSC’s most recently approved TCOS
(March 8 PUC order) by the ERCOT 4CP in effect at the
time of filing produces the current LCRA TSC
transmission rate of $4.67.
The ERCOT “postage stamp rate” refers to the sum of all
TSP rates and LCRA TSC accounts about for 16 percent
of the total rate.
Billing Unit
The 4CP is also the billing unit for transmission service in
ERCOT. Each of the 81 distribution service providers
(DSPs) in ERCOT pays each TSP an amount based on the
TSP’s rate multiplied by the DSP’s portion of the
previous summer’s 4CP. DSPs use their retail rates to
pass these transmission costs through to each end-use
electric customer in the ERCOT region.
Each month every DSP pays LCRA TSC an amount equal
to 1/12 of the DSP’s portion of the ERCOT 4CP times the
LCRA TSC transmission rate (currently $4.67).
LCRA TSC’s Share of ERCOT Transmission Rate
Transmission Service Provider (TSP) Annual Transmission Rate % of Total
Oncor Electric Delivery $9.51 32%
LCRA TSC $4.67 16%
CenterPoint Energy $3.83 13%
AEP Texas Central $2.04 7%
San Antonio City Public Service $1.62 6%
Brazos Electric Cooperative $1.45 5%
Austin Energy $1.00 3%
AEP Texas North $0.96 3%
Texas Municipal Power Agency $0.66 2%
Other TSPs $3.78 13%
Total ERCOT Transmission Rate $29.52 100%
LCRA FY 2013 Business Plan Page 11
LCRA TSC is continuing its approach of seeking rate
increases as needed to recover its costs of investing
significant capital in new transmission facilities. LCRA
TSC will fulfill this strategy by pursuing either interim
capital additions or TCOS rate filings overseen by the
PUC. LCRA TSC recently completed a TCOS rate case
filing with rates effective in March 2012. LCRA TSC
plans two additional interim rate increases in January and
October 2013 in order to recover ongoing investment in
Competitive Renewable Energy Zones (CREZ) and other
transmission system improvements.
The second of these interim rate increases will incorporate
debt service on the Big Hill-to-Kendall project, which
will be LCRA TSC’s largest 345-kilovolt transmission
line construction project both in terms of length and
lifetime budget. After these interim capital additions
filings are completed, LCRA TSC has no plans for
additional rate increases for the remainder of the five-year
planning horizon, and will manage costs to achieve this
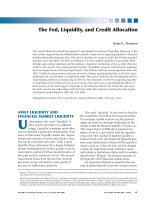
goal. See the chart below for the FY 2013 to 2017
forecast of LCRA TSC rate actions and the resulting rate
increases that are assumed in this Business Plan.
Forecast for LCRA TSC Capital Project Completions
and Impact on Transmission Cost of Service (TCOS) Rate
$82
$198
$371
$74
$47
$54
$4.67
$4.75
$5.50
$5.50
$5.50
$5.50
$0.00
$1.00
$2.00
$3.00
$4.00
$5.00
$6.00
$7.00
$0
$100
$200
$300
$400
$500
$600
FY 2012
FY 2013
FY 2014
FY 2015
FY 2016
FY 2017
TCOS Rate
Project Completions (Millions)
ICA-Eligible Capital Project Completions (left scale)
TCOS Rate (right scale)
Rate Case
ICAs
No Rate Action Planned
Page 12 LCRA FY 2013 Business Plan
Financial Summary
The FY 2013 Business Plan continues LCRA TSC’s
mission to provide safe, reliable and cost-effective
transmission services while investing in new facilities to
serve needs across ERCOT.
LCRA TSC projects collecting $318.2 million in FY 2013
for the provision of regulated transmission,
transformation and metering services. This represents an
increase of $35.3 million, or 12.5 percent, from the FY
2012 budget. In addition to regulated revenues, LCRA is
budgeting $6.8 million in revenues from unregulated
services.
Total expenses of $83.5 million for FY 2013 increase by
$8.1 million (10.7 percent), compared to FY 2012’s
budget.
LCRA TSC expects to spend $594.2 million over the
coming five-year period. However, capital activity in FY
2013 is projected to use almost one-half of that total
amount, or $294.8 million.
Over the next five years, LCRA TSC plans to bring
approximately $610 million in new transmission system
facilities into service, including approximately $451
million in support of the PUC’s CREZ initiatives.
Transmission Financial Summary, FY 2012-2017
(Dollars in Millions) Budgeted Proposed
FY 2012 FY 2013 FY 2014 FY 2015 FY 2016 FY 2017
LCRA Transmission Services Corporation
Revenues $ 282.9 318.2 342.4 369.1 375.0 380.8
Operations and Maintenance 69.5 78.1 81.8 87.6 92.0 94.1
Net Operating Margin 213.4 240.1 260.6 281.5 282.9 286.7
Transmission Customer Services
Revenues 7.1 6.8 6.9 6.8 6.8 6.8
Operations and Maintenance 5.9 5.5 5.5 5.5 5.5 5.5
Net Operating Margin 1.1 1.4 1.4 1.3 1.3 1.3
Total Transmission Services
Revenues 290.0 325 349.3 375.9 381.8 387.5
Operations and Maintenance 75.4 84 87.3 93.1 97.5 99.6
Net Operating Margin 214.6 241 262.1 282.8 284.2 288.0
Add: Interest Income 0.9 0.1 0.3 2.8 2.9 2.9
Less: Assigned Enterprise Expense 24.2 26.7 31.8 31.1 31.7 32.2
Public Service Fund 8.7 9.7 10.5 11.3 11.5 11.6
Net Revenues Available for Debt Service 182.6 205.0 220.1 243.3 243.9 247.0
Debt Service 137.3 148.7 161.8 173.0 174.5 171.6
Debt Service Coverage 1.33x 1.38x 1.36x 1.41x 1.40x 1.44x
Net Revenue After Debt Service 45.3 56.3 58.3 70.3 69.4 75.4
Less:
Operating Reserves 8.4 11.3 13.6 6.5 1.6 0.5
Enterprise Capital 6.8 6.4 8.3 5.0 4.4 2.7
Assigned Transmission Minor Capital 1.8 0.0 0.4 0.4 0.4 0.4
Revenue Funded Capital 28.8 40.0 37.1 60.6 66.1 63.9
Restricted for Capital/Debt Retirement 0.0 0.0 0.0 0.0 0.0 11.6
Transmission Customer Service Support 0.0 1.0 2.0 2.0 2.0 2.0
Plus:
Amortization of Enterprise/Minor Capital
1
0.5 2.4 3.1 4.2 5.0 5.6
Net Cash Flow 0.0 0.0 0.0 0.0 (0.0) 0.0
Capital Expenditures
Revenue Funded
2
30.6 40.0 37.4 61.0 66.4 64.2
Debt Funded 205.7 240.3 35.4 29.5 3.1 2.0
Third Party / Proceeds Funded 0.0 14.6 0.0 0.0 0.0 0.0
Total Capital $ 236.4 294.8 72.8 90.4 69.5 66.2
1
In FY 2012, Transmission Services w ill begin funding minor capital and its share of Enterprise Capital w ith current year revenues, but w ill include an
amortization of the amount in each year to recover in rates.
2
The Transmission Services Consolidated Capital table includes LCRA TSC capital spending and spending for Transmission Services Minor Capital
w hich is used by LCRA TSC and Transmission Customer Services.
Forecast
LCRA FY 2013 Business Plan Page 13
Raw Water
Rates charged to LCRA’s water customers are varied and
are dependent on the product or service provided, such as
stored water, transportation and reservation for firm water
customers, and services for customers of LCRA’s
interruptible water.
Raw Water Rates
The LCRA raw water rate structure includes components
for noninterruptible (firm) and interruptible customers as
well as a rate for reservation of water. The current rate
for firm customers who use water is $151 per acre-foot.
Those customers also pay for water reserved but not used
at half the firm rate ($75.50 per acre-foot). The rate for
interruptible customers, primarily agricultural users, is
$6.52 per acre-foot. Current projections in this business
plan do not forecast a change in the firm raw water rate,
associated reservation rate or interruptible rate. These
rates are adequate to pay for LCRA’s stewardship of the
river, including flood and daily river management and
water conservation.
However, this Business Plan does not make assumptions
regarding potential rate impacts for the addition of any
potential new water supplies.
Transportation Rates
In addition to the rate charged for actual water used,
interruptible customers and a few industrial customers
also pay for transportation through rates developed to
recover the fixed and variable costs of water delivery. For
interruptible customers, these rates reflect the cost of
service for delivery of both run-of-river and interruptible
stored water. The fixed portion is collected through a
“base charge” rate applied to each acre farmed. The
variable cost, primarily electricity, is collected through a
“diversion charge” applied through a per acre-foot rate.
Both rates are forecast to increase 4 percent in FY 2013
under a five-year rate increase schedule approved by the
Board in FY 2009. This plan continues that increase
through 2017 in an effort to keep with pace with
inflationary increases.
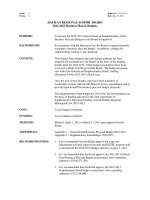
Firm and Interruptible Raw Water Revenues
(1) Ra te i s $151 per a cre-foot for us e a nd $75.50 per acre-ft. for res ervati on in a ll yea rs.
(2) Ra te i s $6.52 per a cre-foot i n al l years .
(3) "Diversion Cha rge" rate des igned to cover varia bl e di versi on cos ts of a gricultura l i rriga tion. Rate increa se s a t 4
percent per yea r.
(4) "Bas e Charge" rate des igned to cover fi xed cos ts of a gricultural irrigati on. Ra te i ncrea se s a t 4 percent per yea r.
(5) Includes other revenues s uch as the City of Aus tin a nd deferred revenues for debt pa ydown.
$38.1
$35.8
$39.7
$40.4
$41.2
$42.0
$0.0
$10.0
$20.0
$30.0
$40.0
$50.0
FY 2012
FY 2013
FY 2014
FY 2015
FY 2016
FY 2017
Municipal & industrial - noninterruptible (1)
Agricultural stored water (2)
Agricultural interruptible (3)
Agricultural transportation (4)
Other Revenue (5)
($ million)
Page 14 LCRA FY 2013 Business Plan
Financial Summary
Total Raw Water revenues of $35.8 million are lower than
FY 2012 by $2.3 million (6 percent), primarily due to
curtailment assumptions for the interruptible customers.
However, the revenue projection includes $2.0 million of
deferred revenue for the paydown of debt, or capital
related to future water supplies. Based on current
projections, the current rates assumed in this plan are
adequate to fund ongoing operations and capital needs,
including the ongoing rehabilitation of the floodgates at
Buchanan Dam.
Total expenses of $12.4 million for FY 2013 are lower by
$5.4 million (30 percent), compared to FY 2012’s budget.
The reduction in costs is the result of curtailment
assumptions as well as overall reductions in labor across
LCRA.
The raw water rates and expense management assumed in
this business plan produce funds available to support new
water supply infrastructure and are assumed deferred until
used for either expenses or capital spending associated
with such project. The forecast amount available, when
combined with forecast funds available in LCRA’s
Infrastructure Reserve, are estimated to be able to fund
the debt service of a capital project in the $125 - $150
million range. LCRA will continue evaluating options for
a larger project as part of the stated goals for FY 2013.
Projected raw water capital expenditures are $6.7 million
in FY 2013 and $40.8 million for the five-year plan
period. However, these capital expenditures do not
include an estimate for future water supply.
Raw Water Financial Summary, FY 2012-2017
(Dollars in Millions) Budgeted Proposed
FY 2012 FY 2013 FY 2014 FY 2015 FY 2016 FY 2017
Water Revenues
Municipal & industrial - noninterruptible $ 25.0 24.2 23.5 20.7 25.0 21.2
Agricultural stored water 0.7 0.4 0.7 0.7 0.7 0.7
Agricultural interruptible 4.2 2.3 4.3 4.5 4.7 4.9
Agricultural transportation 4.1 3.6 4.7 4.9 5.1 5.4
Other 4.0 3.2 3.4 3.5 3.6 3.8
Sub-Total Water Revenues 38.1 33.8 36.7 34.4 39.2 36.0
Revenues deferred for debt paydown 0.0 2.0 3.0 6.0 2.0 6.0
Total Water Revenues 38.1 35.8 39.7 40.4 41.2 42.0
Operations and Maintenance 17.8 12.4 14.0 14.4 14.7 15.1
Net Operating Margin 20.3 23.3 25.6 26.1 26.5 27.0
Add: Interest Income 0.1 0.0 0.0 0.2 0.2 0.2
Less: Assigned Enterprise Expense 5.2 6.2 6.1 6.2 6.2 6.4
Public Service Fund 1.1 1.0 1.1 1.0 1.2 1.1
Net Revenues Available for Debt Service 14.0 16.2 18.4 19.0 19.3 19.7
Less: Revenues deferred for debt Paydown 0.0 2.0 3.0 6.0 2.0 6.0
Adjusted Net Revenues Available 14.0 14.2 15.4 13.0 17.3 13.7
Debt Service 6.7 6.9 6.9 7.6 7.9 5.3
Debt Service Coverage 2.11x 2.05x 2.23x 1.71x 2.19x 2.61x
Debt Service Coverage, excluding Noncash Revenues 1.67x 1.61x 1.77x 1.28x 1.75x 1.93x
Net Revenue After Debt Service 7.4 7.3 8.5 5.4 9.4 8.5
Less:
Operating Reserves 0.3 0.0 0.4 0.1 0.1 0.1
Enterprise Capital 2.1 2.4 2.5 0.7 0.6 0.4
Revenue Funded Capital 5.0 1.9 2.5 1.3 5.2 2.5
Restricted for Capital/Debt Retirement 0.0 0.0 0.0 0.0 0.0 1.8
Noncash Revenues 2.9 3.1 3.2 3.3 3.4 3.6
Plus:
Public Service Fund Assistance 3.0 - - - - -
Net Cash Flow 0.0 0.0 0.0 0.0 0.0 0.0
Capital Expenditures
Revenue Funded 5.0 1.9 2.5 1.3 5.2 2.5
Debt Funded 4.4 4.9 5.9 7.0 3.9 5.9
Third Party / Proceeds Funded 0.6 0.0 0.0 0.0 0.0 0.0
Total Capital $ 10.0 6.7 8.4 8.3 9.1 8.3
Forecast
LCRA FY 2013 Business Plan Page 15
Water and Wastewater Utilities
This Business Plan assumes the current status of the sale,
operations and related agreements for LCRA’s water and
wastewater utilities, including:
The debt payment schedule with the West Travis
County Public Utility Agency;
Completion of the sale of the Rollingwood
Wastewater System to the City of Rollingwood;
An operations and maintenance agreement with
Corix Infrastructure for the systems being purchased
by Corix, until completion of the Sale Transfer
Merger process;
Continued ownership of the Westlake Hills
Wastewater and Tahitian Village Wastewater
Systems beyond FY 2017; and
Continued use of Public Service Funds to maintain
cash flow during the planning period.
Water and Wastewater revenues of $6.6 million are $32.5
million (83 percent) lower than FY 2012, due to the
ongoing divestiture process.
Expenses of $3.9 million are $11 million (74 percent)
lower than FY 2012, also the result of the ongoing
divestiture process.
The FY 2013 Business Plan includes some capital
spending for required improvements at the systems being
purchased by Corix. LCRA will manage and fund these
projects but will be reimbursed in accordance with the
purchase agreement. This plan demonstrates LCRA’s
continued commitment of providing vital utility services
and planning for future water needs in a cost-conscious
manner.
Water and Wastewater Utilities Financial Summary, FY 2012-2017
(Dollars in Millions) Budgeted Proposed
FY 2012 FY 2013 FY 2014 FY 2015 FY 2016 FY 2017
Total Revenue $ 39.1 6.6 6.8 4.1 4.1 3.5
Operations and Maintenance 14.9 3.9 4.0 0.2 0.2 0.2
Net Operating Margin 24.2 2.7 2.8 3.9 3.8 3.3
Add: Interest Income 0.1 0.0 0.0 0.0 0.0 0.0
Less: Assigned Enterprise Expense 3.8 1.1 1.1 0.2 0.2 0.2
Public Service Fund 0.9 0.2 0.2 0.1 0.1 0.1
Net Revenues Available for Debt Service 19.5 1.5 1.4 3.6 3.5 3.0
Debt Service 17.1 2.6 2.9 4.1 4.1 3.5
Debt Service Coverage 1.14x 0.57x 0.50x 0.88x 0.86x 0.85x
Net Revenue After Debt Service 2.3 (1.1) (1.4) (0.5) (0.6) (0.5)
Less:
Operating Reserves 0.0 0.0 0.1 0.0 0.0 0.0
Enterprise Capital 0.5 0.0 0.1 0.1 0.1 0.0
Revenue Funded Capital 4.3 0.8 0.9 0.0 0.0 0.0
Restricted for Capital/Debt Retirement 0.6 0.2 0.2 0.2 0.2 0.2
Plus:
Public Service Fund Assistance 3.1 2.2 2.7 0.8 0.8 0.8
Net Cash Flow 0 0.0 0.0 0.0 0.0 0.0
Capital Expenditures
Revenue Funded 0.7 0.8 0.9 - - -
Impact Fee Funded 3.6 0.0 0.0 - - -
Debt Funded 4.3 2.2 0.2 - - -
Third Party/ Proceeds Funded 0.6 1.3 0.4 - - -
Total Capital $ 9.2 4.4 1.5 - - -
Forecast
Page 16 LCRA FY 2013 Business Plan
Enterprise Costs
Enterprise Costs
Functions that provide general support and oversight to
the organization are now embedded in several of the
departments created by the reorganization, and these
departments continue to execute those responsibilities in a
more cost-efficient manner. These enterprise costs were
previously considered part of the corporate cost structure
or were embedded in multiple business units. The current
structure has eliminated those redundancies. Regardless
of departmental assignment, the associated costs are
assigned to each LCRA product for rate development and
financial evaluation. Enterprise costs total $94.1 million
in FY 2013, offset by $5.0 million in revenue. The net
expense cost of $89.1 million is further offset by charges
to Austin Energy (AE) of $5.1 million for services LCRA
provides to them related to the partnership in the Fayette
Power Project. The remaining $84.0 million is assigned to
each product line as an element of its cost of service as
shown in the cost assignment below, or as an element of
capital project costs.
Financial Summary
Enterprise revenue of $5.0 million represents
telecommunication revenue and is used to offset total
enterprise costs. Total expense of $94.1 million represents
the total costs of providing enterprise services such as
legal, financial, and other operational support activities
that benefit LCRA’s product lines. The resulting net
operating cost of $89.1 million is then assigned to the
product lines as part of their specific revenue requirement.
Additionally, a portion of enterprise costs are related to
capital or other activities and are therefore assigned to
those areas for funding.
Projected capital expenditures are $14.1 million in FY
2013 and $86 million for the five-year plan period.
Enterprise Costs, FY 2013-2017
(Dollars in Millions) Proposed
FY 2013 FY 2014 FY 2015 FY 2016 FY 2017
Total Revenue $ 5.0 $ 5.2 $ 5.0 $ 5.0 $ 5.1
Gross Enterprise Costs 94.1 95.3 96.8 96.8 99.4
Net Enterprise Costs 89.1 90.1 91.8 91.8 94.3
Cost Assignment
Generation 25.5 27.1 29.4 30.8 31.3
Transmission 26.7 31.8 31.1 31.7 32.2
Water 7.2 7.3 6.4 6.4 6.6
PSF Activities 6.4 6.4 6.5 6.7 6.8
Capital / AE / Other 23.3 17.4 18.4 16.1 17.4
Total 89.1 90.1 91.8 91.8 94.3
Capital Expenditures
Revenue Funded 14.1 24.2 12.6 10.8 6.1
Debt Funded 0.0 2.3 4.8 3.2 0.4
Third Party / Proceeds Funded
0.0 0.0 0.0 0.0 0.0
Total Capital 14.1 26.5 17.4 14.0 6.5
Forecast
LCRA FY 2013 Business Plan Page 17
Cost Drivers
Compensation and Benefits
LCRA’s total estimated labor budget for FY 2013 is
$153.3 million, which includes operations and
maintenance expense and capital expenditures. This
amount is $21.9 million (12.5 percent) less than the FY
2012 budget. Headcount for FY 2012 totals 1,984, which
is a reduction of 314 positions (14 percent) from the FY
2012 budget.
For the FY 2013 Business Plan, LCRA’s labor budget for
nonfuel operations and maintenance activity is $116.0
million, $3.6 million for fuel activity, and $25.8 million
for capital activity.
A portion of the labor costs is charged to Austin Energy
for its share of the work at the Fayette Power Project,
which equals $7.9 million in FY 2013.
Base Pay Increases
The estimated labor budget for FY 2013 includes 4
percent annual base salary increases. Similar increases are
assumed through FY 2017.
Benefits
In addition to compensation, LCRA provides employees a
range of benefits such as health plans, life insurance and
retirement and retiree health plans.
The estimated total benefits budget for FY 2013 is $58.3
million, or approximately 38 percent of payroll for FY
2013. This is $1.3 million (2.2 percent) less than the FY
2012 budget. The savings in benefit costs resulting from
staff reductions are partially offset by an increase in
retiree health plan costs, as many of the reductions were
associated with employees eligible for retirement benefits
that include retiree health plans.
Benefit costs follow labor expenditures, with LCRA’s
share being $44.1 million for nonfuel operations and
maintenance, $1.4 million for fuel activity, $9.8 million
for capital activity, and $3.0 million charged to Austin
Energy.
Fuel
Total fuel and purchased power costs are approximately
40 percent of LCRA’s total use of funds in each fiscal
year. Managing this cost is an important element of
LCRA’s long-term success.
Debt Service
While LCRA does revenue fund a portion of its capital
program, LCRA also issues long-term tax-exempt debt to
fund the majority of capital spending. Annual debt service
is a component of the cost of providing services to
customers and is included in the development of rates and
the annual planning process. The projected debt service
included in this plan includes existing annual payments on
outstanding bonds and commercial paper, as well as an
estimate of the financing costs related to debt-funded
capital projects in the upcoming fiscal years.
Additionally, as funds are available, LCRA will pay down
outstanding debt to lower total costs and for the long-term
financial health of the organization.
Page 18 LCRA FY 2013 Business Plan
Public Service Fund
The Public Service Fund (PSF) is the mechanism LCRA
uses to fund statutory programs that do not generate
sufficient revenues to fully recover their costs and for
other uses at the Board’s discretion. The PSF is directed
through Board Policy 301 – Financial Policy, which
establishes the fund parameters, and Board Policy 403 –
Community Services, which establishes the guidelines for
developing and carrying out LCRA’s Public Services
programs. An element of the cost of service for LCRA’s
generation, transmission and water operations includes
contributions to this fund.
Based on a negotiated contractual arrangement with
LCRA’s wholesale electric customers, Generation
contributions are adjusted each year at a rate indexed to
average load growth. Contributions from GenTex 1 (the
portion of Lost Pines 1 Power Project capacity that
GenTex Power Corporation sells directly to LCRA’s
wholesale customers) are based on 3 percent of budgeted
revenues. Annually, Transmission and Raw Water rates
contribute 3 percent of the total budgeted revenues.
Intracompany revenues associated with pass- through
transactions from service providers are excluded from the
calculation.
Public Service Funds, FY 2012-2017
(Dollars in Millions) Budgeted Proposed
FY 2012 FY 2013 FY 2014 FY 2015 FY 2016 FY 2017
Sources:
Generation $ 22.4 23.0 23.8 24.3 24.9 25.5
GenTex 1.7 1.7 2.1 2.1 2.3 2.4
Transmission 8.7 9.7 10.5 11.3 11.5 11.6
Water 2.1 1.2 1.3 1.2 1.3 1.2
Subtotal 34.9 35.7 37.7 38.9 40.0 40.6
Uses:
PSF Activities 23.8 26.8 29.2 29.1 30.1 29.8
Water & Wastewater Utility Equity 3.1 2.2 2.7 0.8 0.8 0.8
Infrastructure Reserve 4.5 6.7 5.8 9.0 9.1 10.0
Irrigation Support 3.0 0.0 0.0 0.0 0.0 0.0
Water/Wastewater Divestiture Funding 0.5 0.0 0.0 0.0 0.0 0.0
Subtotal 34.9 35.7 37.7 38.9 40.0 40.6
Net Available Public Service Funds: $ 0.0 0.0 0.0 0.0 0.0 0.0
Forecast
LCRA FY 2013 Business Plan Page 19
Public Service Fund Activities
Public Service Fund monies are used to support parks,
natural science centers, public safety activities, natural
resource protection and LCRA’s Environmental Lab and
to provide economic development assistance to the
surrounding communities. These services generate some
revenue but require support from the PSF to cover the
total operations and maintenance, enterprise support and
capital costs that support these activities. Prior to FY
2009, Water Quality activities had been funded wholly or
in part by the PSF. During FY 2009-2012, Water Quality
activities were paid for by raw water revenues, but an
evaluation of PSF sources and uses initiated during FY
2012 resulted in the inclusion of LCRA’s Water Quality
activities as a recipient of PSF support in the FY 2013
Business Plan.
Total revenues are projected at $8.9 million for FY 2013
and increasing by $0.4 million to $9.3 million by FY
2017, primarily from increased revenue from the
Environmental Lab.
Total operating expenses of $30.6 million, which includes
$6.4 million of Enterprise Costs, are projected for FY
2013, increasing by $3.5 million to $34.1 million by FY
2017, primarily driven by labor costs increasing assumed
at 4 percent annually.
Projected capital expenditures are $2.2 million in FY
2013 and $13.8 million for the five-year plan period.
In addition to the items listed above, the Total Funding
Requirement from the PSF includes $1 million annually
for the Community Development Partnership Program.
Public Service Fund Activities, FY 2013-2017
(Dollars in Millions) Proposed
FY 2013 FY 2014 FY 2015 FY 2016 FY 2017
Revenue
Public Services $ 2.3 2.3 2.4 2.2 2.2
Water Quality 0.5 0.2 0.2 0.2 0.2
Public Safety 0.7 0.7 0.7 0.7 0.7
Environmental Lab 5.5 5.6 5.7 6.0 6.2
Total Revenue 8.9 8.8 9.0 9.1 9.3
Operations and Maintenance
Public Services 15.0 15.3 15.6 16.0 16.4
Water Quality 3.5 3.5 3.6 3.7 3.8
Public Safety 6.4 6.6 6.8 7.1 7.4
Environmental Lab 5.7 5.9 6.1 6.3 6.5
Total Operating Expense 30.6 31.3 32.1 33.2 34.1
Operating Funding Requirement 21.6 22.4 23.1 24.0 24.7
Capital Spending 2.2 2.4 2.8 3.2 3.2
Rev. Funded Enterprise Capital 1.7 3.2 2.0 1.6 0.6
Reserves 0.3 0.2 0.2 0.3 0.2
CDPP 1.0 1.0 1.0 1.0 1.0
Total Funding Requirement 26.8 29.2 29.1 30.1 29.8
Capital Expenditures
Revenue Funded 2.2 2.4 2.8 3.2 3.2
Debt Funded 0.0 0.0 0.0 0.0 0.0
Total Capital $ 2.2 2.4 2.8 3.2 3.2
Forecast