The State of U.S. Railroads docx
Bạn đang xem bản rút gọn của tài liệu. Xem và tải ngay bản đầy đủ của tài liệu tại đây (431.76 KB, 66 trang )
This document and trademark(s) contained herein are protected by law as indicated in a notice appearing later in
this work. This electronic representation of RAND intellectual property is provided for non-commercial use only.
Unauthorized posting of RAND PDFs to a non-RAND Web site is prohibited. RAND PDFs are protected under
copyright law. Permission is required from RAND to reproduce, or reuse in another form, any of our research
documents for commercial use. For information on reprint and linking permissions, please see RAND Permissions.
Limited Electronic Distribution Rights
This PDF document was made available from www.rand.org as a public
service of the RAND Corporation.
6
Jump down to document
THE ARTS
CHILD POLICY
CIVIL JUSTICE
EDUCATION
ENERGY AND ENVIRONMENT
HEALTH AND HEALTH CARE
INTERNATIONAL AFFAIRS
NATIONAL SECURITY
POPULATION AND AGING
PUBLIC SAFETY
SCIENCE AND TECHNOLOGY
SUBSTANCE ABUSE
TERRORISM AND
HOMELAND SECURITY
TRANSPORTATION AND
INFRASTRUCTURE
WORKFORCE AND WORKPLACE
The RAND Corporation is a nonprofit research
organization providing objective analysis and effective
solutions that address the challenges facing the public
and private sectors around the world.
Visit RAND at www.rand.org
Explore RAND Infrastructure, Safety, and Environment
View document details
For More Information
INFRASTRUCTURE, SAFETY,
AND ENVIRONMENT
Purchase this document
Browse Books & Publications
Make a charitable contribution
Support RAND
This product is part of the RAND Corporation technical report series. Reports may
include research findings on a specific topic that is limited in scope; present discus-
sions of the methodology employed in research; provide literature reviews, survey
instruments, modeling exercises, guidelines for practitioners and research profes-
sionals, and supporting documentation; or deliver preliminary findings. All RAND
reports undergo rigorous peer review to ensure that they meet high standards for re-
search quality and objectivity.
The State of U.S. Railroads
A Review of Capacity and
Performance Data
Brian A. Weatherford, Henry H. Willis, David S. Ortiz
Supported by the UPS Foundation
A RAND INFRASTRUCTURE, SAFETY, AND ENVIRONMENT CENTER
Supply Chain Policy Center
The RAND Corporation is a nonprofit research organization providing objective analysis
and effective solutions that address the challenges facing the public and private sectors
around the world. RAND’s publications do not necessarily reflect the opinions of its
research clients and sponsors.
R
®
is a registered trademark.
© Copyright 2008 RAND Corporation
All rights reserved. No part of this book may be reproduced in any form by any electronic or
mechanical means (including photocopying, recording, or information storage and retrieval)
without permission in writing from RAND.
Published 2008 by the RAND Corporation
1776 Main Street, P.O. Box 2138, Santa Monica, CA 90407-2138
1200 South Hayes Street, Arlington, VA 22202-5050
4570 Fifth Avenue, Suite 600, Pittsburgh, PA 15213-2665
RAND URL:
To order RAND documents or to obtain additional information, contact
Distribution Services: Telephone: (310) 451-7002;
Fax: (310) 451-6915; Email:
The research described in this report was supported by a grant from the UPS Foundation
and was conducted under the auspices of the RAND Supply Chain Policy Center of the
Transportation, Space, and Technology Program within RAND Infrastructure, Safety, and
Environment.
Library of Congress Cataloging-in-Publication Data
Weatherford, Brian.
The state of U.S. railroads : a review of capacity and performance data / Brian A. Weatherford,
Henry H. Willis, David S. Ortiz.
p. cm.
Includes bibliographical references.
ISBN 978-0-8330-4505-8 (pbk. : alk. paper)
1. Railroads—Freight—United States. I. Willis, Henry H. II. Ortiz, David (David Santana) III. Title.
HE2355.W43 2008
385'.240973—dc22
2008027303
iii
Preface
Concern about the ability of the U.S. railroad system to accommodate a significant increase in
rail freight volume without degrading the speed and reliability of railroad service has motivated
several recent studies of railroad infrastructure. Many of these studies were commissioned
by trade associations or organizations representing interested parties, and it is challenging to
disentangle facts about the current capacity and performance of railroads from advocacy posi-
tions of carriers or shippers. is report draws from publicly available data on the U.S. railroad
industry to provide observations about rail infrastructure capacity and performance in trans-
porting freight.
is report should be of interest to freight carriers, shipping companies, congressional
and executive-branch leaders responsible for establishing transportation policies and priorities,
and other organizations concerned about the capacity and performance of railroads.
e research and analysis presented in this report are based and expand on prior RAND
Corporation work on current policy issues in transportation and the supply chain. e inter-
ested reader may wish to refer to the following publications for more detail:
Increasing the Capacity of Freight Transportation: U.S. and Canadian Perspectivest (Ortiz et
al., 2007)
Evaluating the Security of the Global Containerized Supply Chaint (Willis and Ortiz,
2004).
is work was made possible by a grant from the UPS Foundation.
The RAND Transportation, Space, and Technology Program
is research was conducted under the auspices of the RAND Supply Chain Policy Center
(SCPC) of the Transportation, Space, and Technology (TST) Program within RAND Infra-
structure, Safety, and Environment (ISE). e mission of ISE is to improve the development,
operation, use, and protection of society’s essential physical assets and natural resources and
to enhance the related social assets of safety and security of individuals in transit and in their
workplaces and communities. e TST research portfolio encompasses policy areas including
transportation systems, space exploration, information and telecommunication technologies,
nano- and biotechnologies, and other aspects of science and technology policy.
As part of this effort, RAND has established SCPC to conduct research that helps the
public and private sectors address critical issues in freight transportation. e center is funded
by contributions and derives its strength from the RAND Corporation’s 60 years of interdis-
iv The State of U.S. Railroads: A Review of Capacity and Performance Data
ciplinary experience addressing policy issues of global importance through objective and inde-
pendent analysis.
Questions or comments about this report should be sent to the project leader, Henry H.
Willis (). Information about TST is available online (d.
org/ise/tech). Inquiries about SCPC, its research, or publications should be sent to the follow-
ing address:
Martin Wachs, Director
Transportation, Space, and Technology Program, ISE
RAND Corporation
1776 Main Street
P. O. Box 2138
Santa Monica, CA 90401-2138
310-393-0411, x7720
v
Contents
Preface iii
Figures
vii
Tables
ix
Summary
xi
Acknowledgments
xiii
Abbreviations
xv
CHAPTER ONE
Introduction 1
Freight Transportation: An Engine for Economic Growth
1
e Pressures of Increased Demand for Transportation
2
Concerns About Rail Infrastructure
4
e Public Costs of Private Logistics Decisions
5
Content of is Report
8
CHAPTER TWO
Capacity 11
Capacity: Industry Structure
11
Capacity: Infrastructure
13
Track
14
Cars and Locomotives
16
Signals
18
Maintenance
20
Capacity: Motive Power
22
Capacity: Operating Strategies
23
Adjust Rates
23
Shed Traffic
24
Adjust Operating Speeds
26
Adjust Volume or Productivity
26
Unit Trains
27
Capacity: Crews
28
Capacity Summary
29
CHAPTER THREE
Performance 31
Average Speed
31
vi The State of U.S. Railroads: A Review of Capacity and Performance Data
Reliability 32
Prices
37
Productivity
38
Resilience
39
CHAPTER FOUR
Observations and Recommendations 41
References
45
vii
Figures
1.1. Total Freight Expenditures in Billions of Dollars and Percentage of GDP 2
2.1. Real Net Railroad Operating Income
12
2.2. Miles of Railroad and Tons Originated
15
2.3. Freight Rail Cars in Service
17
2.4. Average Tons of Freight per Train Load
22
2.5. Rail Rates and Volume
24
2.6. Average Car Capacity and Actual Tons per Carload
27
3.1. Average Speed
35
3.2. Terminal Dwell Time
36
ix
Tables
1.1. Traffic Density 3
1.2. Summary of Truck and Rail Freight Costs
7
2.1. Class I Railroads
13
2.2. Railroad Miles
16
2.3. Tons of Rail Freight Originated, by Commodity
18
2.4. Locomotive Productivity
19
2.5. Annual Expenditures on Maintenance and Infrastructure
21
2.6. Annual Intermodal Movements
25
2.7. Trends in Train and Freight Car Productivity
28
3.1. Average Train Speed
33
3.2. Major Rail Commodities, by Volume and Value
34
3.3. Terminal Dwell
36
xi
Summary
U.S. freight volumes are expected to double in the next 30 years. Increased use of rail freight is
seen as a way to accommodate increased volumes while minimizing congestion on the highway
system. However, the U.S. railroad network consists of many fewer track miles than it did sev-
eral decades ago, and there is concern that it has become congested and incapable of handling
additional volume.
Concern about the ability of the U.S. railroad system to accommodate a significant
increase in rail freight volume without degrading the speed and reliability of railroad service
has motivated several recent studies of railroad infrastructure. Many of these studies were
commissioned by trade associations or organizations representing interested parties, and it is
challenging to disentangle facts about the current capacity and performance of railroads from
advocacy positions of carriers or shippers. is report draws from publicly available data on
the U.S. railroad industry to provide observations about rail infrastructure capacity and per-
formance in transporting freight.
Railroad capacity is determined by many factors, including the amount of railroad track
and rolling stock, the number and power of locomotives, maintenance, staffing levels, and a
wide variety of operating strategies. Increases in railroad productivity over the past quarter-
century indicate that more freight (as measured in ton-miles) is being transported today than
ever before. Data suggest that this has been made possible by increasing the utilization of
railroad infrastructure through technological innovation and improved operations. However,
analyzing trends using the single metric of capacity fails to capture the complexity of rail
performance.
Speed and reliability are the most salient metrics of the performance of rail service. Long-
term trends show improvements in both of these measures. However, publicly available data
suggest that these decade-long trends may be slowing or reversing. Some shippers suggest that
this is the case and that, in certain markets or regions, they are experiencing significantly
higher costs or poorer performance from freight rail service. However, data are not shared pub-
licly at the temporal, geographic, and commodity levels to assess these claims. us, it is not
apparent whether performance is now stable, significantly declining, or improving.
One reason to examine the impacts of railroads performance on freight markets is that
these markets are determined by the collective decisions of carriers from multiple modes and
shippers of multiple types of freight.
1
In addition to the rates charged by a trucking or railroad
company to transport its freight, the shipper must consider the amount of time it will take
for its goods to arrive at the correct destinations; the risk that its freight might get damaged,
1
In this report, we use mode to differentiate types of freight transportation: Rail is one mode; trucking another.
xii The State of U.S. Railroads: A Review of Capacity and Performance Data
lost, or delayed; and other costs, such as paperwork, warehousing, and drayage. Railroads and
trucking companies take actions that influence the overall cost of shipping freight, and ship-
pers respond to these signals. us, when a railroad or trucking firm improves performance,
shippers may respond by shifting the transportation of freight—even extremely time-sensitive
shipments—from one mode to the other.
As an illustrative example of this issue, this report describes how slower and less reliable
shipments led one firm to shift traffic from rail to truck to fulfill its customers’ orders in a
timely manner and maintain its supply chains at the lowest overall cost. is example illus-
trates the larger, public consequences of private decisions to shift freight transportation among
modes. Shippers make transportation decisions based on what modes of transportation best
satisfy their firm’s logistics supply chain. eir decisions, however, have consequences that
affect other users of the transportation system, communities through which the infrastructure
passes, and the environment, because different modes of freight differ in their safety concerns,
levels of pollution, and energy consumption. ese interactions justify an expanded public-
sector role for freight transportation planning.
Based on these observations, this report raises three issues for additional analysis to create
options for transportation policy and support transportation planning:
Improved reporting and public dissemination of railroad system and performance statistics t
are needed to support transportation policy. Far more data are available for highways than
for railroads, which are no less critical to the efficient flow of goods. Analysis of freight
transportation planning in general and railroad transportation planning in particular is
hindered by a lack of publicly available, detailed, and accurate data. Better data allow for
practical incentive-based policies to set rail performance standards.
e public and private cost trade-offs between shipping freight by truck and by rail need to be t
better understood. Far too little is known about this important issue at this time to recom-
mend major policy changes, but the implications are potentially large, especially as the
highway system becomes increasingly congested and rail rates continue to rise. Future
research should include developing a more accurate comparison of rail and truck freight
transportation costs and a model that can be used to explore different policy options, such
as congestion tolls, carbon taxes, and the proposed rail infrastructure tax credit. Captur-
ing the relative congestion externalities will require developing improved economic mod-
eling of decisionmaking in the freight transport industry as well as large-scale modeling
of the nation’s multimodal transportation network.
A national freight strategy should balance the private interests of the shippers and railroads t
with the public interest associated with the public costs of different modes of transportation. By
passing the Staggers Rail Act (P.L. 96-448), the government did not abdicate responsibil-
ity for overseeing the railroad industry. Surface-transportation advocates appear to agree
that some federal coordination and possibly funding of rail capacity expansion will be
necessary, but it is the federal government’s responsibility to ensure that this investment
benefits the public interest.
xiii
Acknowledgments
is work was supported by the UPS Foundation and benefited from consultations with the
advisory board of the RAND Supply Chain Policy Center. e authors also wish to thank
RAND colleagues in the Supply Chain Policy Center for their added insights and contribu-
tions to this study, including omas Light, Kate O’Neal, Paul Sorensen, and Martin Wachs.
xv
Abbreviations
AAR Association of American Railroads
ABS automatic block signaling
BNSF Burlington Northern Santa Fe Railway
CAPM capital-asset pricing model
CN Canadian National
CP Canadian Pacific Railway
CPI consumer price index
CTC centralized traffic control
DOT U.S. Department of Transportation
FRA U.S. Federal Railroad Administration
GDP gross domestic product
KCS Kansas City Southern
NS Norfolk Southern
PTC positive train control
SCTG Standard Classification of Transported Goods
STB Surface Transportation Board
STCC Standard Transportation Commodity Code
UPS United Parcel Service
VMT vehicle miles traveled
1
CHAPTER ONE
Introduction
e Federal Highway Administration has projected that U.S. freight tonnage will grow by
more than 70 percent between 2006 and 2035 (FHWA, 2007, p. 11, Table 2-1). Transporta-
tion officials view an increased use of rail freight as a way to accommodate increased volumes
without adding more trucks to the congested U.S. highway system. However, the U.S. railroad
network consists of many fewer track miles than it did several decades ago, and shippers and
policymakers are concerned that it has become congested and incapable of handling additional
volume.
Concern about the ability of the U.S. railroad system to accommodate a significant
increase in rail freight volume without degrading the speed and reliability of railroad service
has motivated several recent studies of railroad infrastructure (see Cambridge Systematics and
Association of American Railroads, 2007, and AASHTO and Cambridge Systematics, 2003).
Many of these studies were sponsored by trade associations or organizations representing inter-
ested parties, and it is challenging to disentangle the facts about the current capacity and per-
formance of railroads from advocacy positions of carriers or shippers. is report draws from
publicly available data on the U.S. railroad industry to provide observations about rail infra-
structure capacity and performance in transporting freight drawn.
Freight Transportation: An Engine for Economic Growth
For decades, the U.S. economy has benefited from declining transportation costs. With the
introduction of containerization, manufacturers and retailers took advantage of cheaper and
more-reliable transportation to reduce inventories and implement just-in-time operating prac-
tices. Lower inventories made additional capital available to be reinvested or returned to share-
holders and contributed to economic growth. After steadily falling for several decades, U.S.
transportation and logistics spending, normalized against gross domestic product (GDP),
started to increase in 2004. Between 1990 and 2003, the ratio of spending on freight trans-
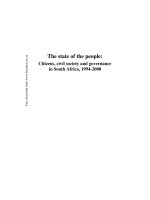
portation to GDP fell from 3.92 percent to 2.72 percent. In 2004, as shown in Figure 1.1,
this ratio increased moderately (Eno and UGPTI, 2007). According to the 18th Annual State
of Logistics Report®, the upward trend in transportation and logistics costs that began in 2004
continued in 2005 and 2006 (Wilson, 2007, p. 1).
Many factors are responsible for the relative (and nominal) increase in logistics costs,
including truck-driver shortages, rising fuel prices, higher interest rates, increased inventories
to counter decreased shipment reliability, and higher freight shipping rates (Wilson, 2007,
2 The State of U.S. Railroads: A Review of Capacity and Performance Data
Figure 1.1
Total Freight Expenditures in Billions of Dollars and Percentage of GDP (1990–2004)
0
0.5
1.0
1.5
2.0
2.5
3.0
4.5
3.5
4.0
0
50
100
150
200
250
350
300
Freight expenditures as % of GDP
Consumer freight expenditures ($ billions)
Expenditures
% of GDP
1990 1995 1997 19991996 1998
Year
2000 2001 2002 2003 2004
SOURCE: Eno and UGPTI (2007, p. 32).
RAND TR603-1.1
pp. 6–9). As transportation becomes more expensive and less reliable, this trend toward higher
logistics costs is expected to continue (Ortiz et al., 2007, p. 8; Wilson, 2007, p. 14).
Given the economies of scale in railroad operations and concerns over highway conges-
tion, rail freight is seen as part of the solution to increased logistics costs. Many of the largest
shippers optimize their logistics systems by shipping some of their inventory by rail. Local
policymakers in Los Angeles (and elsewhere) are looking at short-haul railroad “shuttle ser-
vices” as a solution to urban traffic congestion (SCAG, 2005, p. 18). In addition, H.R. 1300
(U.S. House of Representatives, 2007) mentions “bolstering rail infrastructure” as one way
to reduce the nation’s dependence on foreign oil because rail transportation is more fuel effi-
cient than trucks are over long distances. Rail’s ability to contribute to future freight capacity
depends on maintaining or improving the capacity, speed, and reliability of the national rail-
road network.
The Pressures of Increased Demand for Transportation
e U.S. transportation network is operating at an unprecedented level of traffic density. As
shown in Table 1.1, the density of traffic on the highway system has more than doubled over
the past 25 years. One consequence has been the costs of chronic urban traffic congestion. e
Schrank and Lomax (2007, p. 8) calculated that, in 2005, traffic congestion wasted 2.9 billion
gallons of fuel and 4.2 billion hours of highway users’ time.
Introduction 3
Table 1.1
Traffic Density
Year
VMT per Highway Lane Mile
(millions)
Ton-Miles per Track Mile
(millions)
1980 1.65 3.40
1985 1.96 3.62
1990 2.42 5.17
1991 2.46 5.30
1992 2.53 5.60
1993 2.61 5.95
1994 2.70 6.54
1995 2.78 7.24
1996 2.76 7.66
1997 2.94 7.82
1998 3.04 8.05
1999 3.11 8.48
2000 3.18 8.70
2001 3.23 8.94
2002 3.29 8.86
2003 3.35 9.18
2004 3.43 9.94
2005 3.45 10.33
SOURCES: VMT per lane mile: staff calculations using data from U.S. Federal Highway
Administration (all dates). Ton-miles per track mile: AAR (2006, p. 42).
NOTE: VMT = vehicle miles traveled.
Over the same time period, railroad network traffic density has nearly tripled. Increased
rail productivity, also shown in Table 1.1, has generated higher returns on capital but has also
raised concerns that railroad speed and reliability will fall as volumes continue to increase
without investments in additional infrastructure.
1
If rail service performance were to decline
under the pressure of increasing traffic density, rail would become a less effective mode for
transporting freight. Furthermore, the resulting increased utilization of trucks would exert
additional congestion costs on the U.S. economy as well as additional environmental costs.
ese concerns about the capacity of rail to accommodate growth in freight demand present a
dilemma for advocates of rail freight as a potential solution to highway traffic congestion.
1
See Cambridge Systematics and AAR (2007), which calculates railroad infrastructure needs based on a volume-to-
capacity ratio calculation.
4 The State of U.S. Railroads: A Review of Capacity and Performance Data
Concerns About Rail Infrastructure
e broad economic importance of logistics systems and their impacts on transportation net-
works raise questions about railroad infrastructure and systems that concern shippers, regula-
tors, and policymakers. First, is the performance of rail infrastructure decreasing? Second, how
are shippers responding to changes in rail performance? ird, is there justification for public-
sector involvement in rail infrastructure planning and financing?
Defining and measuring rail performance is challenging and complex. rough changes
in operations, productivity, and pricing policies, the railroads have been able to increase the
amount of freight shipped while making limited new investments in infrastructure. While rail
carriers have adjusted their operations to increase capacity, they have not consistently improved
speed and reliability. Rail transportation has become more competitive with truck transporta-
tion, but service speed and reliability remain too low for many classes of freight. Rail traffic
density may continue to increase, allowing for further productivity improvements, but recent
indications that rates are rising suggest that it is possible that, at least in the near future, rail
volumes may be approaching capacity. Publicly available data do not indicate that that has yet
happened, but there are physical limits on rail capacity and to productivity improvements,
and the possibility of reaching those limits raises concerns that the quality of rail service will
decline.
At recent government hearings, shippers from agriculture, coal, chemicals, and other
bulk-commodity industries expressed their dissatisfaction with what they perceive to be a
decline in the quality of railroad service and “monopolistic” rates.
2
As a result, shippers have
called for “new approaches to rate regulation” and, thus, reconsideration of the Staggers Rail
Act (P.L. 96-448; see Whiteside, 2005, p. 3).
at statute partially deregulated the railroad industry and gave railroads greater flexibil-
ity to set rates and optimize their networks. In the years following the passage of the Staggers
Rail Act (P.L. 96-448), the railroads merged their operations, sold off underperforming routes,
and cut rates to their largest customers as they worked to stimulate demand.
Shippers, especially small agricultural producers, have loudly protested that the actions of
the rail industry since the passage of Staggers have led to higher rates and poorer service. How-
ever, the many studies conducted by academia, government, and industry show that the net
effect of rail deregulation was to reduce rates for all commodities, increase competition, and
improve factor (e.g., labor, capital) productivity.
3
ese studies have shown that large shippers
able to fill multiple rail cars per shipment have fared better under the new regulatory environ-
ment than have small shippers.
e Staggers Rail Act (P.L. 96-448) is widely credited with allowing the industry to
recover financially after a sustained period of bankruptcies and falling revenues (Winston,
2005). However, many of those studies are now several years old, and more-current research
from the finance industry suggests that rail rates have begun to increase by as much as 30 per-
cent for some customers (Greene, 2007, p. 5). Despite vocal complaints to Congress and the
2
Many shippers have expressed concern about the cost and performance of rail service; for example, see witness testimony
from U.S. House of Representatives (2006), U.S. Senate (2006), and oral-argument exhibits from STB (2005, 2007a,
2007b).
3
For example, see Bitzan and Keeler (2003), Brown (1998), Davis and Wilson (2003), MacDonald and Cavalluzo, (1996),
Martland (2006), and Winston (2005).
Introduction 5
Surface Transportation Board (STB), it appears that most shippers have access to transporta-
tion markets that function reasonably well and allow them to choose, based on costs and per-
formance, transportation services that best serve their interests.
4
Shippers, even within the same industry, differ from one another in their distance to
suppliers and markets and their access to transportation infrastructure. As railroads changed
rates and consolidated track, the effects of those changes on shippers benefited some more than
others, and some shippers may have ultimately been hurt by those changes. Captive shippers,
those who have limited transportation options other than by a single rail carrier, have likely
been hurt by the rate changes and track consolidations that followed deregulation. eir com-
petitors, which retained access to multiple carriers because of the locations of their facilities or
their suppliers, likely benefited from the same changes.
5
In contrast, intermodal shippers can
balance cost and performance of freight transportation by selecting among competing rail and
truck freight services.
6
In principle, some freight transportation markets are efficient because intermodal ship-
pers using trucks are able to shift to rail if it would serve them better and shippers using rail
can shift to truck if rail is not serving them well. us, it is possible that any additional costs
to further improve the speed and reliability of rail service would increase rates above levels
that shippers would pay. Accordingly, it is only rational for railroads to improve performance
if the additional amount they can charge exceeds the marginal cost of improved speed and
reliability.
Some large businesses have, in fact, worked with railroads to reduce their transporta-
tion costs while maintaining a desired level of performance. e example of one company
in particular, United Parcel Service (UPS), is illustrative of the challenges of increasing rail
performance and the choices that private firms make in response. It also provides context for
our third research question because it demonstrates the public impacts of private decisions to
transfer freight from one mode of transportation to another.
The Public Costs of Private Logistics Decisions
In July 2003, the Wall Street Journal reported that CSX Corporation and Union Pacific had
begun running trains between New York and Los Angeles in only 63 hours (Machalaba and
Chipello, 2003). Using this service enabled UPS to cut the time for ground deliveries nation-
wide from five business days to four without raising prices. UPS officially announced the new
service in October 2003:
As part of a continuing effort to improve customer service, UPS has completed a major
upgrade of its U.S. ground distribution network, reducing the time it takes for hundreds of
thousands of packages to arrive at their destination every day.
4
e Surface Transportation Board resolves railroad rate and service disputes and reviews proposed railroad mergers.
5
e captive-shipper problem is a market failure; however, it is not entirely clear how large a problem it is. e upper
bound for rates remains regulated, and, because no bulk-commodity shipper can truck its product to an intermodal termi-
nal, it is unclear how many actually do have access to multiple carriers.
6
Intermodal freight refers specifically to a container or trailer on flatcar. Technically, containers are multimodal, since they
may travel by ship and truck as well.
6 The State of U.S. Railroads: A Review of Capacity and Performance Data
e changes, implemented over the past four months, amount to the largest time-in-transit
improvement effort since 1998 when UPS became the first carrier to offer money-back
guarantees on its ground service. Each modification has slashed a full day off the previous
guaranteed delivery time without any change in customer rates or pick-up and delivery
hours.
Shipments from Los Angeles to New York and vice versa, for example, now are guaranteed
to arrive in four business days instead of five. . . . Some of the improvements, such as the
four-day coast-to-coast delivery standard, were made in part through changes in railroad
service. (UPS, 2003)
is new service positioned rail as a viable alternative to trucks for high-value, time-sensitive
freight. However, to maintain the high performance required by UPS to meet its tight sched-
ules, other freight trains were held on sidings to allow the high-speed trains to pass without
needing to slow down. On some sections of the Union Pacific route between Los Angeles
and El Paso, other trains had to be held on sidings for hours (Phillips, 2004). is reduced
the average speed, sometimes referred to in the industry as velocity, on two of Union Pacific’s
busiest corridors. Union Pacific’s operating costs increased because the falling velocity reduced
the productivity of the available crews and the rolling stock. In some cases, crews had to be
replaced before they reached their destinations because of rules limiting the number of hours
they could work. Because locomotives and cars sat idle on sidings, they were unavailable to
move the freight stacking up at rail yards around the country.
While the new service allowed CSX and Union Pacific to improve performance for UPS,
the resulting delays and disruptions degraded service provided to other customers. In addition,
this “hot-train” service began to exacerbate other operational problems—driven by changes
in labor policies, increasing fuel prices, and surging demand from bulk-freight shippers—that
had been troubling Union Pacific that year. ese problems came to a head in March 2004.
News articles in the New York Times and the Wall Street Journal cited the high-speed, trans-
continental service for UPS as a confounding factor (Phillips, 2004; Machalaba, 2004). At
the beginning of April 2004, the railroad decided to cease running the high-speed trains, and
some UPS shipments were shifted back onto trucks (Ruff, 2004).
is example illustrates two important themes. e first is that railroad capacity
constraints—resulting from trains running at different speeds and limited track, cars and loco-
motives, and crews—may lead firms to shift freight among modes. Because of capacity con-
straints, Union Pacific could not sustain the level of performance that UPS required, and some
of its long-haul freight was shifted back onto highways in response. e actions described in
this example resulted from private decisions that mutually benefited UPS and Union Pacific.
e second theme is that those private decisions have public costs. When UPS and Union
Pacific decided to shift those many truckloads of parcels and packages from highway to rail,
they were also reducing traffic accidents, air pollution, and congestion. ese factors did not
likely enter into the firms’ calculations, although Union Pacific ultimately took account of the
rail congestion resulting from running high-speed trains on the same track as its slower trains.
Since the difference in the public costs of different modes of transportation is not reflected in
the rates charged to customers, those costs do not influence the mode choices that shippers
Introduction 7
make. Over the long distance between Los Angeles and Chicago, railroads are more fuel effi-
cient than trucks and do not impose costs on other highway users.
7
e public costs of railroads are not always lower than those for trucks. Railroads impose
other social costs, such as accidents at grade crossings and in rail yards. Trains also emit pollu-
tion, and they are noisy. e social costs of trucks and railroads are different. Quantifying that
gap is challenging because many factors influence these relative costs, including the distance
and grade of the route, travel speed, cargo weight, and the amount of time that the truck or
train is idling. A 2001 study carefully compared the social costs of transporting a ton-mile of
freight by truck and by an intermodal train (see Table 1.2) (Forkenbrock, 2001).
8
While there
are limitations to how the findings of that study should be used, they are appropriate for calcu-
lating the social costs incurred when Union Pacific ended the high-speed service for UPS.
Assuming that each train hauls an average of 90 UPS trailers and that each load weighs 20
tons for a total of 1,800 tons per train and that the highway distance between Los Angeles and
Chicago is just over 2,000 miles, each day that a shipment is diverted from rail an additional
3.6 million ton-miles is shifted onto the nation’s highways. e total social cost of hauling a
ton-mile of freight by truck is $0.012, $0.0084 more than by intermodal train. If these values
and assumptions are reasonable, then every UPS trailer hauled by truck instead of by train
imposes a social cost of approximately $340. If only one train is diverted per week, the addi-
tional annual social cost exceeds $1.5 million. is amount excludes congestion costs. Conges-
tion costs are the value of the delay that an additional truck imposes on all of the other drivers
sharing a highway. Railroads also create congestion at grade crossings.
9
Additional information
and modeling are required to calculate the congestion cost externality. It is plausible that the
Table 1.2
Summary of Truck and Rail Freight Costs (2007 cents per ton-mile)
Type Private Cost
Social Costs Excluding Congestion
Accidents Air Pollution
Greenhouse
Gases Noise
Total Social
Cost
General freight truck 11.69 0.82 0.11 0.21 0.06 1.20
Trains
Heavy-unit 1.65 0.24 0.01 0.03 0.06 0.34
Mixed 1.67 0.24 0.01 0.03 0.06 0.34
Intermodal 3.72 0.24 0.03 0.03 0.06 0.36
Double-stack 1.47 0.24 0.01 0.03 0.06 0.34
SOURCE: Forkenbrock (2001, p. 334).
NOTE: We adjusted the values from 1994 dollars using the consumer price index (CPI). Total social costs differ
slightly from row totals due to rounding.
7
In terms of traffic congestion and accidents.
8
An intermodal train carries intermodal containers and truck trailers on flatcars.
9
An additional train will likely delay other trains. is is different, however, because the railroad internalizes those costs
in its operational decisions. Highway congestion is an externality because the driver of a truck or another car does not inter-
nalize the cost of the delay that he or she causes all the other drivers.